
I didn't get that many reader requests this week and one of the selections was one I had in mind for my pick today. So technically two of them are my "diamonds in the rough" instead of just the one I usually do on Thursdays.
Let's catch up on some of this week's trades. I have a stop set at $36.10 for PFE, since I made a good entry, I'm down less than 1% so I'm giving it a little more rope. BHLB bounced nicely today so that's a keeper and UNG is still holding the 20-EMA despite a nasty decline today. It's well above our stop, but if it can't hold the 20-EMA, I'll sell it and wait for another good entry as that longer-term double-bottom is very enticing.
Yesterday's diamonds in the rough had a stellar day and still look very good. We'll talk about it in the Diamond Mine tomorrow. The registration information is below. I look forward to talking to you all!
Today's "Diamonds in the Rough" are: BLD, DUK, FUBO, PYPL and WW.
 Diamond Mine Information:
Here is 1/8/2020 Diamond Mine recording link. Access Passcode: a7KA6TS=
Register in advance for the next "DecisionPoint Diamond Mine" trading room!
Here is the registration link for FRIDAY, 1/15/2021. Registration & Entry Password: yellow
Please do not share these links! They are for Diamonds subscribers ONLY!
Save the registration confirmation email with login instructions in case Zoom doesn't notify you in time.

It's Free!
***Click here to register for this recurring free DecisionPoint Trading Room on Mondays at Noon ET!***
Did you miss the 1/11/2021 free trading room? Here is a link to the recording. Access Code: ?H++t+d5
For best results, copy and paste the access code to avoid typos.
Welcome to DecisionPoint Daily Diamonds, wherein I highlight five "diamonds in the rough." These are selected from the results of my DecisionPoint scans, which search for stocks that could benefit from the trend and condition of the market. Remember, these are not recommendations to buy or sell, but are the most interesting of the stocks that surfaced in my scans. My objective is to save you the work of the initial, tedious culling process, but you need to apply your own analysis to see if these stocks pique your interest as well. There are no guaranteed winners here!
TopBuild Corp. (BLD)
EARNINGS: 2/23/2021 (BMO)
TopBuild Corp. is an installer and distributor of insulation products and other building products to the U.S. construction industry. It operates through two segments: Installation and Distribution. The Installation segment provides insulation installation services nationwide through its TruTeam contractor services business branches located in the U.S. The Distribution segment distributes insulation and other building products, including rain gutters, fireplaces, closet shelving, and roofing materials through its Service Partners business. The company was founded in February 2015 and is headquartered in Daytona Beach, FL.
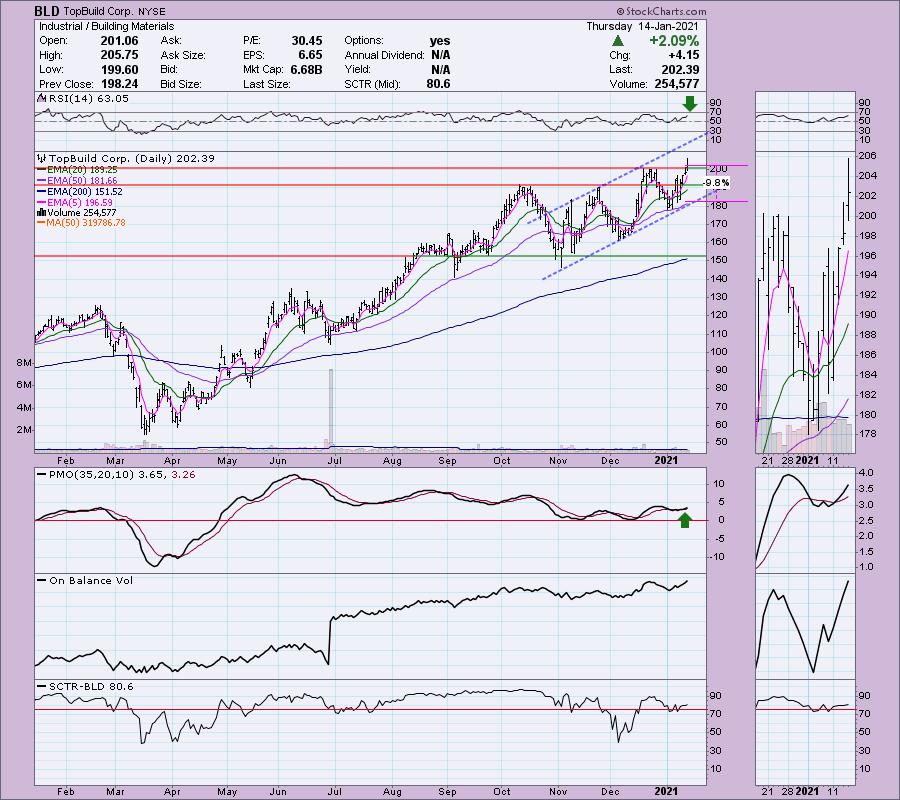
BLD is unchanged in after hours trading. I covered BLD in the September 30th 2020 Diamonds Report (up 18.6%, avoided the stop by pennies on the two late October/early November lows). I like this reader request. We have a rising trend channel in which price is making its way up to the top. The PMO is on a BUY signal and the RSI is positive. The SCTR is in the hot zone above 75. Today's breakout above $200 was impressive.
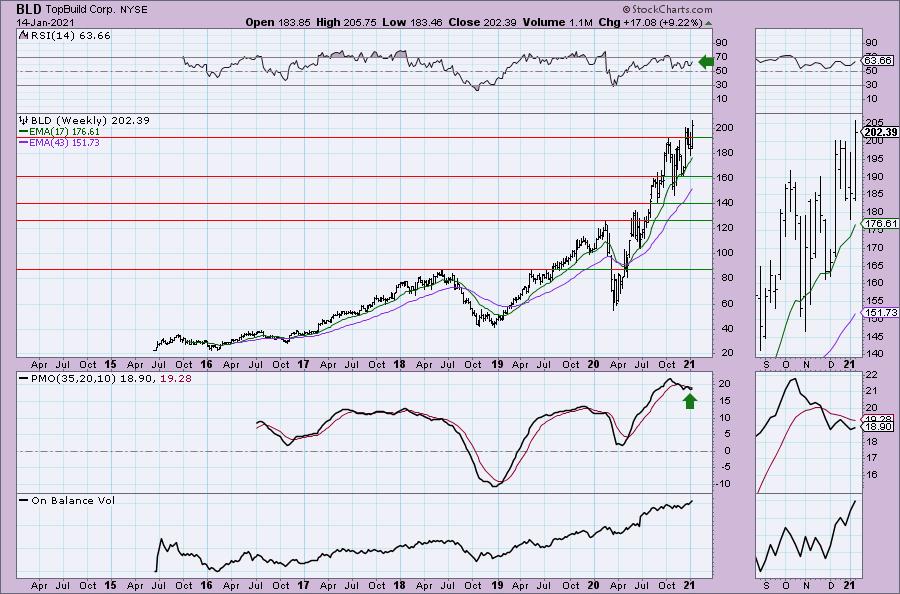
The weekly PMO has ticked up and the RSI is positive. It's been on a steep rising trend, but the OBV continues to confirm it.
Duke Energy Corp. (DUK)
EARNINGS: 2/11/2021 (BMO)
Duke Energy Corp. engages in distribution of natural gas and energy related services. It operates through the following segments: Electric Utilities and Infrastructure, Gas Utilities and Infrastructure, and Commercial Renewables. The Electric Utilities and Infrastructure segment conducts operations primarily through the regulated public utilities of Duke Energy Carolinas, Duke Energy Progress, Duke Energy Florida, Duke Energy Indiana and Duke Energy Ohio. The Gas Utilities and Infrastructure segment focuses on natural gas operations primarily through the regulated public utilities of Piedmont and Duke Energy Ohio. The Commercial Renewables segment acquires, develops, builds, operates, and owns wind and solar renewable generation throughout the continental United States. The company was founded in 1904 and is headquartered in Charlotte, NC.
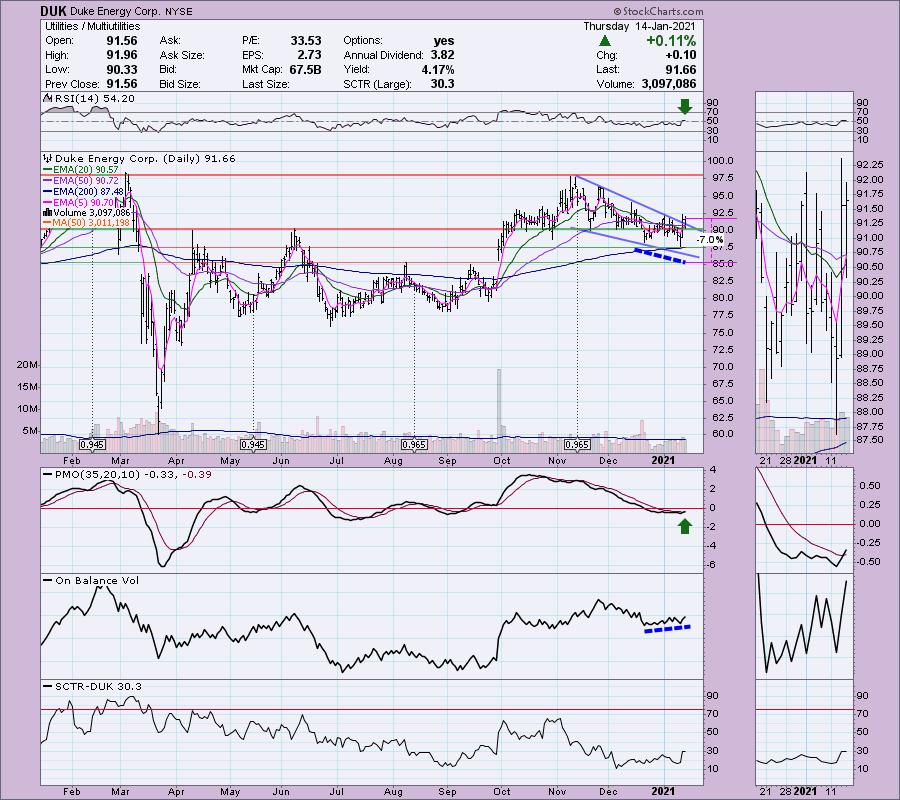
I'll be stalking this one tomorrow. It is down -0.41% in after hours trading so a better entry should be available. There is a bullish falling wedge that executed with yesterday and today's closes breaking out. The PMO just triggered a BUY signal as did the ST Trend Model on the 5-EMA positive cross above the 20-EMA. There is a positive OBV divergence heading into this breakout. The RSI has just moved into positive territory. I'm not a huge fan of this sector, but should the market break its rising trend, Utilities will be a source of refuge.
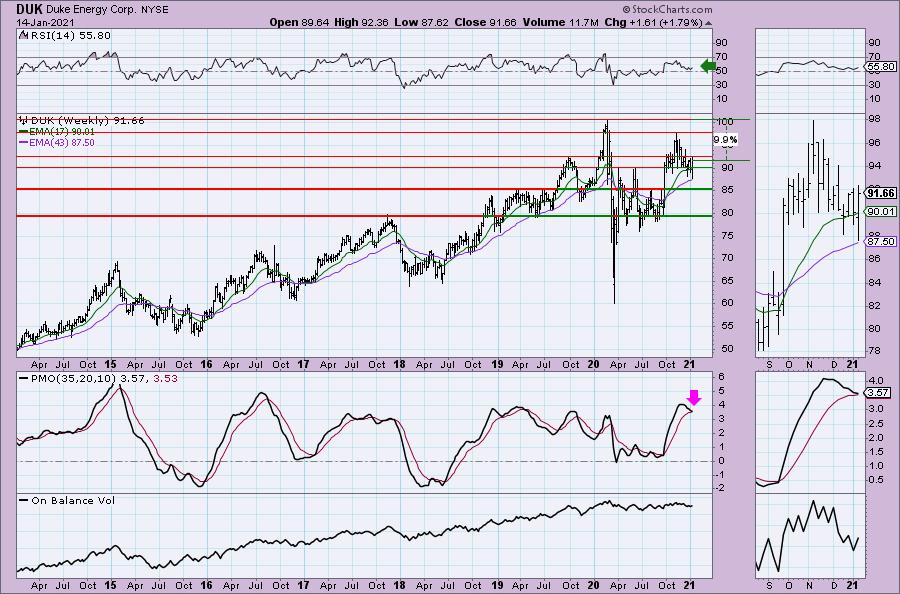
The weekly chart isn't that encouraging given the nearing PMO SELL signal. On the bright side, the RSI is positive and price has held the 43-week EMA. It is struggling with near-term overhead resistance at the 2019 top. Not an intermediate-term trade.
fuboTV Inc. (FUBO)
EARNINGS: 3/25/2021 (AMC)
fuboTV, Inc. is a digital entertainment company. The company is focused on offering consumers a live television (TV) streaming platform for sports, news and entertainment through fuboTV. fuboTV is a virtual multichannel video programming distributor (vMVPD) that streams in 4K. Its subscription-based services are offered to consumers who can sign-up for accounts at https://fubo.tv, through which it provides basic plans with the flexibility for consumers to purchase the add-ons and features suited for them. The company was founded by David Gandler, Alberto Horihuela Suarez, and Sung Ho Choi on February 20, 2009 and is headquartered in New York, NY.
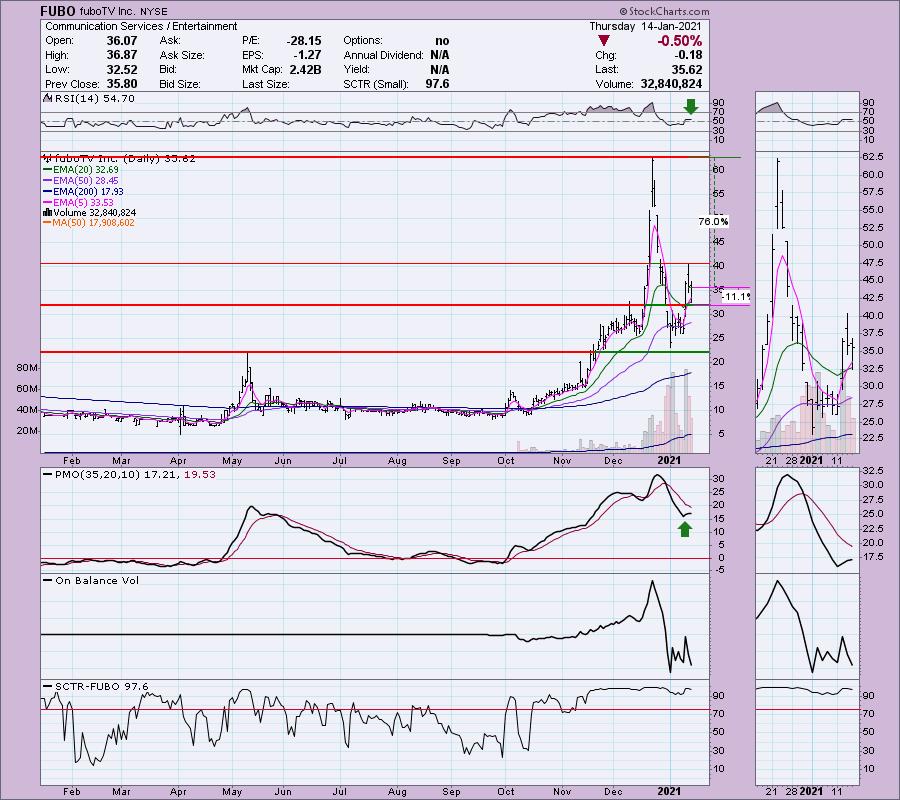
FUBO is down -0.73% in after hours trading. This is a trendy stock right now, I've seen it popping up on social media quite a bit. Not surprising given that huge spike last month. Notice that it behaved as most parabolic stocks, a swift and painful breakdown in a three or four day timeframe. It dropped to the top of the previous basing pattern and is now making its way back up. The PMO is rising again and the RSI is now in positive territory. In the thumbnail you can see that price is holding onto gap support at $32.50. The weekly chart is messed up at StockCharts with weird pricing data, so I put the upside target on the daily chart. If it can reach its prior high in December, that would be a 76% gain. I don't think we will see that, but a decent gain is certainly possible.
Don't forget, on Thursdays I look at reader-requested symbols, so shoot me an email at erin@decisionpoint.com. I read every email I receive and try to answer them all!
PayPal Holdings, Inc. (PYPL)
EARNINGS: 2/3/2021 (AMC)
PayPal Holdings, Inc. engages in the development of technology platform for digital payments. Its solutions include PayPal, PayPal Credit, Braintree, Venmo, Xoom, and Paydiant products. The firm manages a two-sided proprietary global technology platform that links customers, which consist of both merchants and consumers, to facilitate the processing of payment transactions. It allows its customers to use their account for both purchase and paying for goods, as well as to transfer and withdraw funds. The firm also enables consumers to exchange funds with merchants using funding sources, which include bank account, PayPal account balance, PayPal Credit account, credit and debit card or other stored value products. It offers consumers person-to-person payment solutions through its PayPal Website and mobile application, Venmo and Xoom. The company was founded in December 1998 and is headquartered in San Jose, CA.
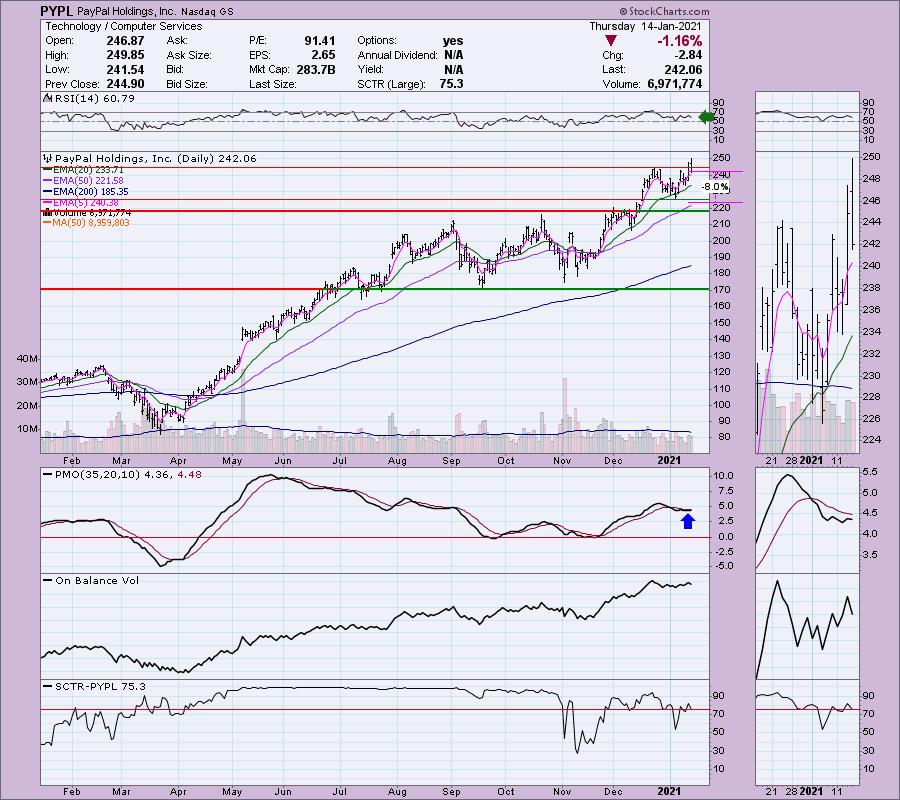
PYPL is up +0.10% in after hours trading. I covered it in the September 29th 2020 Diamonds Report (up +24.5% since, missing the stop by pennies on the November low). The PMO is trying very hard to turn up and give us a crossover BUY signal. Yesterday and today, price broke out but was unable to close above resistance. I don't like how it is behaving right now. The OBV has a negative divergence with price tops. However, you can set a reasonable stop of 8% if you wanted to try it.
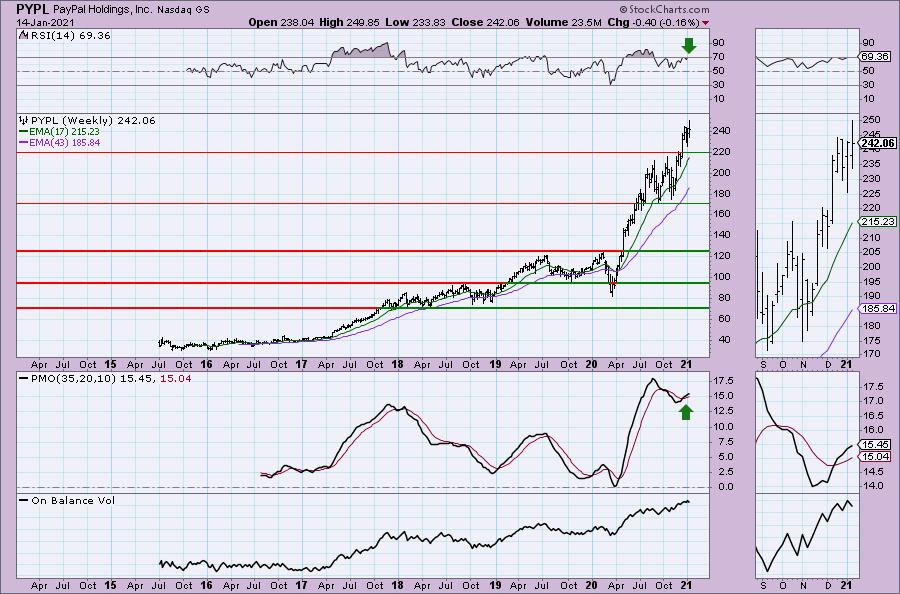
The weekly chart looks pretty good with a positive and not yet overbought RSI and a PMO crossover BUY signal. It does suggest more all-time highs for PYPL.
Weight Watchers Intl Inc. (WW)
EARNINGS: 2/23/2021 (AMC)
WW International, Inc. engages in the provision of weight management services. It operates through the following geographical segments: North America, United Kingdom, Continental Europe and Other. The North America segment consists of United States and Canada Company-owned operations. The United Kingdom segment includes United Kingdom Company-owned operations. The Continental Europe segment comprises of Germany, Switzerland, France, Spain, Belgium, Netherlands, and Sweden Company-owned operations. The others segment offers Australia, New Zealand Company-owned operations, as well as revenues and costs from franchises in the United States. The company was founded by Jean Nidetch in 1963 and is headquartered in New York, NY.
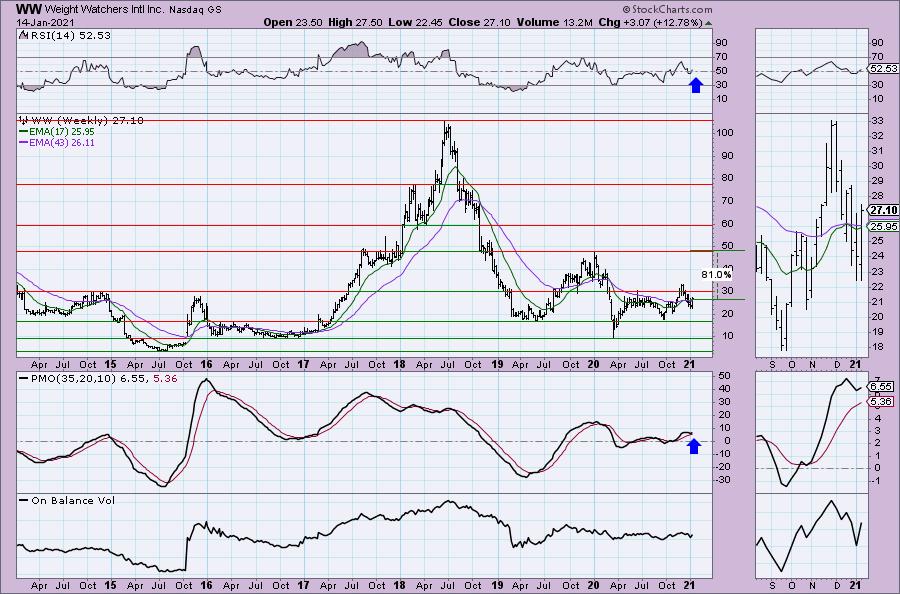
WW is a shared pick and is up 1.44% in after hours trading even after a 6.9% gain today. This chart looks great with a newly positive RSI and rising PMO that is going in for a crossover BUY signal. There is a double-bottom pattern that executed with today's big gain. The SCTR is turning up. The OBV isn't that favorable given the amount of distribution that occurred in December. Today's surge was on high volume, but not as high as we would like.

The weekly PMO is bottoming above the signal line which is especially bullish. The RSI is headed back into positive territory. I don't know that it will reach that 81% upside potential gain, but even a test of the December top would be a tidy 20%+ gain.
Full Disclosure: I'm about 55% invested and 45% is in 'cash', meaning in money markets and readily available to trade with. I'll be stalking DUK tomorrow.
Current Market Outlook:
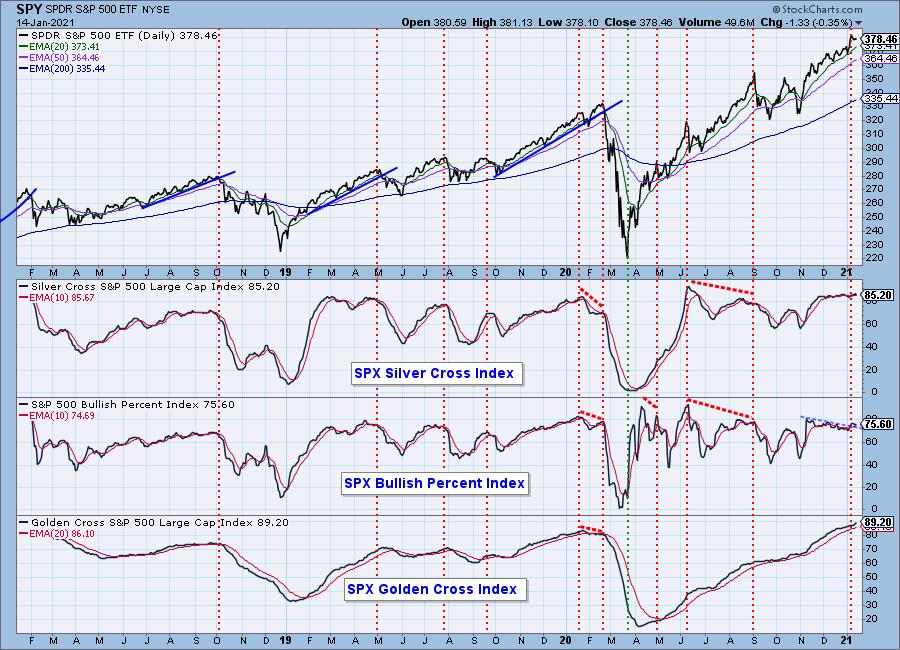
Market Environment: It is important to consider the odds for success by assessing the market tides. The following chart uses different methodologies for objectively showing the depth and trend of participation for intermediate- and long-term time frames.
- The Silver Cross Index (SCI) shows the percentage of SPX stocks on IT Trend Model BUY signals (20-EMA > 50-EMA)
- The Golden Cross Index (GCI) shows the percentage of SPX stocks on LT Trend Model BUY signals (50-EMA > 200-EMA)
- The Bullish Percent Index (BPI) shows the percentage of SPX stocks on Point & Figure BUY signals.
Don't forget that as a "Diamonds" member, you have access to our GCI/SCI curated ChartList on DecisionPoint.com. You'll find it under "Members Only" links on the left side on the Blogs and Links Page.
Here is the current chart:
Diamond Index:
- Diamond Scan Results: 24
- Diamond Dog Scan Results: 6
- Diamond Bull/Bear Ratio: 4.00
I'm in the process of trying to plot the Diamond Index, but with time at a premium, it is on the back burner.
Technical Analysis is a windsock, not a crystal ball.
Happy Charting!
- Erin
erin@decisionpoint.com
Watch the latest episode of DecisionPoint with Carl & Erin Swenlin on Mondays 7:00p EST or on the DecisionPoint playlist on the StockCharts TV YouTube channel here!
NOTE: The stocks reported herein are from mechanical trading model scans that are based upon moving average relationships, momentum and volume. DecisionPoint analysis is then applied to get five selections from the scans. The selections given should prompt readers to do a chart review using their own analysis process. This letter is not a call for a specific action to buy, sell or short any of the stocks provided. There are NO sure things or guaranteed returns on the daily selection of "diamonds in the rough."
Helpful DecisionPoint Links:
DecisionPoint Shared ChartList and DecisionPoint Chart Gallery
Price Momentum Oscillator (PMO)
Swenlin Trading Oscillators (STO-B and STO-V)
For more links, go to DecisionPoint.com!