
Today is reader request day, but I found two stocks that I just had to share so forgive me for taking up an extra reader request spot. One of the reader requests is in the REIT area that I brought to your attention yesterday. Of course on a big rally day, it wasn't surprising to see XLRE pullback, but I still think exposure to this area of the market and other defensive areas will outperform very soon as the market is most certainly ready for a sizable pullback. Add some of this week's defensive plays to your watch lists. They're showing strength right now and will multiply that strength when the market finally starts to correct.
See you in the Diamond Mine tomorrow! If you haven't registered, please do so now. That way I can send you the join link right before I open the room. Remember, if you can't attend, feel free to email symbol requests and you can watch the recording. I save the cloud recordings for two weeks, but you can download the recordings if you want to keep them longer.
Today's "Diamonds in the Rough" are: ADP, BRX, ITB,MKTX and NWS.
 Diamond Mine Information:
Here is last Friday's (1/22/2021) RECORDING. Access Passcode: 9W%Y..HU
===============================================================================
Register in advance for the next "DecisionPoint Diamond Mine" trading room on FRIDAY (1/29/2021) 12:00p ET:
Here is the Registration Link & Entry Password: diamonds
Please do not share these links! They are for Diamonds subscribers ONLY!
Save the registration confirmation email with login instructions. I will send out the link to join right before the webinar to REGISTERED attendees in case you didn't get the email from Zoom. Register early.

It's Free!
 Mark Young, CMT of WallStreetSentiment.com will be joining me in the free trading room on February 1st! He has all the latest sentiment data and will give his opinion on your symbol requests too!
"Investor sentiment is one of the most powerful forces in the stock market. It can make the difference between selling out at a market low and buying there." -- Mark Young, CMT
***Click here to register for this recurring free DecisionPoint Trading Room on Mondays at Noon ET!***
Did you miss the 1/25 trading room? Here is a link to the recording -- access code: y&aLh1Xr
For best results, copy and paste the access code to avoid typos.
Welcome to DecisionPoint Daily Diamonds, wherein I highlight five "diamonds in the rough." These are selected from the results of my DecisionPoint scans, which search for stocks that could benefit from the trend and condition of the market. Remember, these are not recommendations to buy or sell, but are the most interesting of the stocks that surfaced in my scans. My objective is to save you the work of the initial, tedious culling process, but you need to apply your own analysis to see if these stocks pique your interest as well. There are no guaranteed winners here!
Automatic Data Processing, Inc. (ADP)
EARNINGS: 4/28/2021 (BMO)
Automatic Data Processing, Inc. engages in the provision of business outsourcing solutions specializes in cloud-based human capital management. It operates through the following business segments: Employer Services; and Professional Employer Organization Services; and Other. The Employer Services segment provides clients ranging from single-employee small businesses to large enterprises with tens of thousands of employees around the world, offering a range of human resources outsourcing and technology-based human capital management solutions, including strategic, cloud-based platforms. The Professional Employer Organization Services segment offers small and mid-sized businesses a human resources outsourcing solution through a co-employment mode. The company was founded by Henry Taub in 1949 and is headquartered in Roseland, NJ.
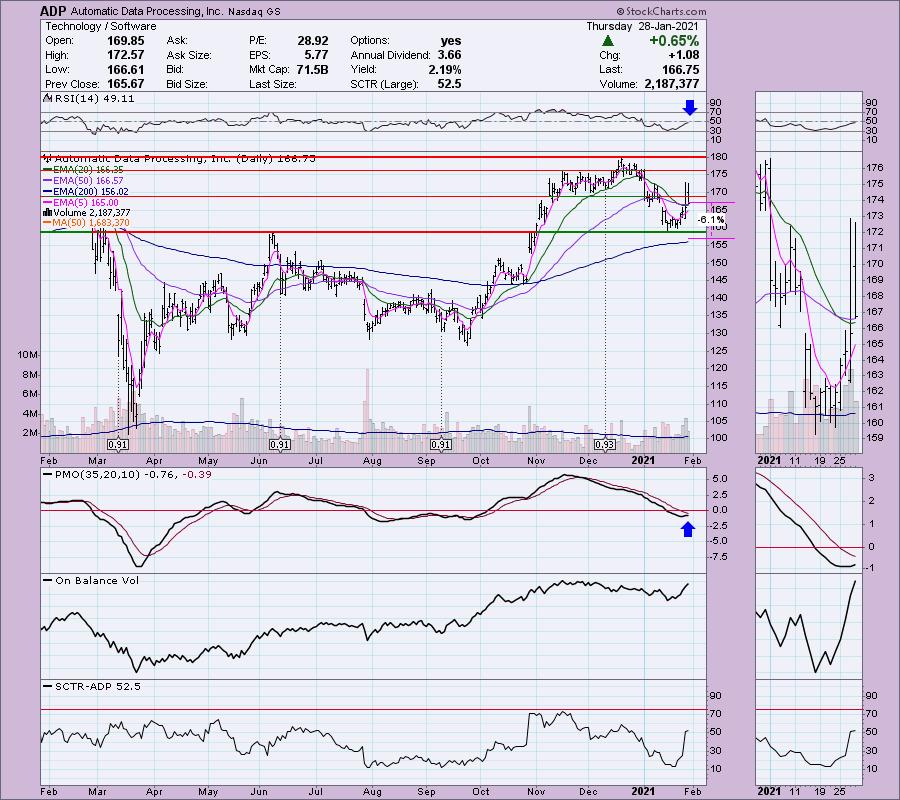
This my first of two additions today: ADP is down -0.97% in after hours trading. They reported earnings yesterday and spiked. Today, it spiked again but did close near the lows for the day. It traded completely above the 50-EMA and you can see that has brought the 20-EMA up toward a IT Trend Model BUY signal. The PMO is bottoming and the RSI is just about ready to turn positive. Volume is coming in. The stop can be set fairly tight at 6% or you could stretch it out past the 200-EMA. Strong support lies at the June top and if it lost that, I wouldn't want it.
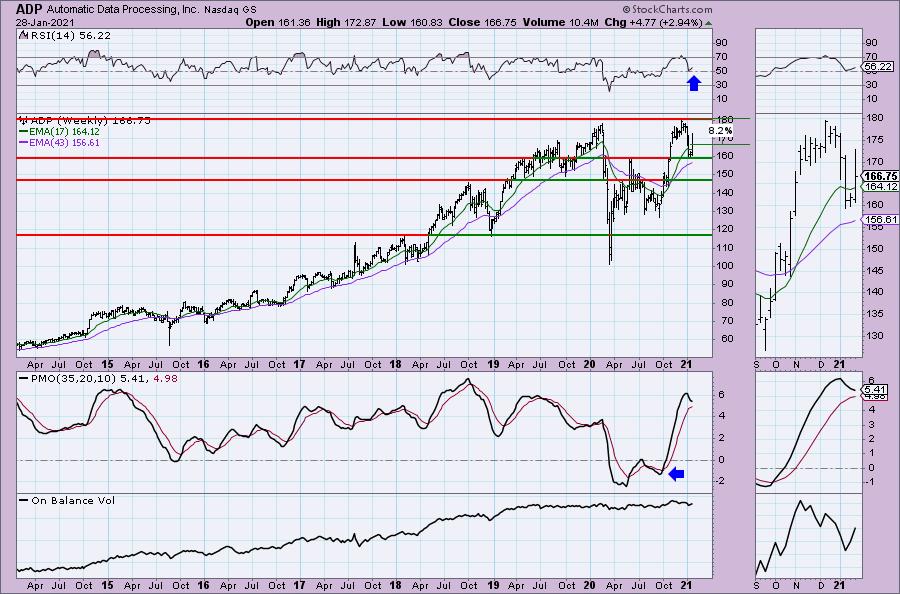
The weekly PMO is declining but also decelerating on this week's bounce. The RSI avoided negative territory.
Brixmor Property Group Inc. (BRX)
EARNINGS: 2/11/2021 (AMC)
Brixmor Property Group, Inc. operates as real estate investment trust. It owns and operates wholly owned portfolio of grocery anchored community and neighborhood shopping centers. The company was founded in 1985 and is headquartered in New York, NY.
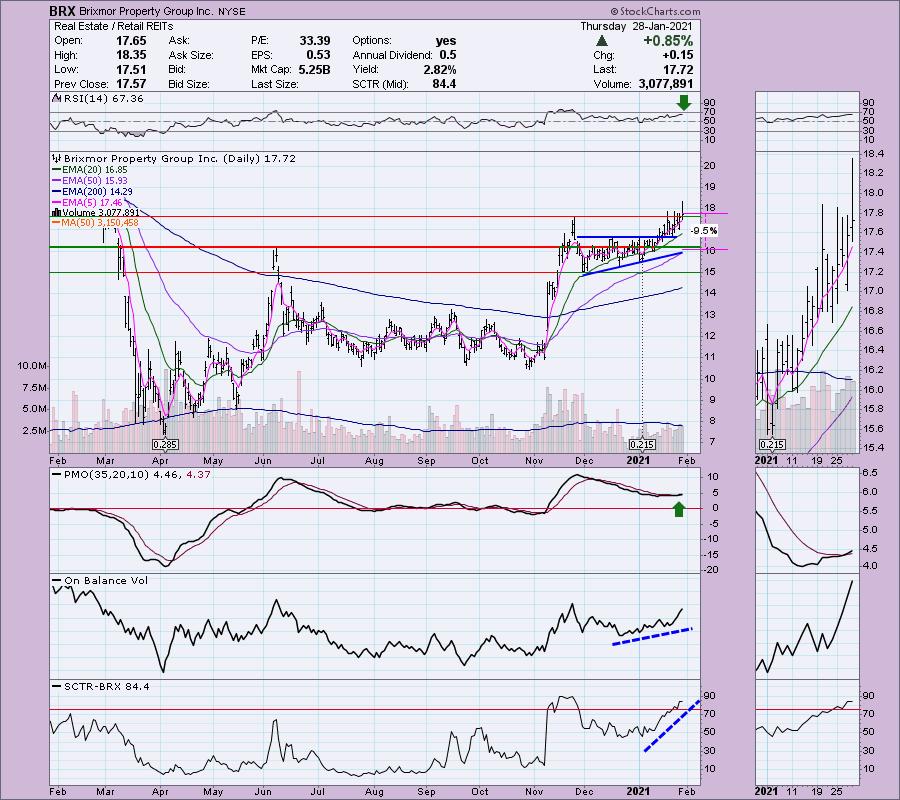
This one is actually down -8.8% in after hours trading so a better entry will definitely be available on it. Interestingly, this reader request arrived yesterday. As I was preparing this report today, I noticed that BRX had come in on one of my scans yesterday but I didn't present it. Well the chart is ripe now and it is in the Real Estate sector which I like right now. You can see BRX broke out of a bullish ascending triangle. The PMO has just triggered a BUY signal and the RSI is positive. The OBV is confirming the rising trend and the SCTR has entered the "hot zone" above 75. A quick review: The StockCharts Technical Ranking (SCTR) measures internal strength based on various calculations. The result of the measurement of internal strength that is then translated into a "ranking" amongst its peers by comparing its score to others' scores. The SCTR also is skewed to the intermediate term which I also find powerful.
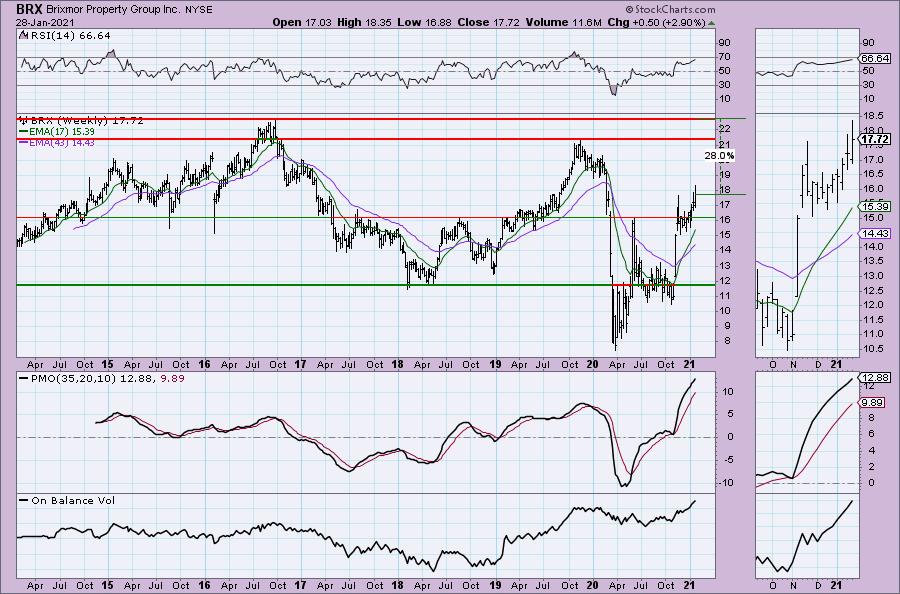
Upside potential is tasty. I worry a bit about the very overbought PMO, but as you can see, the PMO hasn't been around very long in the grand scheme, so it is hard to really tell what overbought/oversold levels truly are.
iShares U.S. Home Construction ETF (ITB)
EARNINGS: N/A
ITB tracks a market-cap-weighted index of companies involved in the production and sale of materials used in home construction.
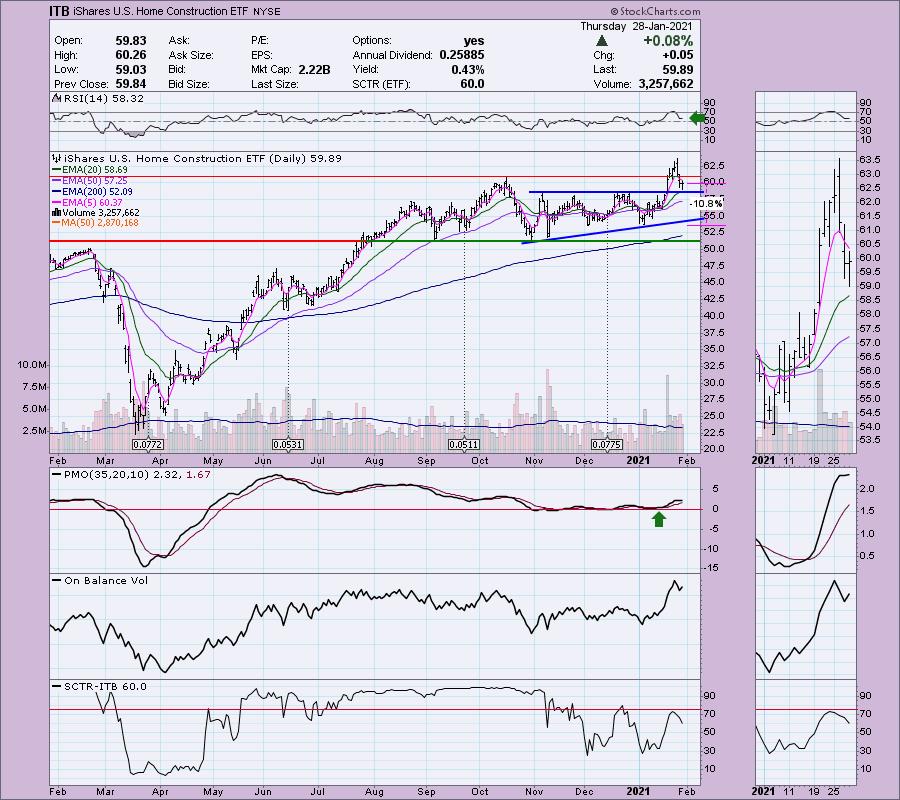
This requested ETF is unchanged in after hours trading. I covered it back on July 20th 2020. The stop was never hit and it is up 24.7% since. Last week Home Builders were our big winner in Diamonds so it isn't surprising to see a pullback on the Home Construction ETF (ITB). The good news is that it pulled back right to support at the top of the bullish ascending triangle that it broke from previously. The pullback damaged the PMO slightly, but it constructively pulled the RSI out of overbought territory. This area continues to look good moving forward. The stop level is set at the December low.
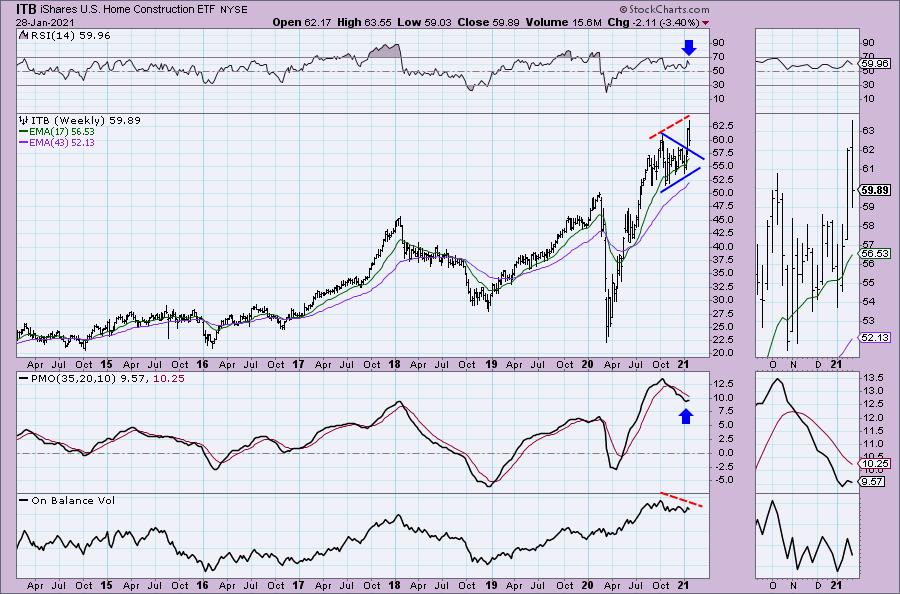
Last week's breakout was impressive on ITB. It managed to yank the PMO upward. This week's pullback is having the opposite effect, setting up a very bearish top below the signal line for the PMO. I'm okay with that as long as it hold support around $58.
Don't forget, on Thursdays I look at reader-requested symbols, so shoot me an email at erin@decisionpoint.com. I read every email I receive and try to answer them all!
MarketAxess Holdings Inc. (MKTX)
EARNINGS: 4/28/2021 (BMO)
MarketAxess Holdings, Inc. operates as an electronic trading platform that allows investment industry professionals to trade corporate bonds and other types of fixed-income instruments. It also provides data and analytical tools that help its clients to make trading decisions and facilitate the trading process by electronically communicating order information between trading counterparties. The firm's patented trading technology allows institutional investor clients to request competitive, executable bids, or offers from multiple broker dealers simultaneously and to execute trades with the broker dealer of their choice. The company was founded by Richard M. Mcvey on April 11, 2000 and is headquartered in New York, NY.
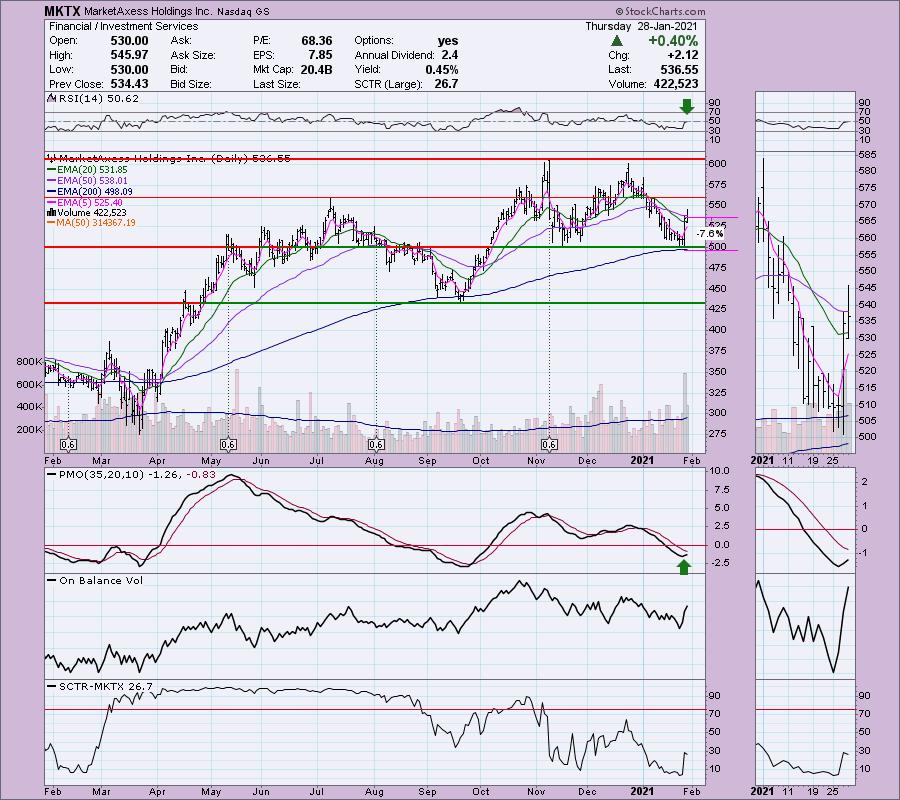
This is my second pick. MKTX is unchanged in after hours trading. They reported earnings yesterday and based on the big breakout move, they were well-received. The rally continued today and now the PMO is rising toward a crossover BUY signal. The RSI just moved positive today. The OBV shows plenty of interest based on increased positive volume. The SCTR is rather low, but it is improving.
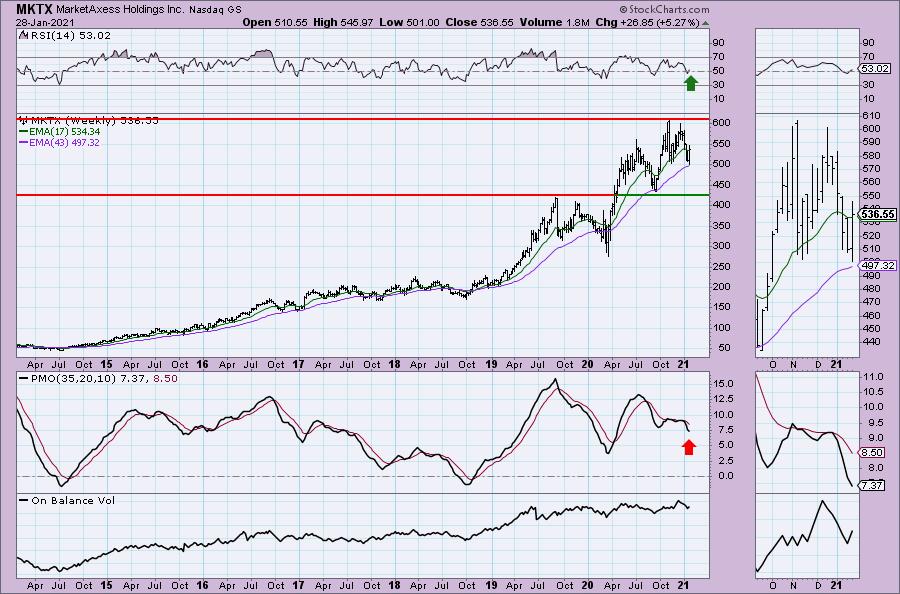
The weekly chart isn't great but we do have a positive RSI that is not at all overbought. Price has landed on important support along the 43-week EMA and the November low. Might want to make sure the bounce off this support area truly materializes.
News Corp. (NWS)
EARNINGS: 2/4/2021 (AMC)
News Corp. engages in the creation and distribution of media, news, education, and information services. It operates through the following segments: News and Information Services, Book Publishing, Digital Real Estate Services, Subscription Video Services, and Other. The News and Information Services segment consists of Dow Jones, News Corp Australia, News UK, the New York Post, and News America Marketing. The Book Publishing segment consists of HarperCollins which publishes and supply consumer books through print, digital, and audio formats. The Digital Real Estate Services segment offers property and property-related advertising and services as well as financial services. The Subscription Video Services segment provides video sports, entertainment, and news services to pay-TV subscribers, and other commercial licensees via cable, satellite and Internet Protocol, and distribution. The Other segment refers to general corporate overhead expenses, corporate strategy group, and costs related to the U.K. Newspaper Matters. The company was founded in 1979 and is headquartered in New York, NY.
NWS is unchanged in after hours trading. I like the set-up on this one with the PMO rising toward a crossover BUY signal and a very positive RSI. I like that it broke out yesterday and pulled back today without losing support. We did have a fake out breakout earlier in the month. This time it had nice follow-through above support. The SCTR just entered the hot zone and the OBV is confirming the rally.
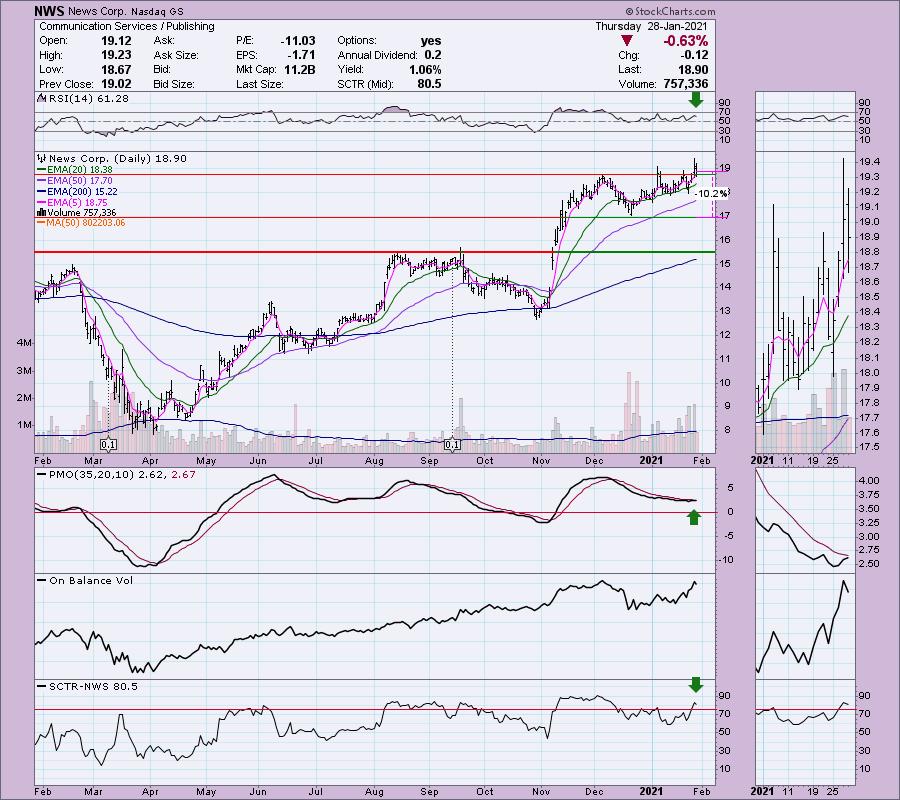
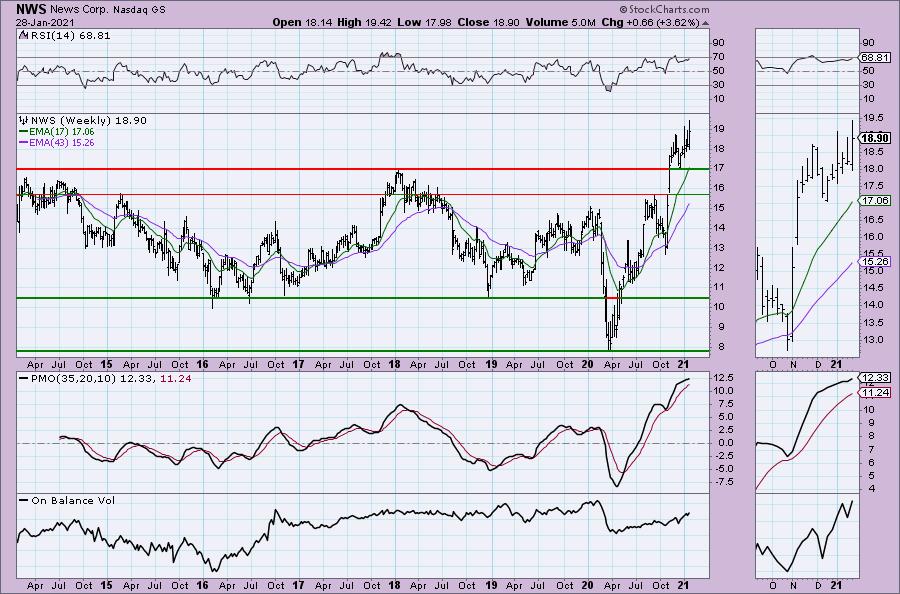
The pullback to $17 and subsequent bounce gave us information that this one would travel higher. The PMO has now accelerated its ascent. The weekly OBV isn't great in that it did not breakout with price and is forming a long-term negative divergence with the current top and the 2018 top. That's a long-term concern. Short term looks bullish.
Full Disclosure: I'm about 80% invested and 20% is in 'cash', meaning in money markets and readily available to trade with. BLL was sold today. My stops are in place in case today was only the beginning of a sizable market decline.
Current Market Outlook:
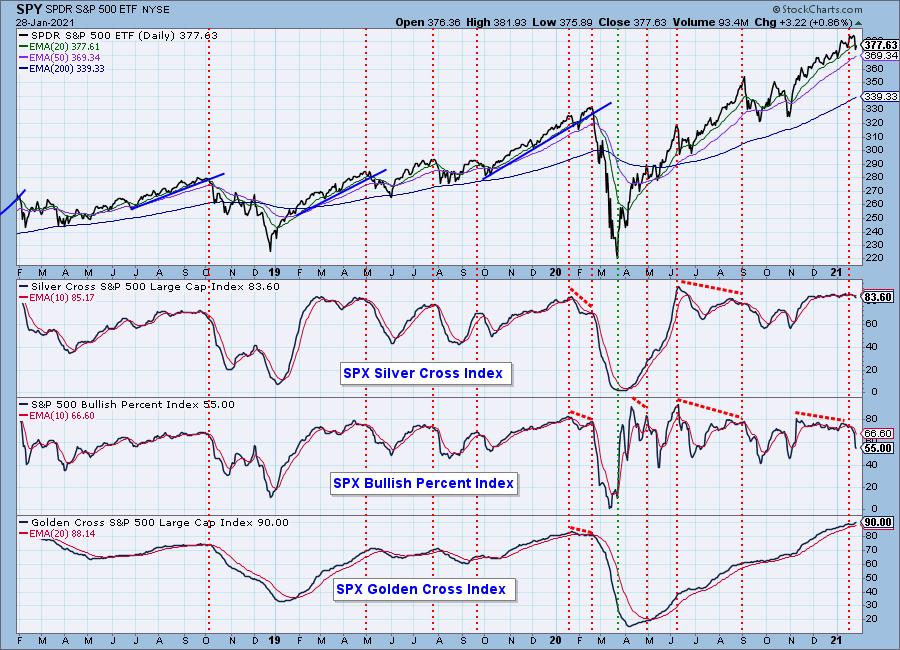
Market Environment: It is important to consider the odds for success by assessing the market tides. The following chart uses different methodologies for objectively showing the depth and trend of participation for intermediate- and long-term time frames.
- The Silver Cross Index (SCI) shows the percentage of SPX stocks on IT Trend Model BUY signals (20-EMA > 50-EMA)
- The Golden Cross Index (GCI) shows the percentage of SPX stocks on LT Trend Model BUY signals (50-EMA > 200-EMA)
- The Bullish Percent Index (BPI) shows the percentage of SPX stocks on Point & Figure BUY signals.
Don't forget that as a "Diamonds" member, you have access to our GCI/SCI curated ChartList on DecisionPoint.com. You'll find it under "Members Only" links on the left side on the Blogs and Links Page.
Here is the current chart:
Diamond Index:
- Diamond Scan Results: 2
- Diamond Dog Scan Results: 7
- Diamond Bull/Bear Ratio: 0.29
I'm in the process of trying to plot the Diamond Index, but with time at a premium, it is on the back burner.
Technical Analysis is a windsock, not a crystal ball.
Happy Charting!
- Erin
erin@decisionpoint.com
Watch the latest episode of DecisionPoint with Carl & Erin Swenlin on Mondays 7:00p EST or on the DecisionPoint playlist on the StockCharts TV YouTube channel here!
NOTE: The stocks reported herein are from mechanical trading model scans that are based upon moving average relationships, momentum and volume. DecisionPoint analysis is then applied to get five selections from the scans. The selections given should prompt readers to do a chart review using their own analysis process. This letter is not a call for a specific action to buy, sell or short any of the stocks provided. There are NO sure things or guaranteed returns on the daily selection of "diamonds in the rough."
Helpful DecisionPoint Links:
DecisionPoint Shared ChartList and DecisionPoint Chart Gallery
Price Momentum Oscillator (PMO)
Swenlin Trading Oscillators (STO-B and STO-V)
For more links, go to DecisionPoint.com!