
Every Monday on the DecisionPoint Show, I present a "Diamond of the Week". Last week's DP Show "Diamond of the Week", Sunrun (RUN), finished the week with a 35%+ gain. I generally don't include the DP Show's "Diamond of the Week" in the Diamonds Reports, but I thought this was a good time to. First, Pfizer (PFE) had a big decline today (of course, right?), however, I still bought it today. I'll show you why.
I also added BHLB which was a diamond last Thursday. Using my 5-minute candlestick chart method to enter both positions during the day, I finished with profits when the market closed. In fact, even with PFE down -1.56% on the day, I managed a 0.70% profit.
I've been watching Natural Gas (UNG) and I believe we have another entry point available. I'll be adding it tomorrow if it behaves. I'll explain what I mean below.
Today's "Diamonds in the Rough" are: CVLG, PFE, REPL, UNG and XP.
 Diamond Mine Information:
Here is 1/8/2020 Diamond Mine recording link. Access Passcode: a7KA6TS=
Register in advance for the next "DecisionPoint Diamond Mine" trading room!
Here is the registration link for FRIDAY, 1/15/2021. Registration & Entry Password: yellow
Please do not share these links! They are for Diamonds subscribers ONLY!
Save the registration confirmation email with login instructions in case Zoom doesn't notify you in time.

It's Free!
***Click here to register for this recurring free DecisionPoint Trading Room on Mondays at Noon ET!***
Did you miss the 1/11/2021 free trading room? Here is a link to the recording. Access Code: ?H++t+d5
For best results, copy and paste the access code to avoid typos.
Welcome to DecisionPoint Daily Diamonds, wherein I highlight five "diamonds in the rough." These are selected from the results of my DecisionPoint scans, which search for stocks that could benefit from the trend and condition of the market. Remember, these are not recommendations to buy or sell, but are the most interesting of the stocks that surfaced in my scans. My objective is to save you the work of the initial, tedious culling process, but you need to apply your own analysis to see if these stocks pique your interest as well. There are no guaranteed winners here!
Covenant Logistics Group, Inc (CVLG)
EARNINGS: 1/25/2021 (AMC)
Covenant Logistics Group, Inc. is a holding company, which engages in the provision of freight and logistics services. It operates through the following segments: Highway Services and Dedicated Contract Services. The Highway Services Segment includes two separate service offerings: Expedited Services (Expedited) and Over-the-Road Services (OTR), both of which transport one-way freight over nonroutine routes. The Dedicated Contract Services Segment provides similar transportation services, but does so pursuant to agreements whereby equipment available to a specific customer for shipments over particular routes at specified times. The company was founded by David Ray Parker in 1985 and is headquartered in Chattanooga, TN.
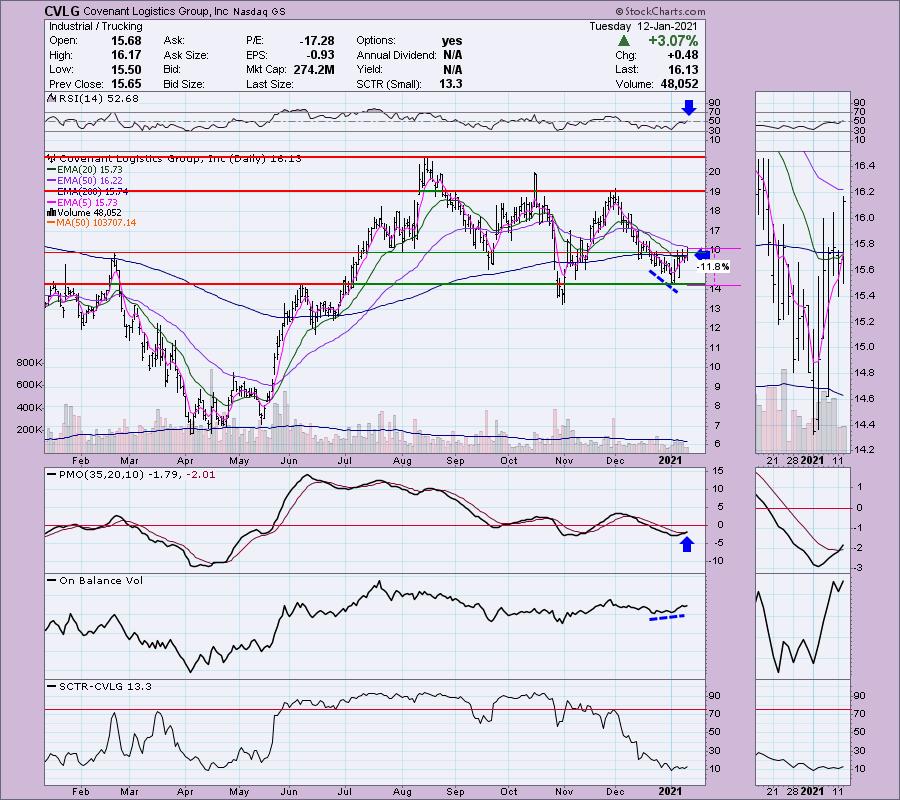
CVLG is unchanged in after hours trading. I covered it in the September 29th 2020 Diamonds Report. It is down -9.08% since then. More detail, it was up over 12% when it topped in October, but then hit its $16 stop on the end of October drop. So you either made some money with a sale or you hit the 10% stop. Just wanted to clarify.
The chart looks very good right now. It was a big gain today and that may require some decline tomorrow. The PMO just had a crossover BUY signal and the ST Trend Model triggered a BUY signal as the 5-EMA crossed above the 20-EMA. There is a subtle OBV positive divergence. The 50-EMA could pose a problem and is the perfect place for it to pullback. We want it to stay above the February top.
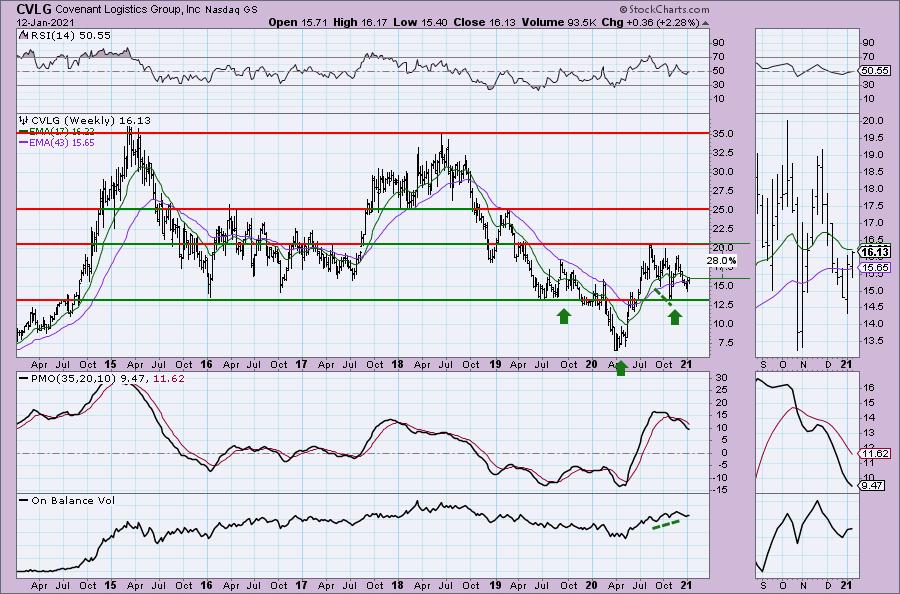
The weekly chart is mixed. I like the upside potential and the positive RSI, but the PMO needs work. It is decelerating and I spot a positive OBV divergence in the intermediate term.
Pfizer, Inc. (PFE)
EARNINGS: 2/2/2021 (BMO)
Pfizer Inc. engages in the discovery, development, and manufacture of healthcare products specializes in medicines, vaccine, and consumer healthcare. It operates through the Pfizer Innovative Health (IH) and Pfizer Essential Health (EH) segments. The IH segment focuses on the development and commercializing medicines and vaccines for internal medicine, oncology, inflammation and immunology, rate disease, and consumer healthcare. The EH segment is involved in development and supply of branded generics, generic sterile injectable products, biosimilars, and select branded products including anti-infectives. The company was founded by Charles Pfizer Sr. and Charles Erhart in 1849 and is headquartered in New York, NY.
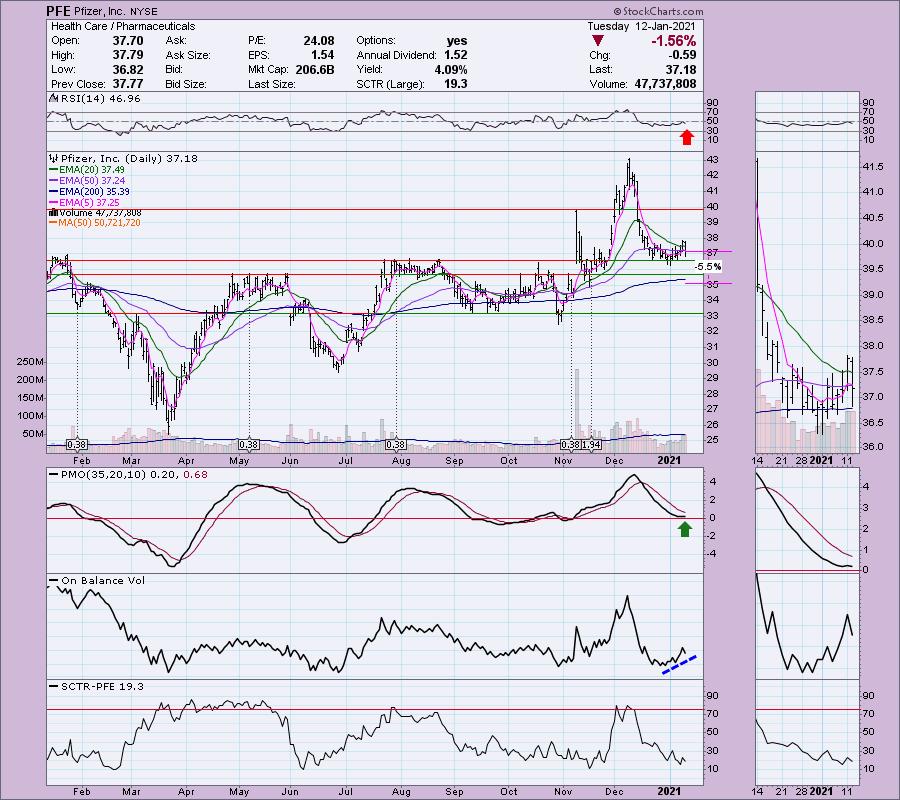
This was yesterday's "Diamond of the Week" for the DP Show. And, full disclosure, I did purchase it. Currently it is down -0.16% in after hours trading. The RSI has turned down which I don't like and the PMO has flattened. I still like the OBV confirming the current rising trend. After popping above the 20-EMA yesterday, it closed below it today. I decided to purchase it mainly because the stop level is tight. I don't think I'll hold it if it loses short-term support at the December low, but you could also wait until it hits the 200-EMA or moves below it.
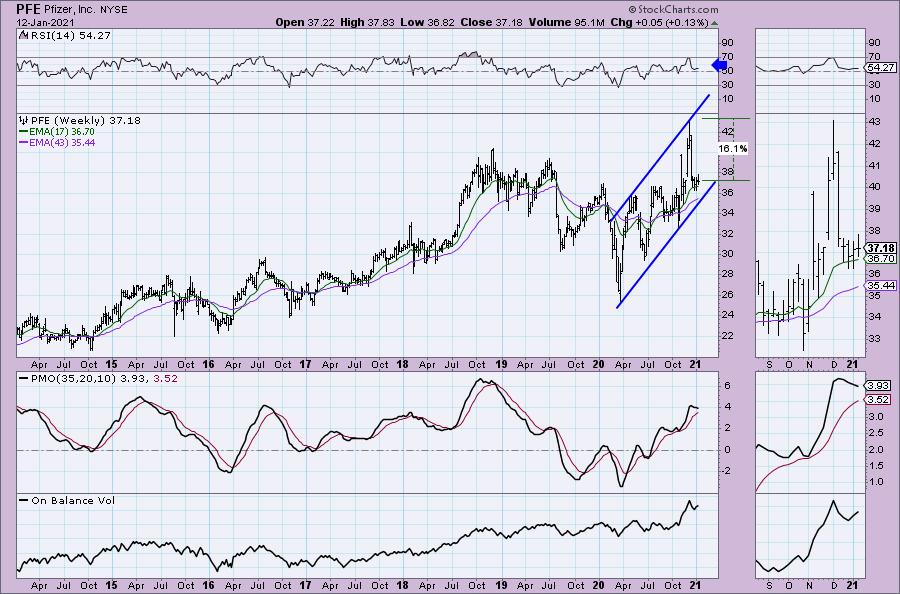
The weekly chart shows a positive RSI and a long-term rising trend channel. The PMO is decelerating somewhat, but it is pointed down. Should it lose the 200-EMA above or the 43-week EMA below, the rising trend will be in jeopardy which is why I wouldn't let it overstay its welcome in my portfolio.
Replimune Group, Inc. (REPL)
EARNINGS: 2/11/2021 (BMO)
Replimune Group, Inc. is a clinical-stage biotechnology company, which engages in the development of oncolytic immunotherapy product candidates through immulytic platform. Oncolytic immunotherapy is a cancer treatment that exploits the ability of certain viruses to selectively replicate in and directly kill tumors, as well as induce a potent, patient-specific, anti-tumor immune response. The company was founded by Philip Astley-Sparke, Colin Love and Robert Coffin in March 2015 and is headquartered in Woburn, MA.
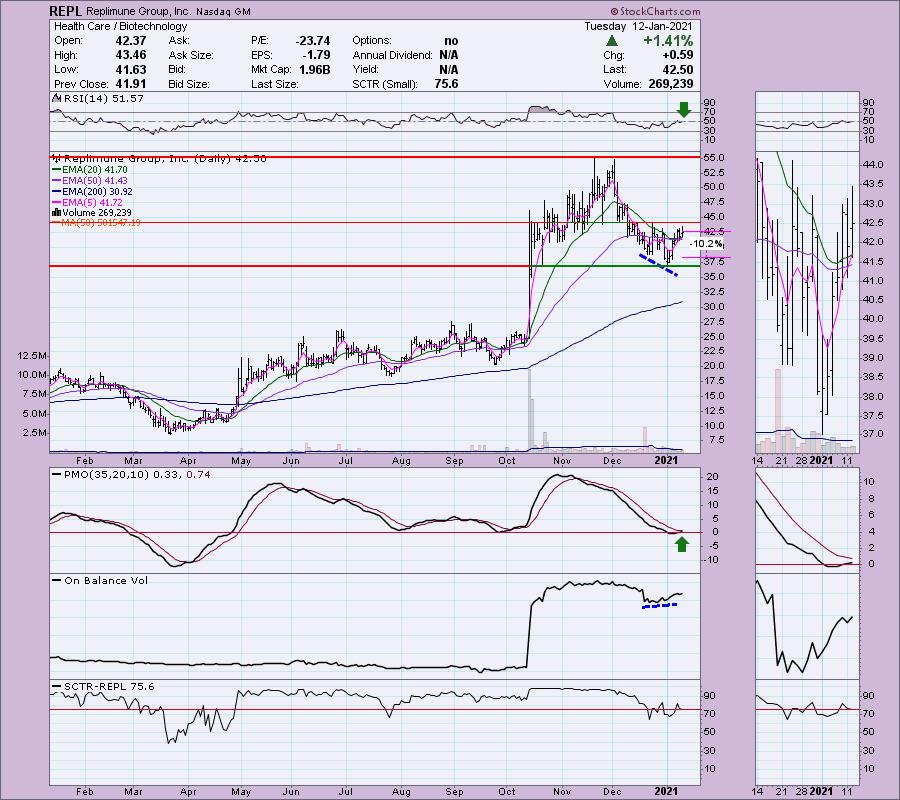
REPL is unchanged in after hours trading. This one has a positive OBV divergence leading into the current rally off the second bottom of a bullish double-bottom pattern. The PMO has bottomed and has entered positive territory above zero. The RSI is positive now. The risk here is that it won't breakout to execute the double-bottom pattern. If it fails this time around, you may not want to give it a long leash. To get to strong support, it would take a decline well over 10%.
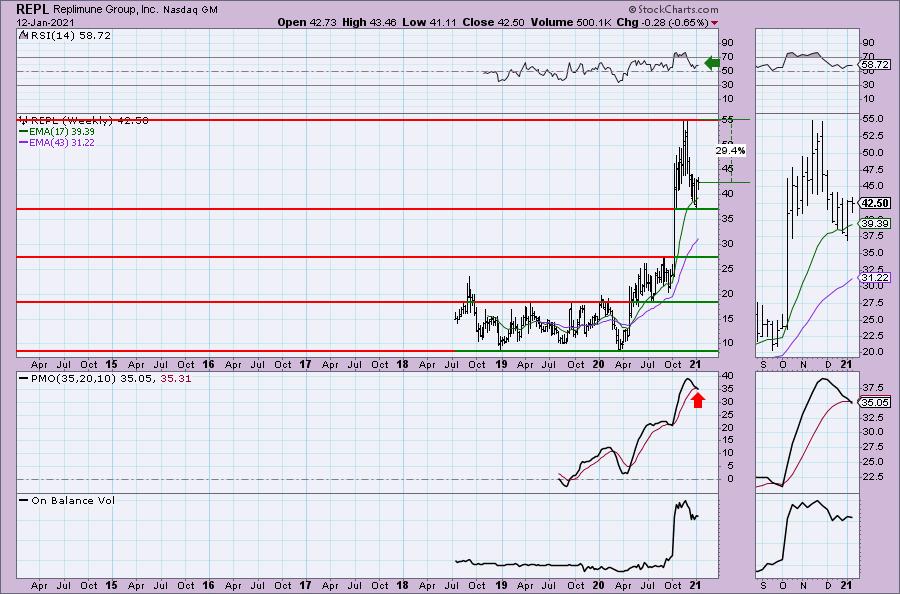
The weekly PMO is triggering a possible SELL signal (we must wait until after the close on Friday to confirm if this finishes the week with that SELL signal intact). However, I like the level it bounced off and the fact we have a positive RSI. Upside potential is good if we can reach the 2020 top.
Don't forget, on Thursdays I look at reader-requested symbols, so shoot me an email at erin@decisionpoint.com. I read every email I receive and try to answer them all!
United States Natural Gas Fund (UNG)
EARNINGS: N/A
UNG holds near-month futures contracts in natural gas and swaps on natural gas.
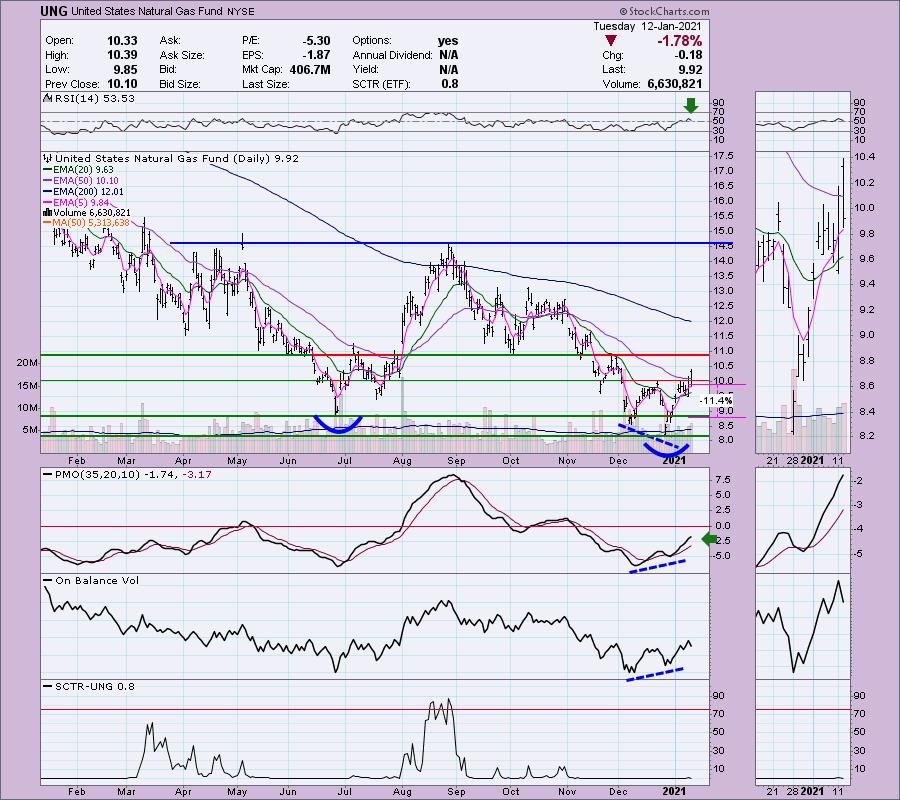
I've covered UNG multiple times, so determining its success requires reading all of the previous material. The last time I covered it was on October 30th 2020. I wasn't thrilled with it as a reader request at that time. The other reports I covered it in: June 11th 2020, July 27th 2020, August 20th 2020 and September 2nd 2020. I watch UNG, along with Carl, regularly. A reader recently emailed me asking my thoughts on it now. I like it! Carl expressed reservations about price action today and its inability to close above the 50-EMA. I agree, but we have the benefit of watching the 5-minute candlestick chart tomorrow to see if we can time an entry or decide that it isn't behaving. Technically, yesterday and today, the double-bottom was executed, it just didn't close above the confirmation line.
It should. We have a beautiful positive OBV divergence on this short-term double-bottom which is one of my favorite plays. There is another double-bottom in the intermediate term, we'll talk about that with the weekly chart. The RSI is positive even after a 1.78% decline. The PMO is rising strongly and saw no damage with today's drop.
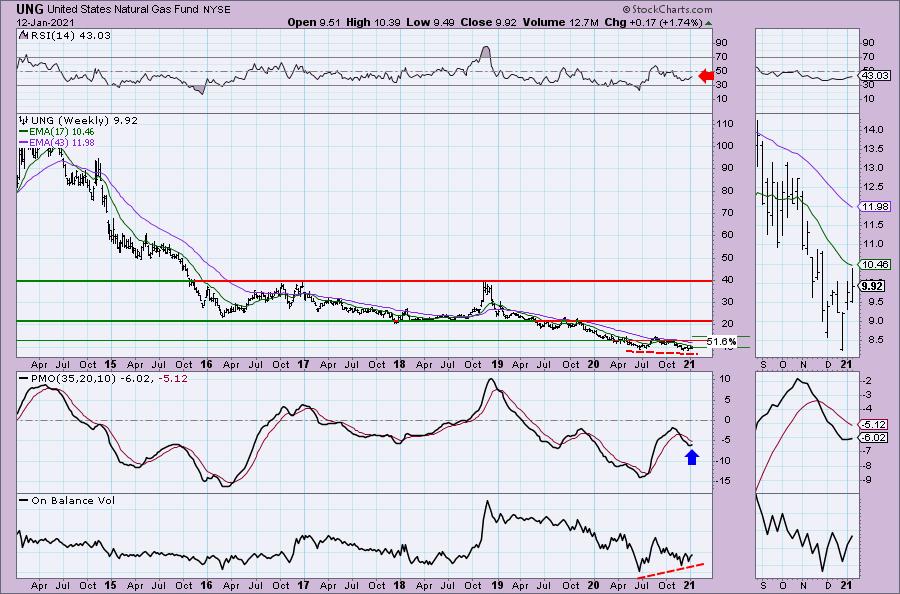
The double-bottom is visible on the weekly chart and you can see that is also sports a positive OBV divergence. The RSI is rising, but still negative. The PMO has now turned up and you can really see the short-term positive OBV divergence in the thumbnail. I'll be stalking this one tomorrow.
XP Inc (XP)
EARNINGS: 3/9/2021
XP, Inc. operates as a technology-driven financial services platform. It offers services in Investments, Technology, Career, and Financial Market. Its product platforms include brokerage securities, fixed income securities, mutual and hedge funds, structured products, pension plans and life insurance, wealth management services and other investment products. The company was founded by Guilherme Dias Fernandes Benchimol in 2001 and is headquartered in Vila Olimpia, Brazil.
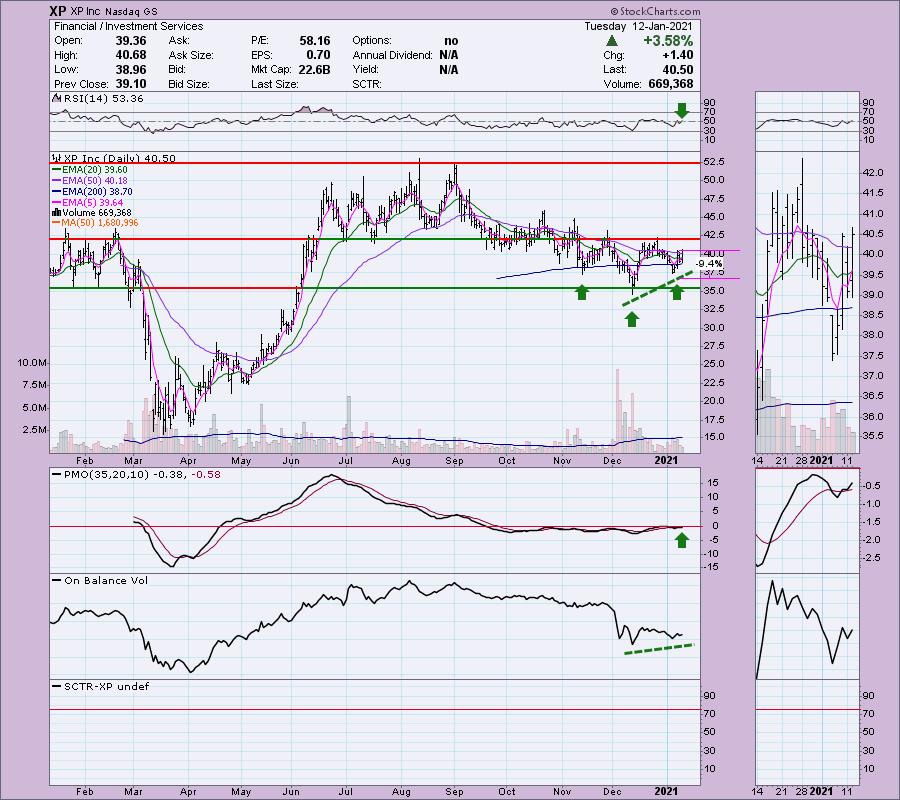
XP is unchanged in after hours trading. We have a bullish reverse head and shoulders pattern with the neckline around $42.50, so it hasn't executed yet. Should it, the minimum upside target would put price very close to its 2020 top. The PMO is back on a crossover BUY signal and the RSI is positive. The OBV is confirming the current rising trend.
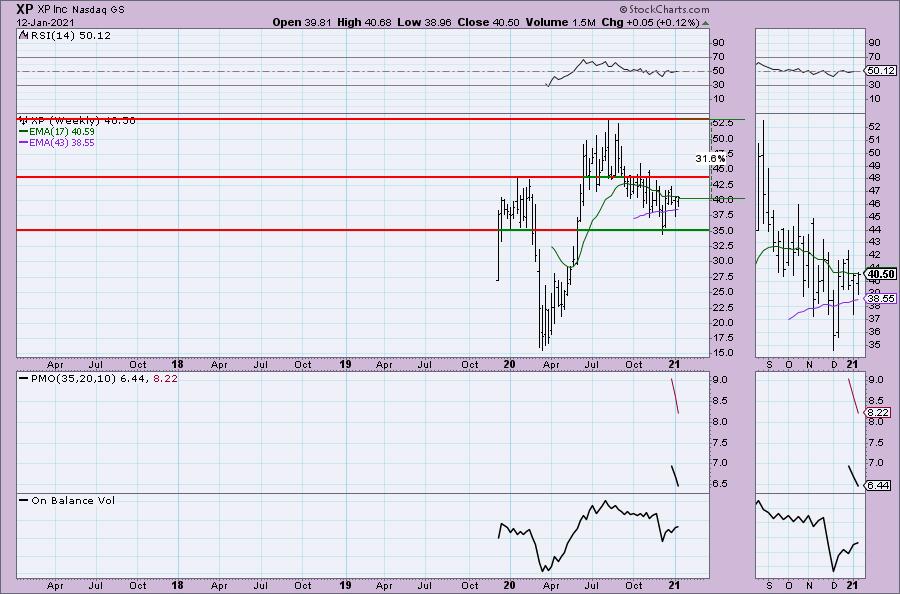
Not much to identify on the weekly chart except to note there is a positive RSI and plenty of upside potential.
Full Disclosure: I'm about 55% invested and 45% is in 'cash', meaning in money markets and readily available to trade with. I will likely add a few stocks to my portfolio soon. I'll be stalking UNG tomorrow.
Current Market Outlook:
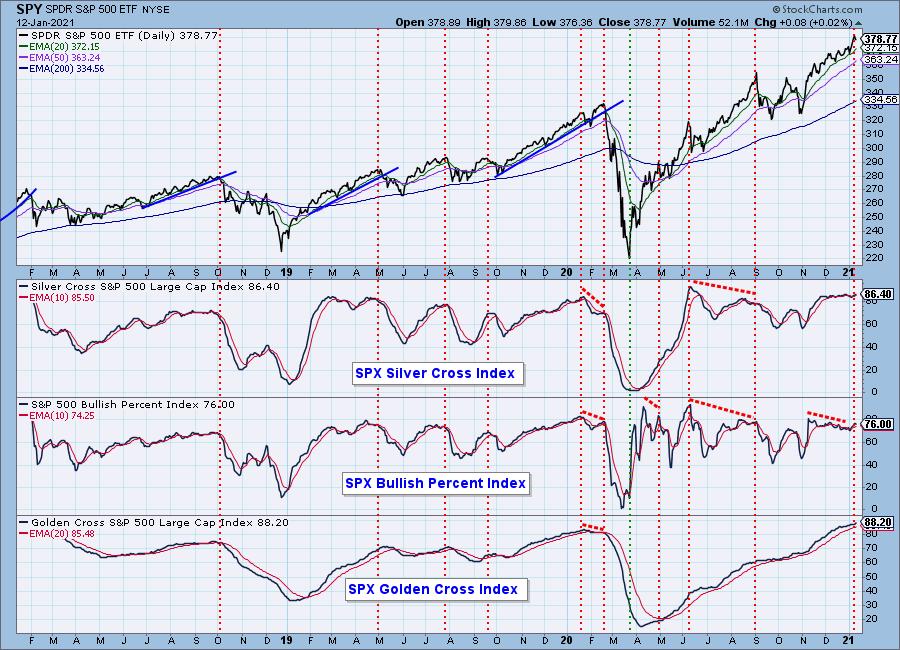
Market Environment: It is important to consider the odds for success by assessing the market tides. The following chart uses different methodologies for objectively showing the depth and trend of participation for intermediate- and long-term time frames.
- The Silver Cross Index (SCI) shows the percentage of SPX stocks on IT Trend Model BUY signals (20-EMA > 50-EMA)
- The Golden Cross Index (GCI) shows the percentage of SPX stocks on LT Trend Model BUY signals (50-EMA > 200-EMA)
- The Bullish Percent Index (BPI) shows the percentage of SPX stocks on Point & Figure BUY signals.
Don't forget that as a "Diamonds" member, you have access to our GCI/SCI curated ChartList on DecisionPoint.com. You'll find it under "Members Only" links on the left side on the Blogs and Links Page.
Here is the current chart:
Diamond Index:
- Diamond Scan Results: 31
- Diamond Dog Scan Results: 6
- Diamond Bull/Bear Ratio: 5.17
I'm in the process of trying to plot the Diamond Index, but with time at a premium, it is on the back burner.
Technical Analysis is a windsock, not a crystal ball.
Happy Charting!
- Erin
erin@decisionpoint.com
Watch the latest episode of DecisionPoint with Carl & Erin Swenlin on Mondays 7:00p EST or on the DecisionPoint playlist on the StockCharts TV YouTube channel here!
NOTE: The stocks reported herein are from mechanical trading model scans that are based upon moving average relationships, momentum and volume. DecisionPoint analysis is then applied to get five selections from the scans. The selections given should prompt readers to do a chart review using their own analysis process. This letter is not a call for a specific action to buy, sell or short any of the stocks provided. There are NO sure things or guaranteed returns on the daily selection of "diamonds in the rough."
Helpful DecisionPoint Links:
DecisionPoint Shared ChartList and DecisionPoint Chart Gallery
Price Momentum Oscillator (PMO)
Swenlin Trading Oscillators (STO-B and STO-V)
For more links, go to DecisionPoint.com!