
I have some pretty good "diamonds in the rough" today, but as the headline states, we need to tread carefully as the market has likely begun to pullback (finally). There are always areas of strength even in a declining market--they just get harder to find. I opted not to add to my portfolio and will likely take some profits on Harley-Davidson (HOG) and a few other Diamonds that have performed well. It's a good time to build up watch lists, unless you have a higher risk appetite and don't mind the exposure.
Today's "Diamonds in the Rough" are: CIBR, EMR, GDOT, SGMS and TROW.
 Diamond Mine Information:
Here is Friday's (12/4) recording link. Use Access Passcode: FrA8@Q9=
Register in advance for the next "DecisionPoint Diamond Mine" trading room on Friday (12/11/2020) 12:00p ET:
Here is the registration link for Friday, 12/11/2020. Password: holiday
Please do not share these links! They are for Diamonds subscribers ONLY!

It's Free!
***Click here to register for this recurring free DecisionPoint Trading Room on Mondays at Noon ET!***
Did you miss the 12/7 free trading room? Here is a link to the recording. Access Code: fNN=Q8h9
For best results, copy and paste the access code to avoid typos.
Welcome to DecisionPoint Daily Diamonds, wherein I highlight five "diamonds in the rough." These are selected from the results of my DecisionPoint scans, which search for stocks that could benefit from the trend and condition of the market. Remember, these are not recommendations to buy or sell, but are the most interesting of the stocks that surfaced in my scans. My objective is to save you the work of the initial, tedious culling process, but you need to apply your own analysis to see if these stocks pique your interest as well. There are no guaranteed winners here!
First Trust NASDAQ Cybersecurity ETF (CIBR)
EARNINGS: N/A
CIBR tracks a liquidity-weighted index that targets companies engaged in the cybersecurity industry.
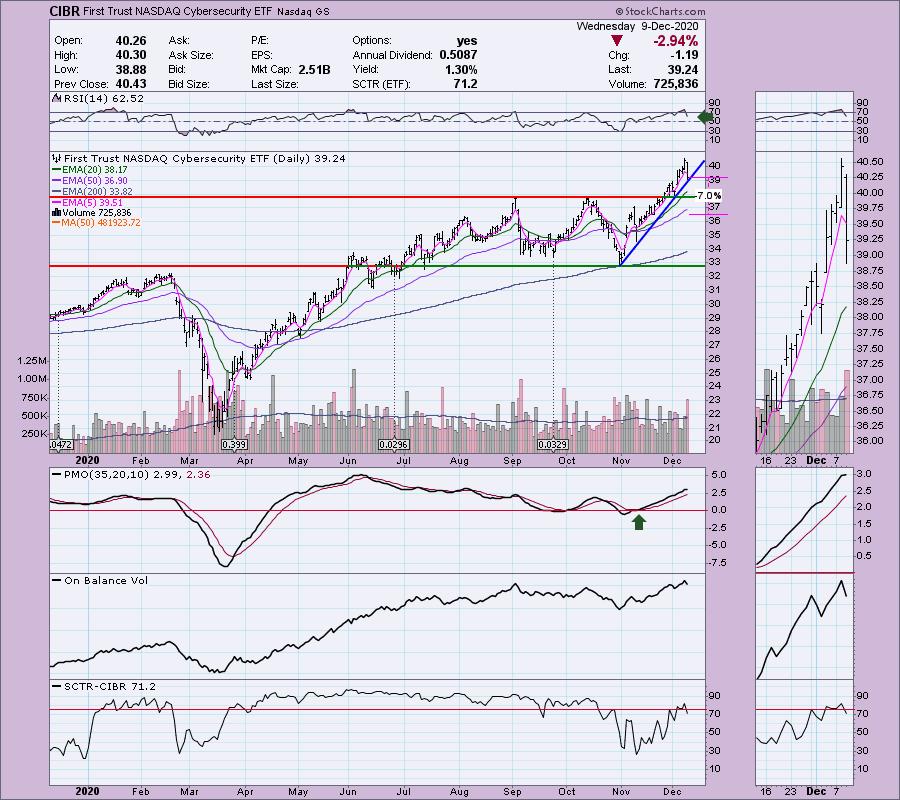
I have covered CIBR twice this year. Once on July 6th (up 15.9% since) and on September 1st (up 5.1% since). I picked this one again because I liked the pullback that brought price to the rising bottoms trendline. This also took the RSI out of overbought territory. The PMO has flattened, but is still rising and not at overbought extremes. The OBV is rising and although the SCTR dropped from today's decline, it is still above 70. My concern is this decline could be the beginning of a breakdown given the weakness that arrived in the market today.
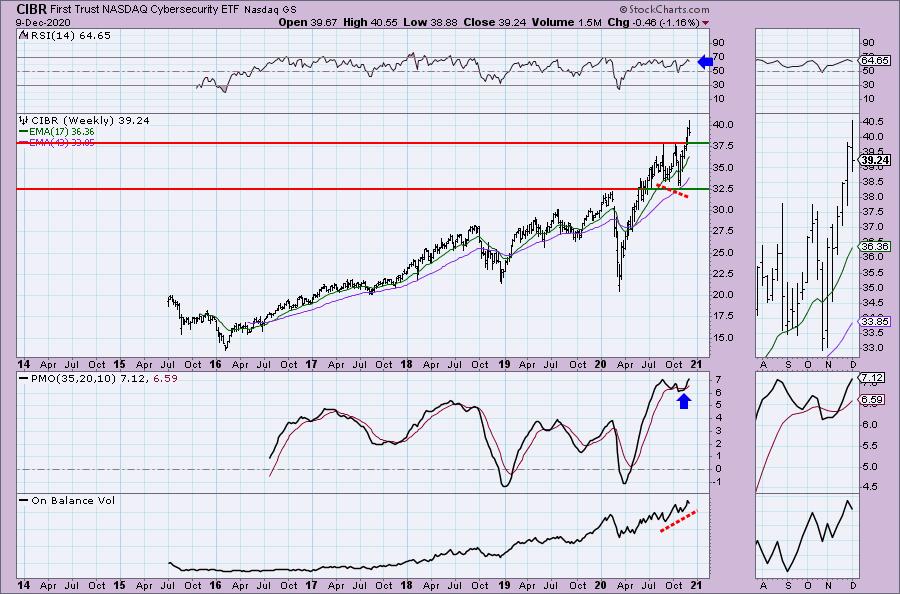
The weekly chart looks very positive except that the PMO is very overbought. However, I can't really hold that against it since we don't have enough data to see if this truly is overbought or not. It hasn't been able to establish a solid range. I really like the positive divergence with the OBV that began this rally and the RSI is positive and not overbought.
Emerson Electric Co. (EMR)
EARNINGS: 2/2/2021 (BMO)
Emerson Electric Co. is a global technology and engineering company, which provides innovative solutions for customers in industrial, commercial and residential markets. It operates through the following business segments: Automation Solutions; Climate Technologies; and Tools and Home Products. The Automation Solutions segment offers products, integrated solutions, software and services which enable process, hybrid and discrete manufacturers to maximize production, protect personnel and the environment, reduce project costs, and optimize their energy efficiency and operating costs. The Climate Technologies segment provides products and services for many areas of the climate control industry, including residential heating and cooling, commercial air conditioning, and commercial and industrial refrigeration. The Tools and Home Products segment provides tools for professionals and homeowners and appliance solutions. The company was founded by Charles Meston and Alexander Meston on September 24, 1890 and is headquartered in St. Louis, MO.
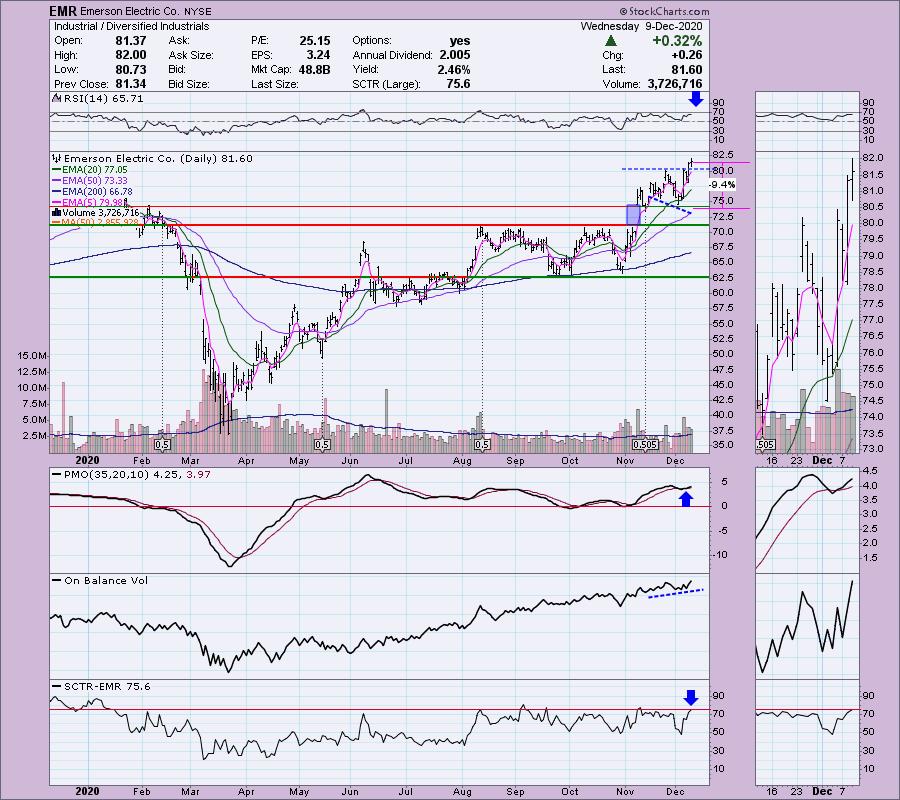
This one broke out yesterday and today maintained the breakout above new support at the November top. The OBV has a positive divergence that may not have completely played out. Support is very strong at the top of gap resistance. The RSI is positive and the PMO has turned around and given us a crossover BUY signal. The SCTR just entered the "hot zone" above 75. The stop is set just below gap support.
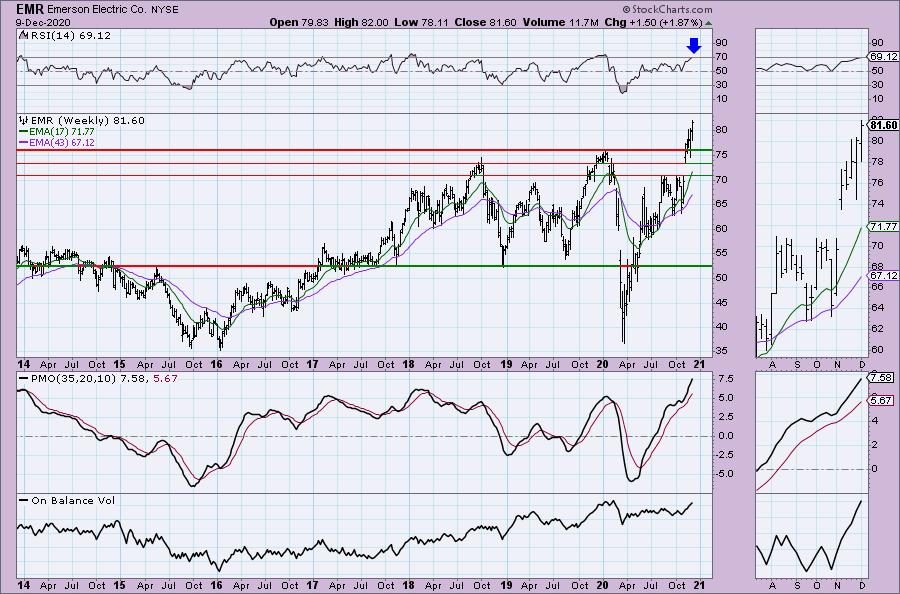
The weekly chart is positive, but the RSI and PMO are overbought. I'm noticing there is support before price hits gap support at the 2020 top, so you could probably tighten up that stop somewhat.
Don't forget, on Thursdays I look at reader-requested symbols, so shoot me an email at erin@decisionpoint.com. I read every email I receive and try to answer them all!
Green Dot Corp. (GDOT)
EARNINGS: 2/17/2021 (AMC)
Green Dot Corp. operates as a financial technology leader and bank holding company, which engages in the provision of prepaid cards, debit cards, checking accounts, secured credit cards, payroll debit cards, consumer cash processing services, wage disbursements, and tax refund processing services. It operates through the following segments: Account Services; and Processing and Settlement Services. The Account Services segment consists of revenues and expenses derived from deposit account programs, such as prepaid cards, debit cards, consumer and small business checking accounts, secured credit cards, payroll debit cards and gift cards. The Processing and Settlement Services segment comprises of products and services that specialize in facilitating the movement of funds on behalf of consumers and businesses. The company was founded by Steven W. Streit in October 1, 1999 and is headquartered in Pasadena, CA.
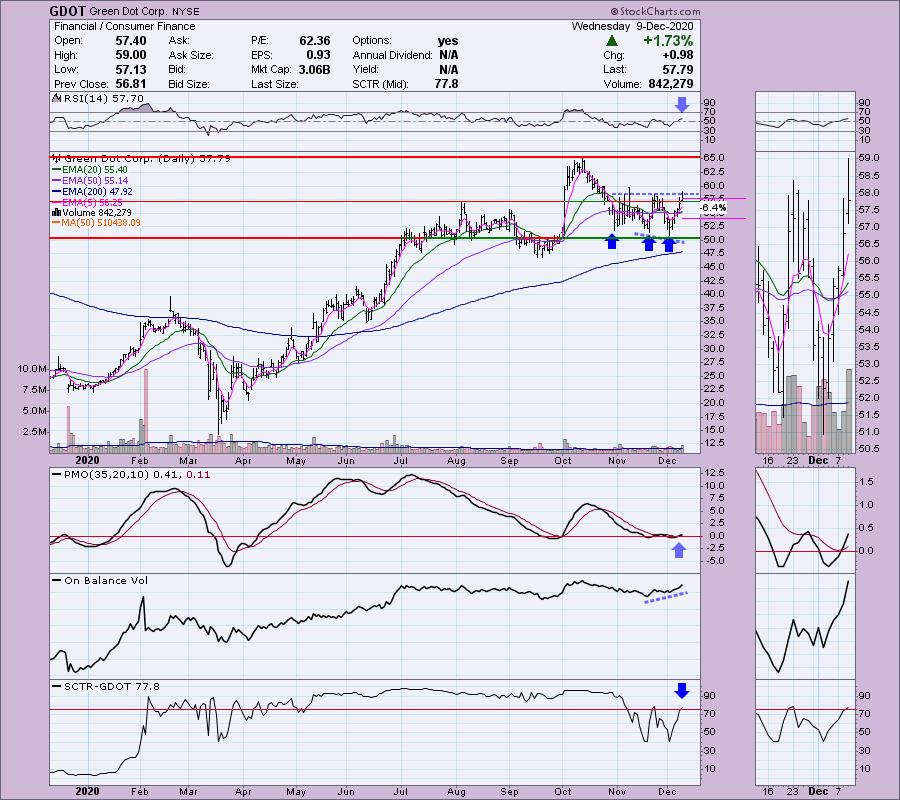
This one was very interesting. We have a double-bottom (or even a triple bottom if you wish). Price hasn't quite broken out yet, but seeing the now positive RSI and PMO crossover BUY signal just above the zero line, I believe it will. We even have an OBV positive divergence. I would go with a tight stop. If it can't hold above those EMAs, it likely isn't done consolidating.
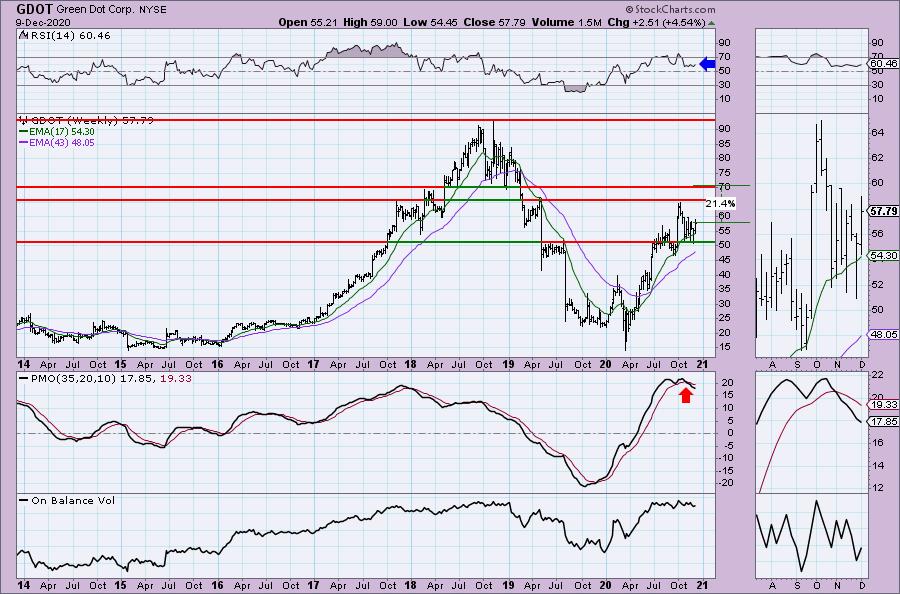
The weekly chart's PMO isn't nearly as positive. I would just point you toward the first quarter of 2018 where we had a similar PMO SELL signal. Ultimately the rising trend remained intact until the 2018 top. The RSI is still positive, just like it was up until the 2018 top. I just want to point out that sometimes you can eke out more upside despite a negative PMO.
Scientific Games Corp. (SGMS)
EARNINGS: 2/16/2021 (AMC)
Scientific Games Corp. engages in the development of technology-based products and services and associated content. It operates through the following business segments: Gaming, Lottery, and SciPlay and Digital. The Gaming segment designs, develops, manufactures, markets, and distributes a comprehensive portfolio of gaming products and services. The Lottery segment comprises of system-based services and product sales business, and instant games business. The SciPlay segment developes and publishes digital games on mobile and web platforms. The Digital Segment provides a comprehensive suite of digital gaming and sports wagering solutions and services, including digital RMG and sports wagering solutions, distribution platforms, content, products and services. The company was founded on July 2, 1984 and is headquartered in Las Vegas, NV.
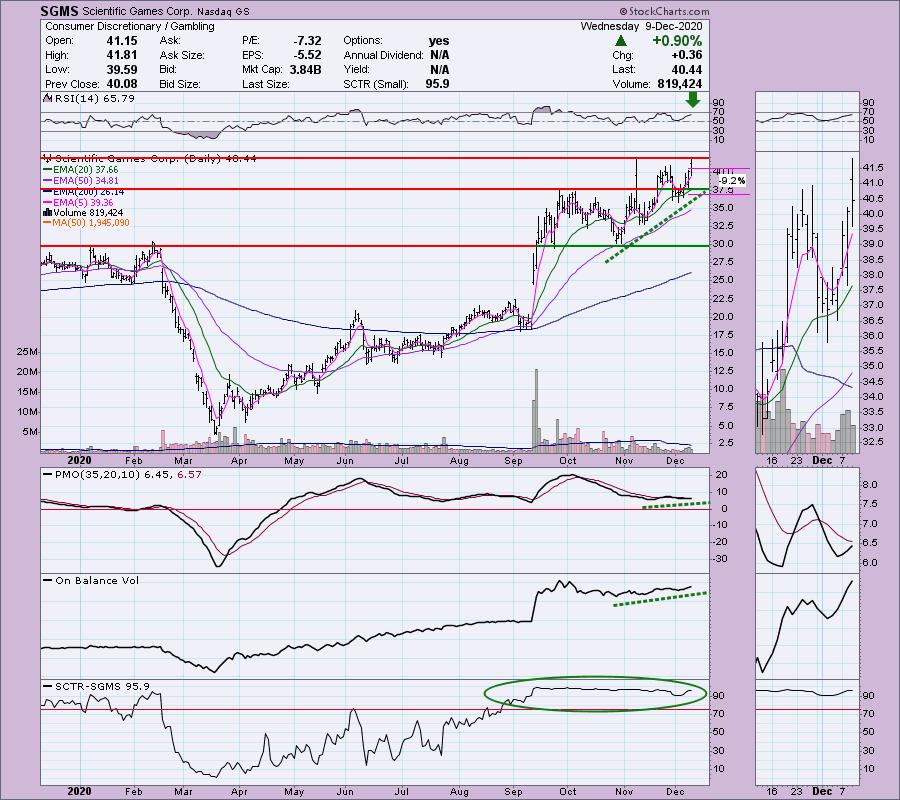
Currently SGMS is up +0.27% in after hours trading. It's not enough to move price to a breakout just yet. However, the very positive PMO, turning up above the zero line in oversold territory as well as a positive RSI suggest we will see it. All of the indicators are confirming this rally. I set the stop just below support at the September top.
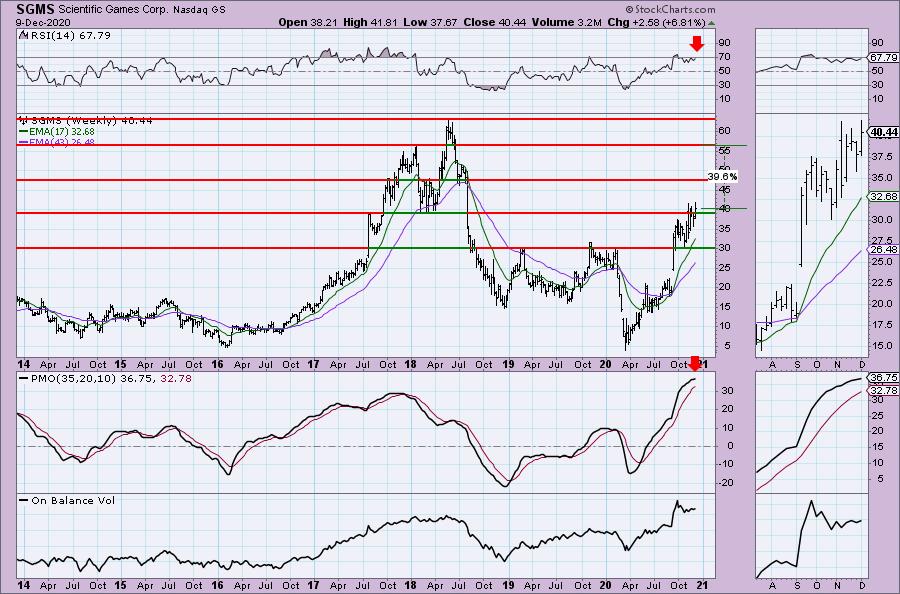
The PMO is still rising and the RSI is positive. Both are overbought, but we can see that price broke above the early 2018 low. It's been struggling to maintain the breakout, but I believe it will hold.
T. Rowe Price Associates, Inc. (TROW)
EARNINGS: 1/28/2021 (BMO)
T. Rowe Price Group, Inc. is a financial services holding company, which engages in the provision of investment management services through its subsidiaries. It provides an array of company sponsored U.S. mutual funds, other sponsored pooled investment vehicles, sub advisory services, separate account management, recordkeeping, and related services to individuals, advisors, institutions, financial intermediaries, and retirement plan sponsors. The company was founded by Thomas Rowe Price Jr. in 1937 and is headquartered in Baltimore, MD.
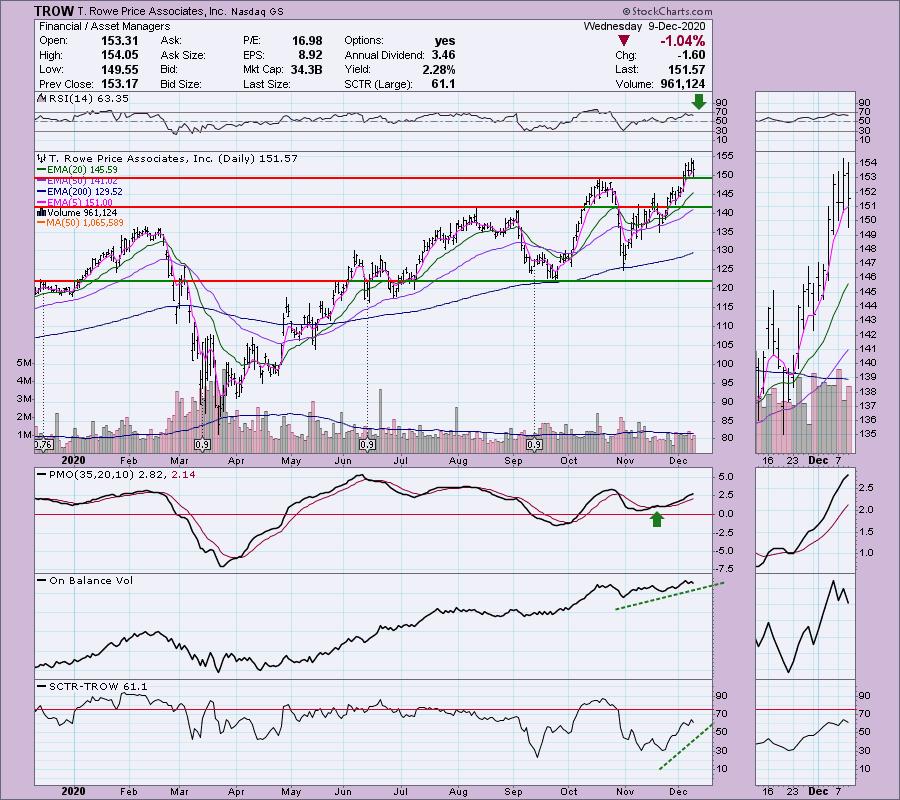
I covered TROW back on July 14th (up 16.0% since). I like it on today's pullback which took price back down to the original breakout point. The PMO is still rising and isn't overbought. The RSI is positive and not overbought. The OBV is confirming the rising trend and the SCTR is rising toward the "hot zone" above 75.
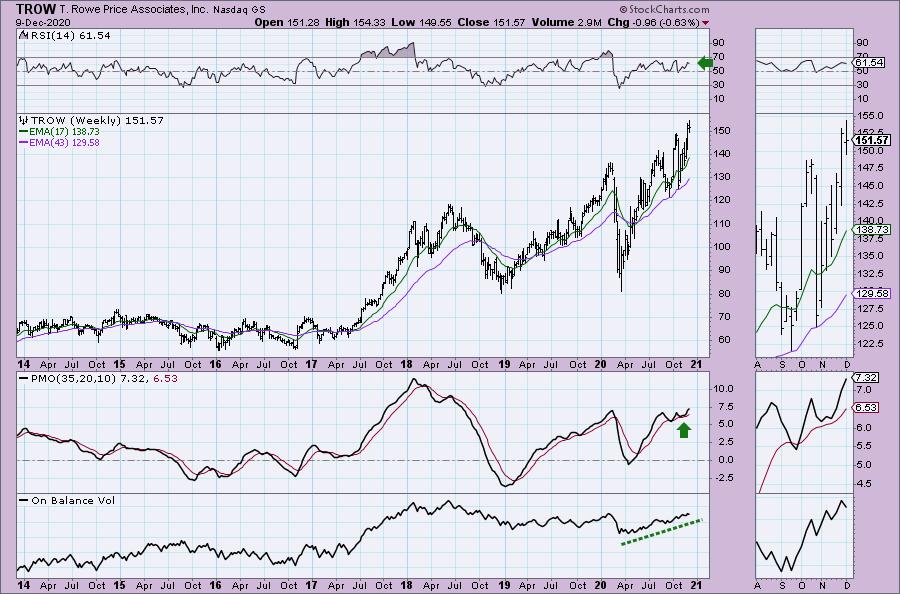
The weekly chart is very positive. The RSI has been in positive territory for some time and the PMO just bottomed above the signal line which I always find especially bullish.
Reader Request day tomorrow! They're already coming in! Get yours in the queue at erin@decisionpoint.com.
Full Disclosure: I'm about 70% invested and 30% is in 'cash', meaning in money markets and readily available to trade with. I'm likely going to sell a few positions to lock in some profit this week.
Current Market Outlook:
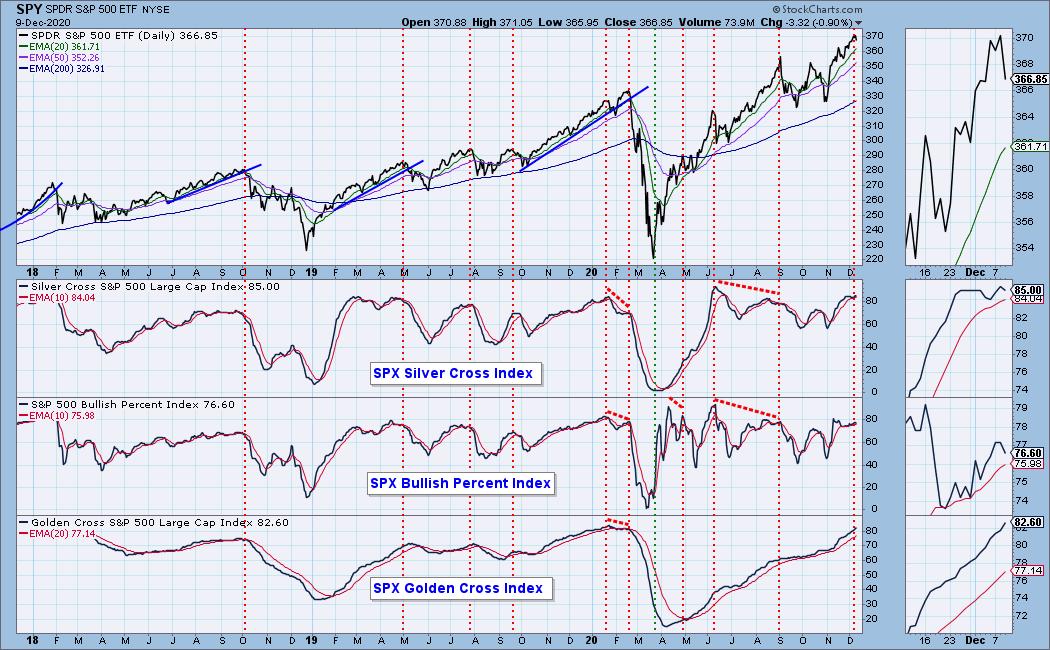
Market Environment: It is important to consider the odds for success by assessing the market tides. The following chart uses different methodologies for objectively showing the depth and trend of participation for intermediate- and long-term time frames.
- The Silver Cross Index (SCI) shows the percentage of SPX stocks on IT Trend Model BUY signals (20-EMA > 50-EMA)
- The Golden Cross Index (GCI) shows the percentage of SPX stocks on LT Trend Model BUY signals (50-EMA > 200-EMA)
- The Bullish Percent Index (BPI) shows the percentage of SPX stocks on Point & Figure BUY signals.
Don't forget that as a "Diamonds" member, you have access to our GCI/SCI curated ChartList on DecisionPoint.com. You'll find it under "Members Only" links on the left side on the Blogs and Links Page.
Here is the current chart:
Diamond Index:
- Diamond Scan Results: 2
- Diamond Dog Scan Results: 5
- Diamond Bull/Bear Ratio: 0.40
I'm in the process of trying to plot the Diamond Index, but with time at a premium, it is on the back burner.
Technical Analysis is a windsock, not a crystal ball.
Happy Charting!
- Erin
erin@decisionpoint.com
Watch the latest episode of DecisionPoint with Carl & Erin Swenlin on Mondays 7:00p EST or on the DecisionPoint playlist on the StockCharts TV YouTube channel here!
NOTE: The stocks reported herein are from mechanical trading model scans that are based upon moving average relationships, momentum and volume. DecisionPoint analysis is then applied to get five selections from the scans. The selections given should prompt readers to do a chart review using their own analysis process. This letter is not a call for a specific action to buy, sell or short any of the stocks provided. There are NO sure things or guaranteed returns on the daily selection of "diamonds in the rough."
Helpful DecisionPoint Links:
DecisionPoint Shared ChartList and DecisionPoint Chart Gallery
Price Momentum Oscillator (PMO)
Swenlin Trading Oscillators (STO-B and STO-V)
For more links, go to DecisionPoint.com!d