
I'm asked many times about the investing timeframe for "Diamonds in the Rough". My scans search for short-term investments. I include the weekly charts for context and it is often clear that it is positive in the short term but not in the intermediate term.
I found an excellent graphical way to show you how Relative Rotation Graphs (RRGs) display this. The RRG below shows the short-term (daily) version of the RRG. Notice how all of the stocks, but one are traveling north to northwest in "improving" toward "leading". This is exactly what I'm looking for in potential Diamonds. TPIC isn't traveling in the best direction for a short-term trade.
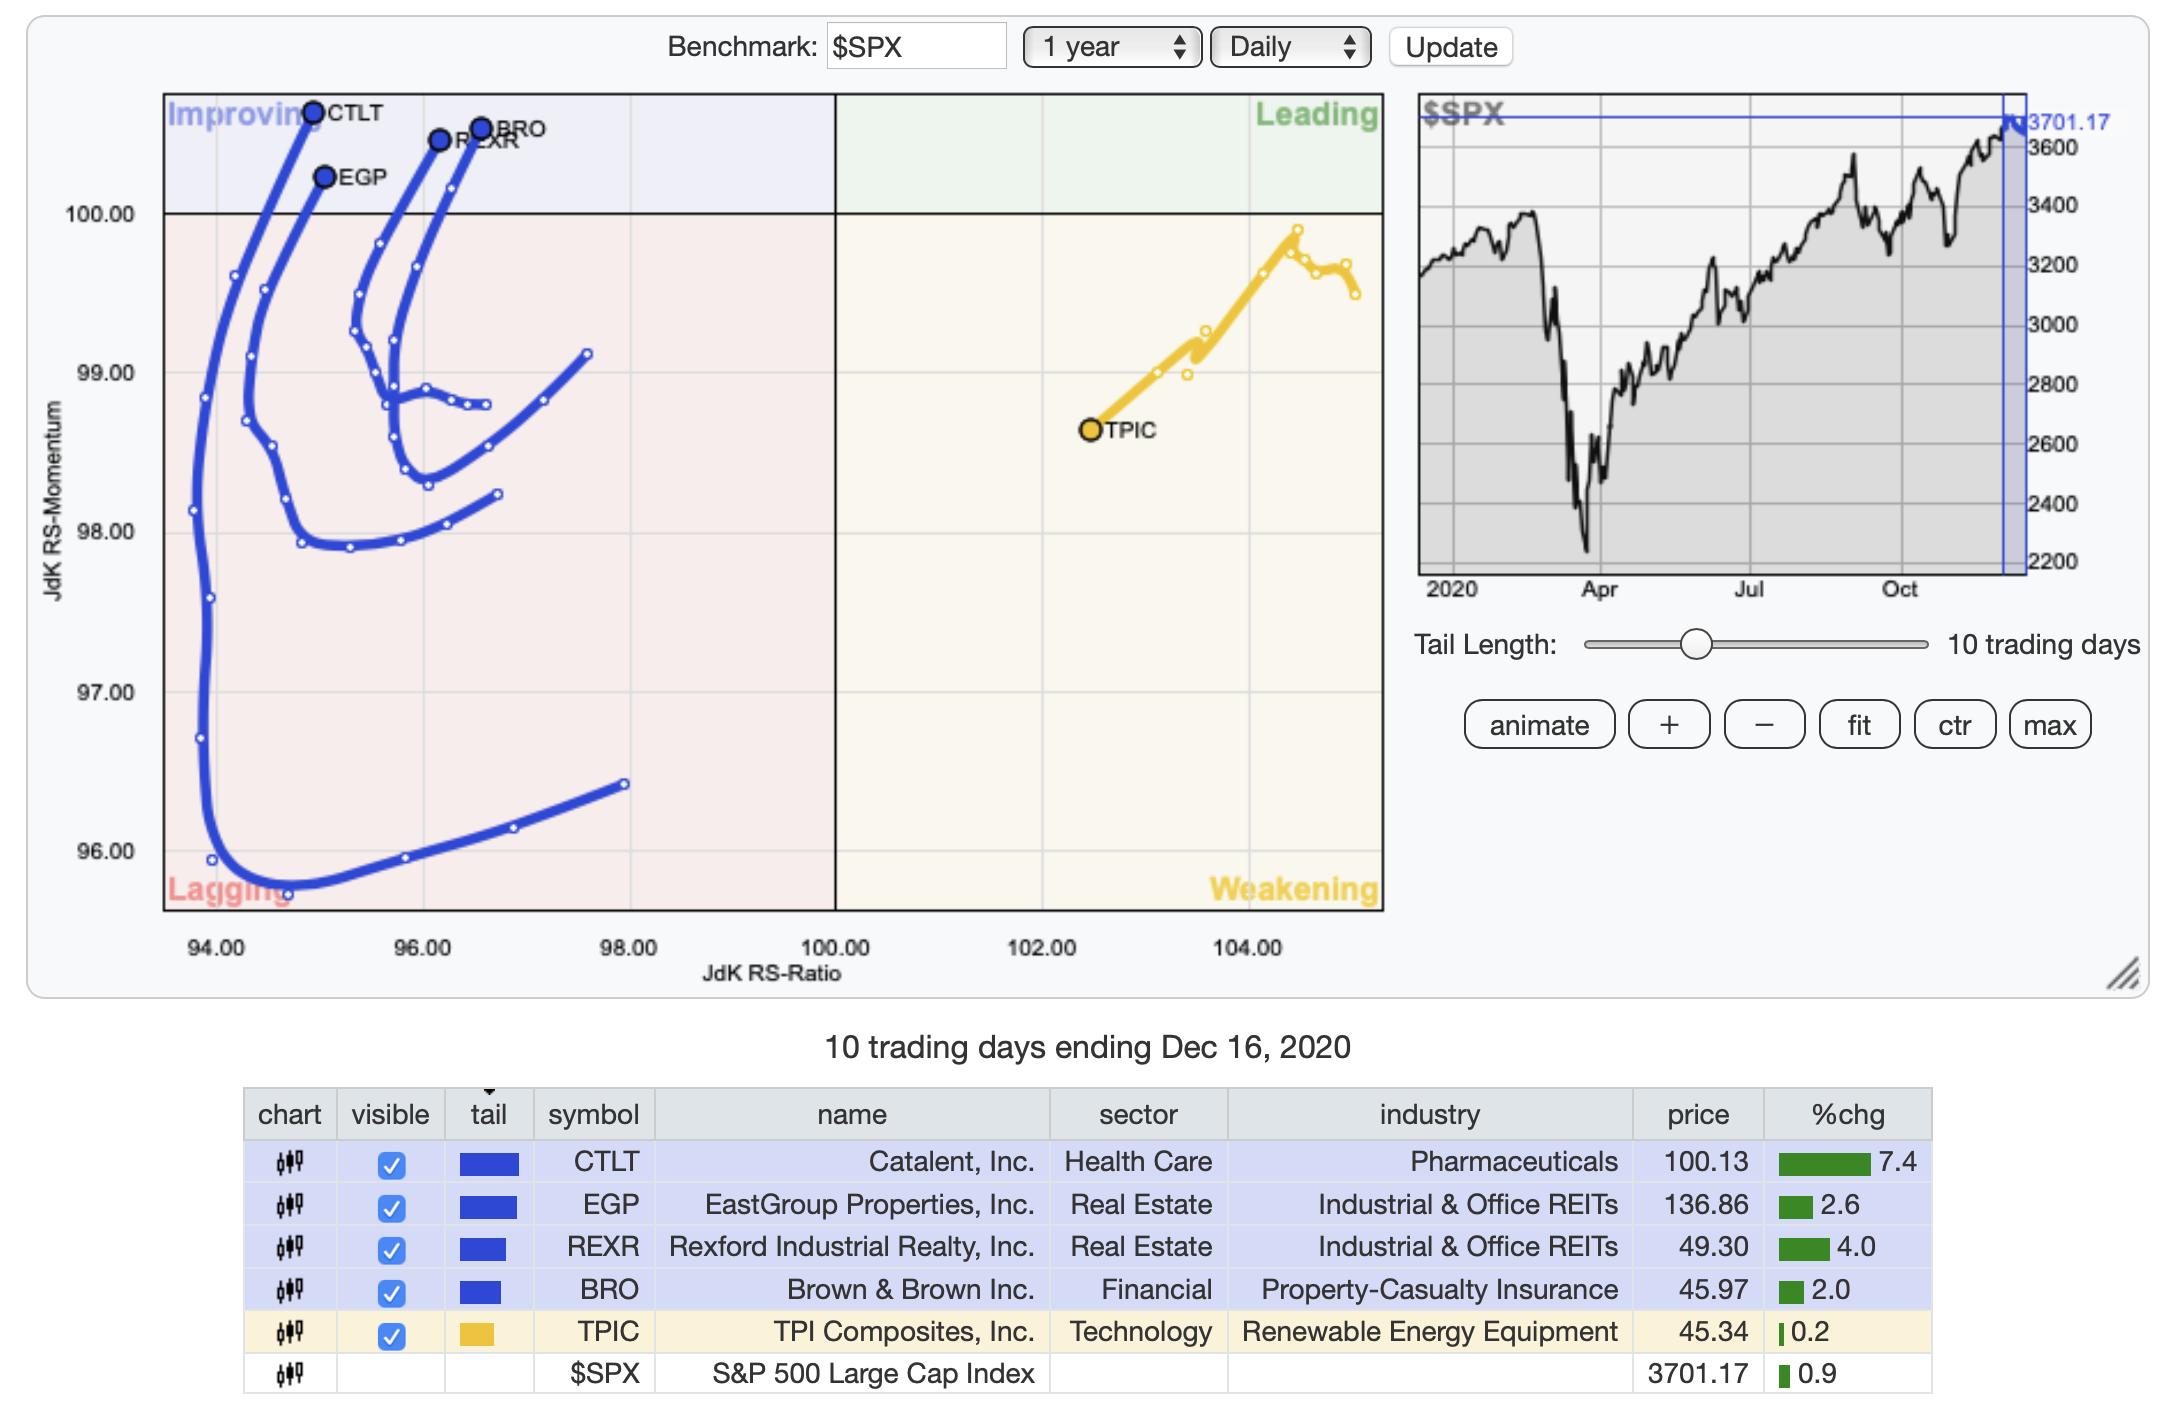
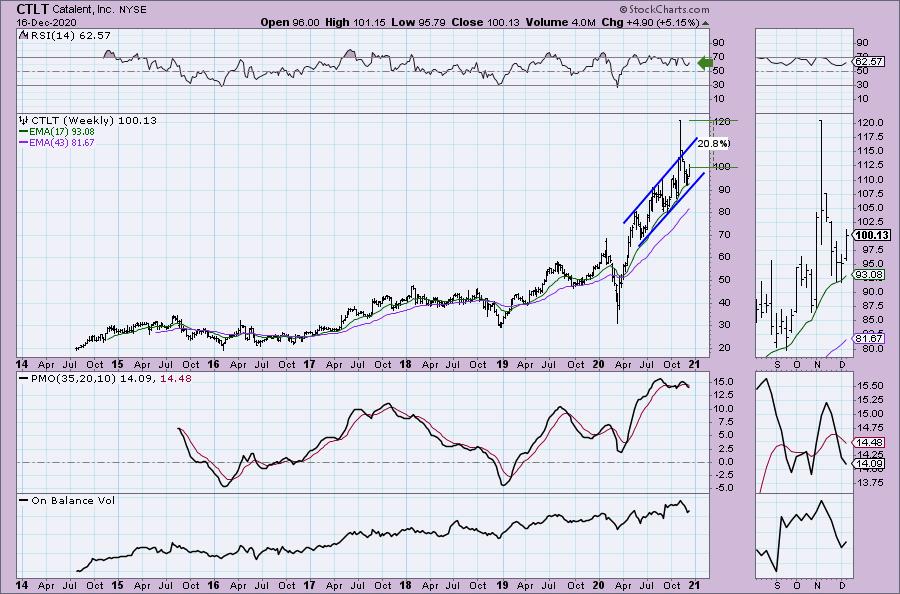
However, on the "weekly" version of the RRG, you can see that TPIC is actually the most promising so that investment could be considered more of an intermediate-term investment rather than short-term trade. Additionally, CTLT looks pretty good on the weekly RRG and therefore fits in the short or intermediate term.
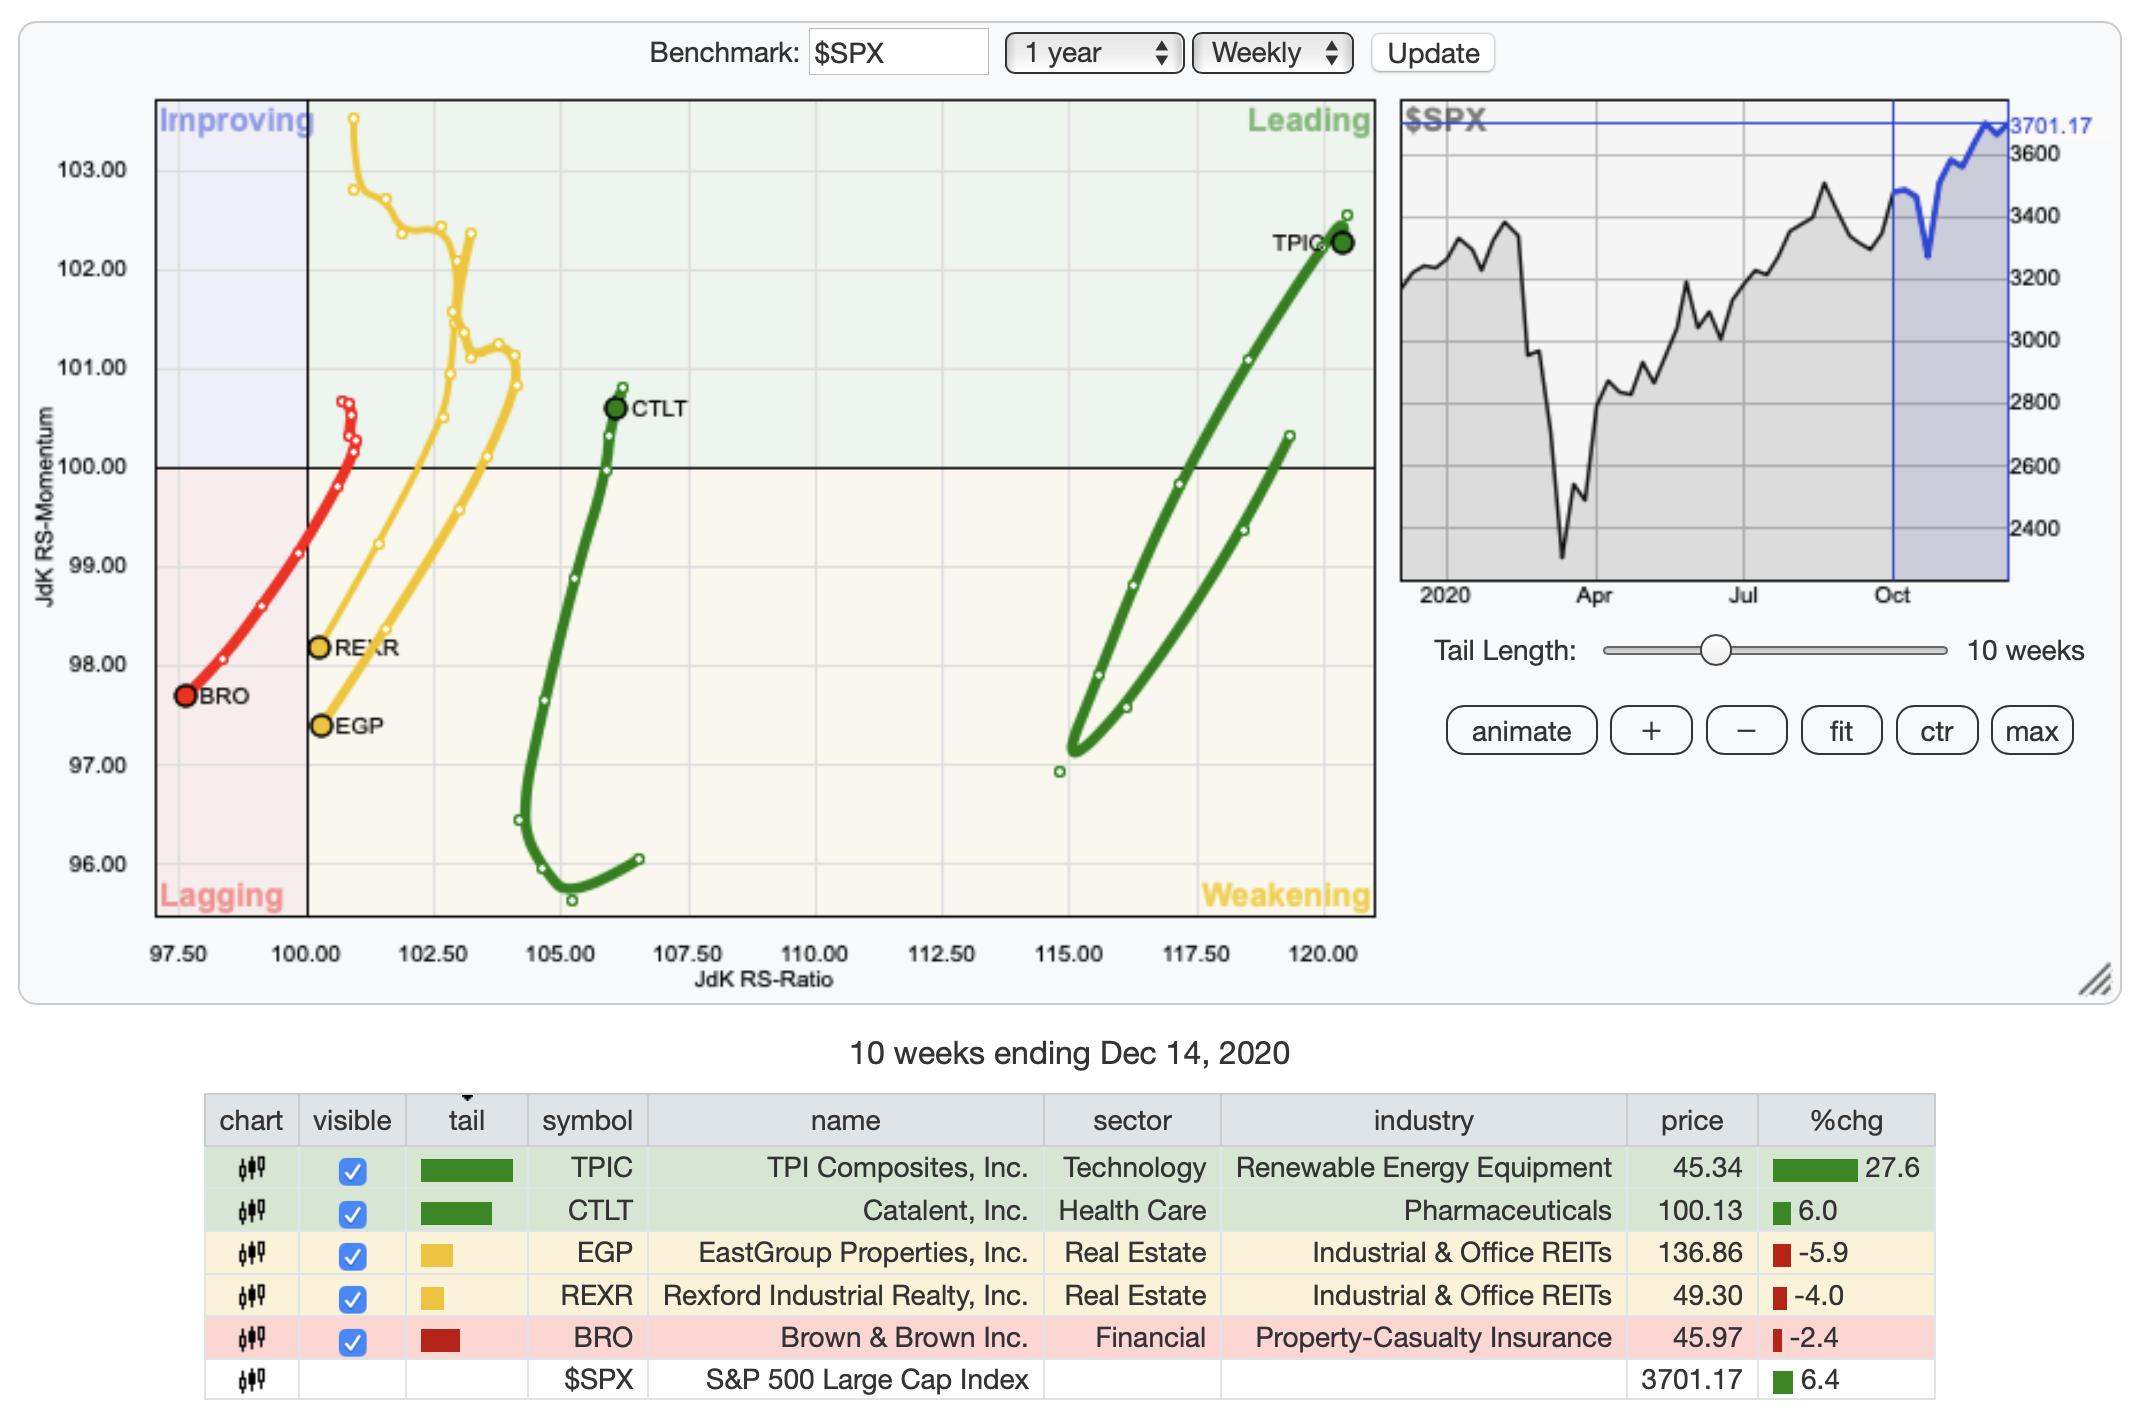
I will usually mention whether an investment is more short-term v. intermediate-term, but I think you probably can tell this simply by a quick look at the weekly chart.
Quick note regarding IQ stock. I'm glad that I warned everyone that it was down in after hours trading, it absolutely tanked today, down over 18%. Definitely THE worst Diamond ever and of course I presented it to the non-paying public. If any of you got hit on this one, prepare to sell into ANY strength. It is currently up 1.5% in after hours trading. It is also extremely oversold now and it has a tendency to gap up and down. I wouldn't fault you for sticking it out.
Today's "Diamonds in the Rough" are: BRO, CTLT, EGP, REXR and TPIC.
** HOLIDAY SCHEDULE 12/21/2020 - 1/4/2021 **
Diamonds:
Monday & Tuesday --Eleven Diamonds in the Rough (no reader requests).
Wednesday: Diamonds Recap & LIVE Diamond Mine Trading Room at 9:00a PT
DecisionPoint Alert:
Publishing Monday - Wednesday
** There will be no reports sent on 12/24 and 12/25. Additionally no reports will be sent 12/31 and 1/1 **
 Diamond Mine Information:
Here is Friday's (12/11) recording link. Use Access Passcode: ?3mEYKLj
Register in advance for the next "DecisionPoint Diamond Mine" trading room on Friday (12/18/2020) 12:00p ET:
Here is the registration link for Friday, 12/18/2020. Password: evergreen
Please do not share these links! They are for Diamonds subscribers ONLY!

It's Free!
***Click here to register for this recurring free DecisionPoint Trading Room on Mondays at Noon ET!***
Did you miss the 12/7 free trading room? Here is a link to the recording. Access Code: fNN=Q8h9
For best results, copy and paste the access code to avoid typos.
Welcome to DecisionPoint Daily Diamonds, wherein I highlight five "diamonds in the rough." These are selected from the results of my DecisionPoint scans, which search for stocks that could benefit from the trend and condition of the market. Remember, these are not recommendations to buy or sell, but are the most interesting of the stocks that surfaced in my scans. My objective is to save you the work of the initial, tedious culling process, but you need to apply your own analysis to see if these stocks pique your interest as well. There are no guaranteed winners here!
Brown & Brown Inc. (BRO)
EARNINGS: 1/25/2021 (AMC)
Brown & Brown, Inc. is an insurance agency, wholesale brokerage, insurance programs and service organization. It engages in the provision of insurance brokerage services and casualty insurance underwriting services. It operates through the following segments: Retail; National Programs; Wholesale Brokerage; and Services. The Retail Segment receives fees in lieu of commissions. The National Programs segment acts as a managing general agent and provides professional liability and related package products for certain professionals, a range of insurance products for individuals, flood coverage, and targeted products and services designated for specific industries, trade groups, governmental entities and market niches. The Wholesale Brokerage segment markets and sells excess and surplus commercial and personal lines insurance, primarily through independent agents and brokers, as well as company's retail agents. The Services segment provides insurance-related services, including third-party claims administration and comprehensive medical utilization management services in both the workers' compensation and all-lines liability arenas, as well as medicare Set-aside services, social security disability and medicare benefits advocacy services and claims adjusting services. The company was founded by J. Adrian Brown and Charles Covington Owen in 1939 and is headquartered in Daytona Beach, FL.
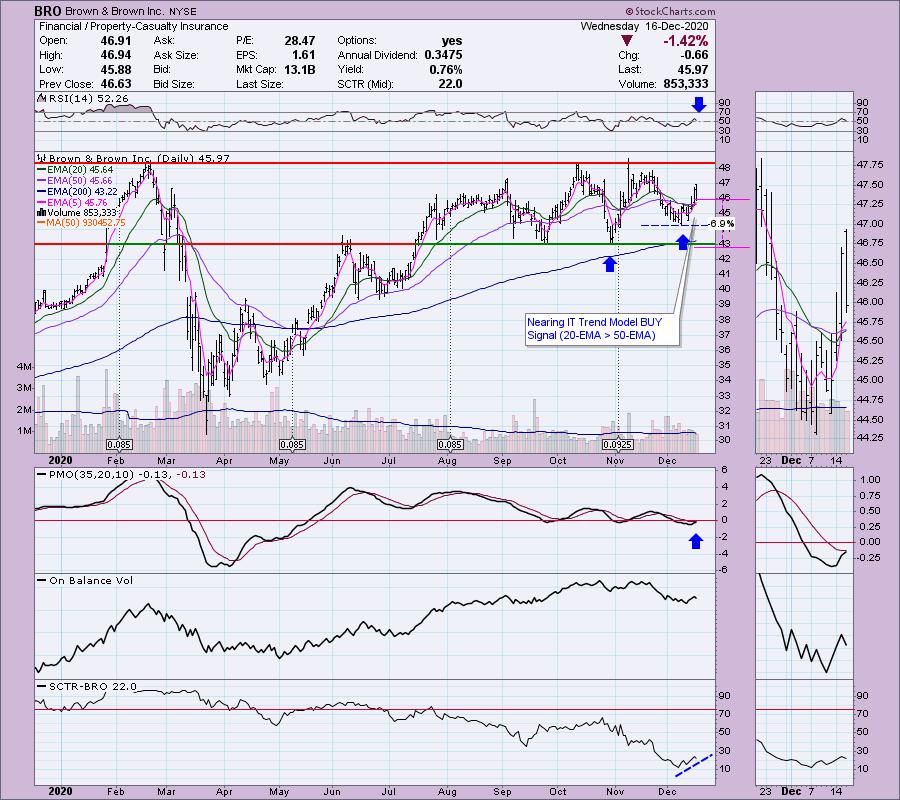
BRO pulled back today after breaking out above the 20/50-EMAs. Pullbacks after breakouts are typical after a strong upside move. These are great when you are ready to trade a particular stock and that's what we have here. We nearly have a positive 20/50-EMA crossover which would trigger an IT Trend Model BUY signal. The RSI is positive and the PMO is nearing an oversold BUY signal.
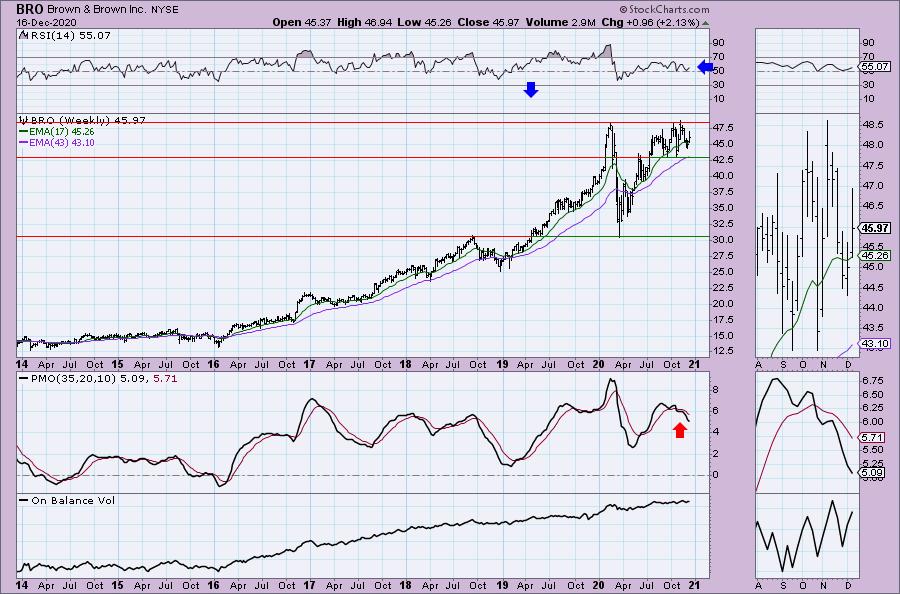
Clearly this is a short-term horizon investment unless we see momentum begin swinging back up on the weekly chart. We do have some strength given the positive RSI and rising bottoms on the OBV.
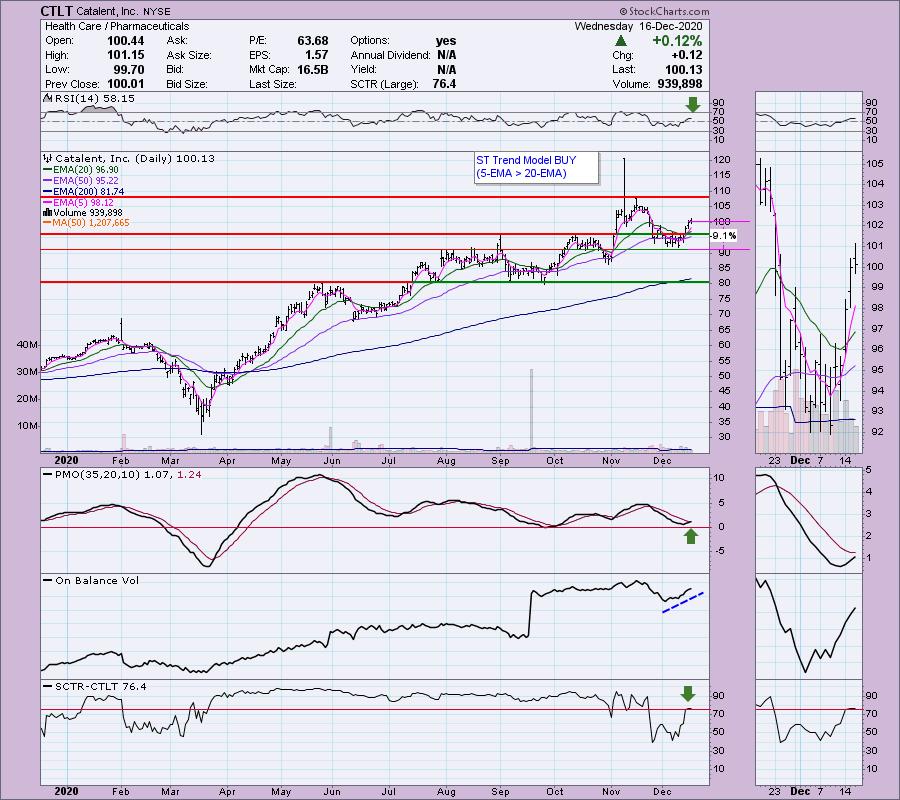
Catalent, Inc. (CTLT)
EARNINGS: 2/2/2021 (BMO)
Catalent, Inc. operates as a holding company, which engages in the provision of delivery technologies, development, and manufacturing solutions for drugs, biologics, cell and gene therapies, and consumer health products. It operates through the following segments: Softgel and Oral Technologies, Biologics, Oral and Specialty Delivery, and Clinical Supply Services. The Softgel and Oral Technologies segment provides formulation, development, and manufacturing services for soft capsules or softgels, as well as large-scale manufacturing of oral solid dose forms for pharmaceutical and consumer health markets, and supporting ancillary services. The Biologics segment provides biologic cell-line, cell therapy and viral vector gene therapy development and manufacturing; formulation, development, and manufacturing for parenteral dose forms, which include prefilled syringes, vials, and cartridges; and analytical development and testing services for large molecules. The Oral and Speciality Delivery segment provides advanced formulation, development, and manufacturing across a range of technologies along with integrated downstream clinical development and commercial supply solutions. The Clinical Supply Services segment provides manufacturing, packaging, storage, distribution, and inventory management for drugs and biologics in clinical trials. The company was founded in 1933 and is headquartered in Somerset, NJ.
Pharmaceuticals was my industry group to watch last Friday. This one has a cup shaped bottom. We just got a ST Trend Model BUY signal with the 5/20-EMA positive crossover. The RSI has just hit positive territory and the PMO is headed for a crossover BUY signal. Rising bottoms on the OBV look like a positive divergence in the thumbnail. The SCTR has just reached the "hot zone" above 75.
CTLT is in a nice rising trend channel right now. The PMO is overbought and falling, but it is also decelerating. The 17-week EMA has been perfect support.
Don't forget, on Thursdays I look at reader-requested symbols, so shoot me an email at erin@decisionpoint.com. I read every email I receive and try to answer them all!
EastGroup Properties, Inc. (EGP)
EARNINGS: 2/9/2021 (AMC)
EastGroup Properties, Inc. is an equity real estate investment trust, which engages in the development, acquisition and operation of industrial properties in the United States. It operates through Industrial Properties segment. Its portfolio consists of distribution facilities in Florida, California, Texas, Arizona, and North Carolina. The company was founded in 1969 and is headquartered in Ridgeland, MS.
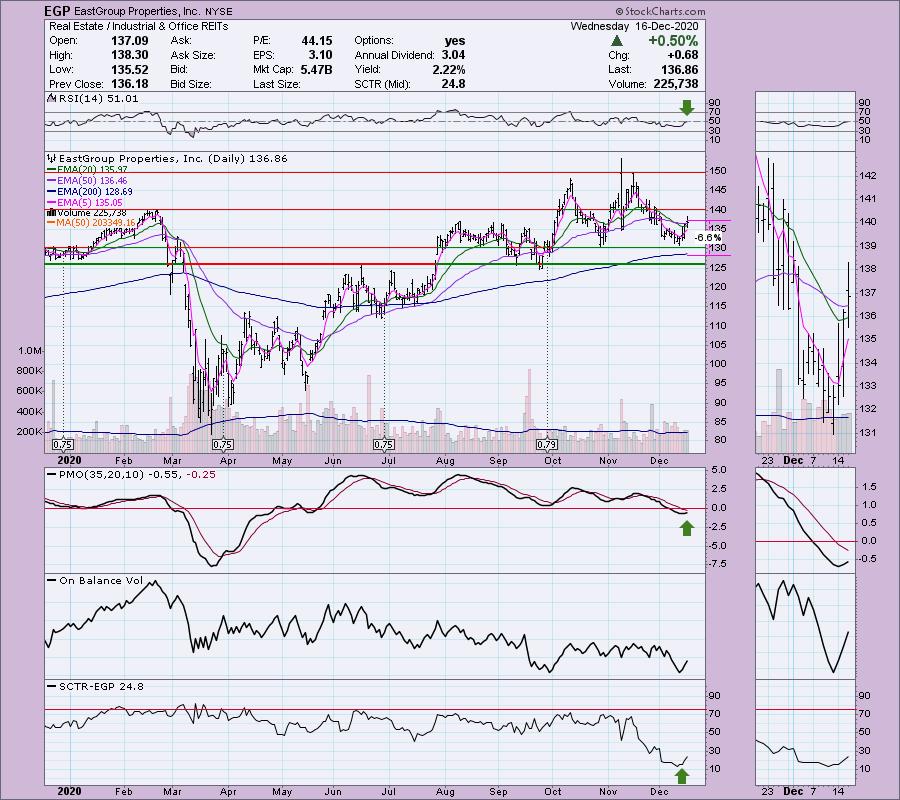
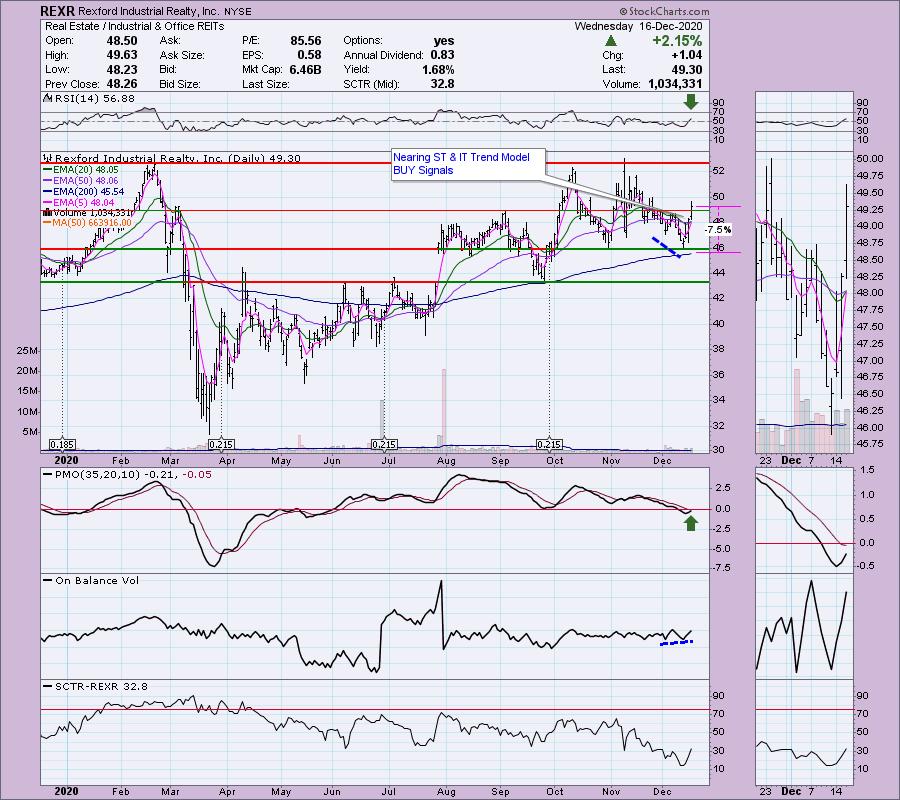
I've noticed that REITs are beginning to make a stir. This one is set up very nicely with price vaulting the 20/50-EMAs. The PMO is just turning up in oversold territory and the RSI has just reached positive territory. No need to set a deep stop on this one. I've lined it up with the 200-EMA.
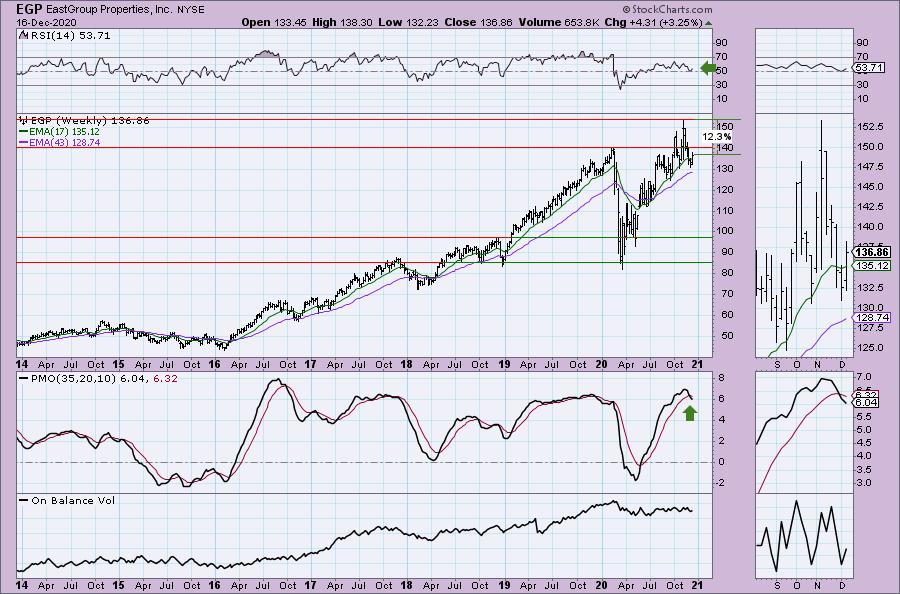
The weekly PMO doesn't look great, although it is trying to decelerate. OBV is flat, so you could make a case for a negative divergence in the intermediate term. The RSI is positive.
Rexford Industrial Realty, Inc.
EARNINGS: 2/2/2021 (AMC)
Rexford Industrial Realty, Inc. is a self-administered and self-managed real estate investment trust, which engages in owning, operating, and acquiring industrial properties. The company was founded on January 18, 2013 and is headquartered in Los Angeles, CA.
We have all three EMAs lining up for positive crossovers tomorrow that would trigger both an IT and ST Trend Model BUY signal. The PMO has turned up and we have a positive divergence on the OBV. The RSI just entered positive territory and is not overbought.
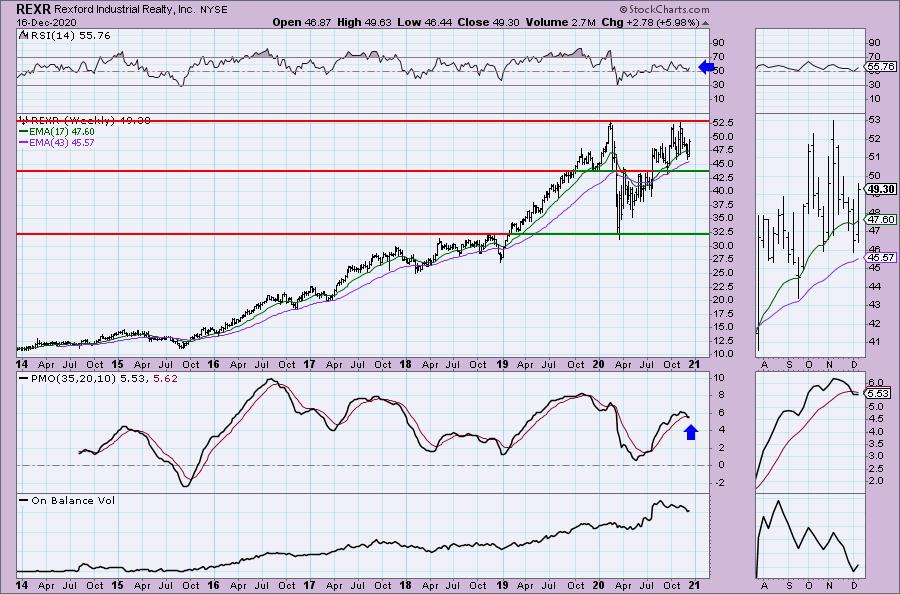
The weekly PMO has flattened out even though it triggered a SELL signal. The RSI remains positive. The OBV isn't much to look at, but this seems a solid rising trend with price staying above the 43-week EMA quite easily.
TPI Composites, Inc. (TPIC)
EARNINGS: 2/25/2021 (AMC)
TPI Composites, Inc. is a holding company, which engages in the manufacture of composite wind blades for the wind energy market. It operates through the following segments: United States (US); Asia; Mexico; and Europe, the Middle East, and Africa (EMEA). The US segment includes the production of wind blades in Newton, Iowa plant; and manufacturing of precision molding and assembly systems used for the manufacture of wind blades in Warren, Rhode Island facility, and composite solutions for the transportation industry. The Asia segment produces wind blades in Taicang Port, Dafeng, and Yangzhou, China facilities. The Mexico segment focuses its operation of wind blades in Juárez and Matamoros, Mexico. The EMEAI segment offers wind blades from two facilities in Izmir, Turkey; and also performs wind blade inspection and repair services. The company was founded by Everett Pearson and Neil Tillotson in 1968 and is headquartered in Scottsdale, AZ.
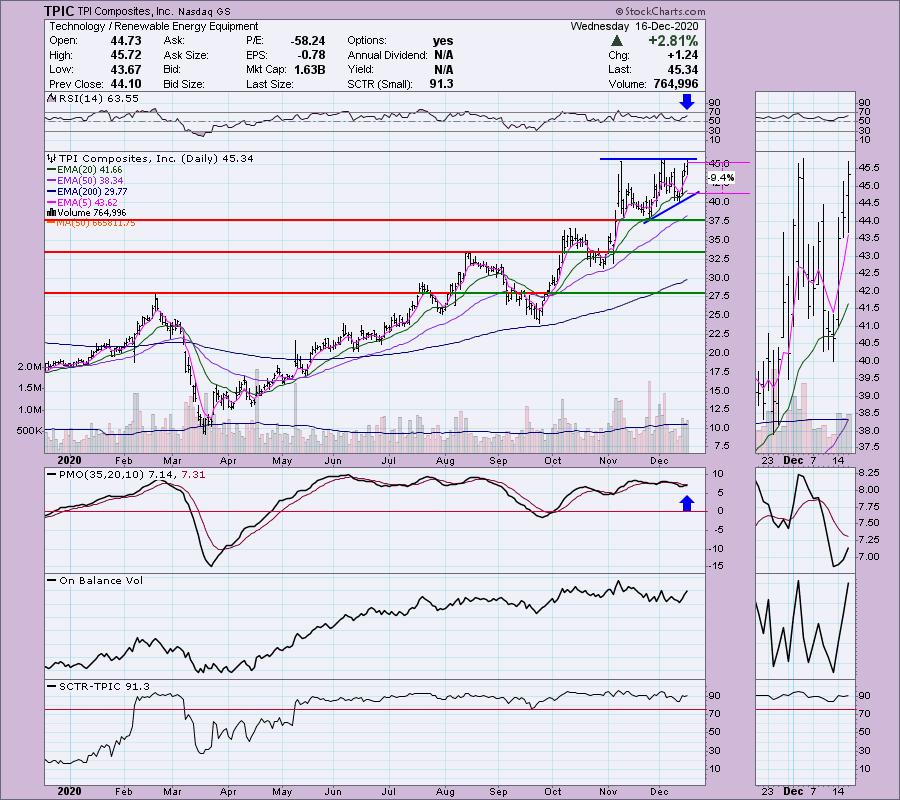
This one comes from my favorite industry group, Renewable Energy. If you aren't in solar, I recommend you consider it. It can be bouncy, but overall the returns have been excellent! Right now TPIC has an ascending triangle which is bullish with an expectation of an upside breakout. The RSI is positive and not overbought. The PMO is headed back up for a BUY signal.
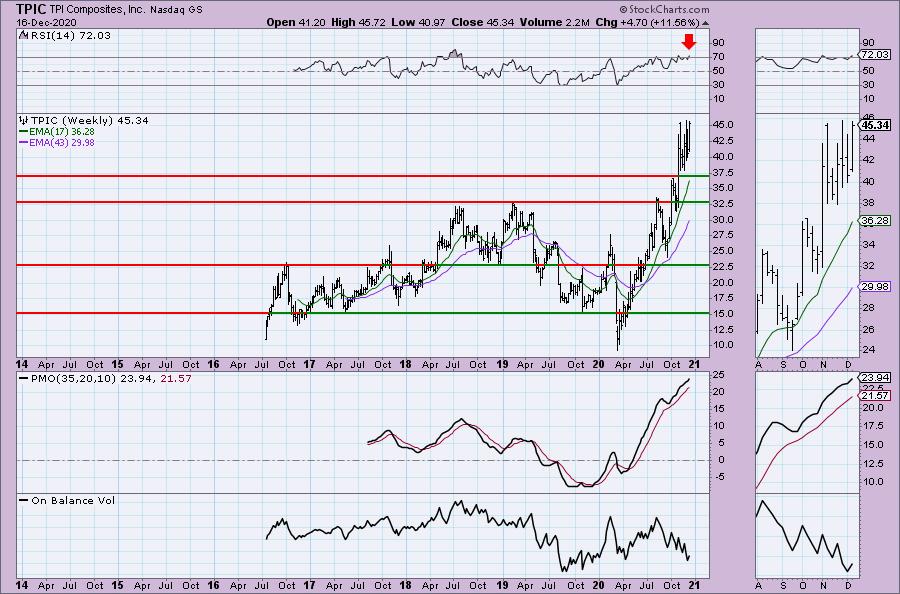
It shouldn't be a surprise to see a favorable weekly chart given that TPIC looked the best on the weekly RRG rather than the daily RRG. There is a serious negative divergence with the OBV and the RSI is on the overbought side, but momentum is definitely on its side. I've also noticed these stocks can remain overbought for some time.
Full Disclosure: I'm about 50% invested and 50% is in 'cash', I sold some positions today. Prior Diamonds that I sold this week, MSFT, ATNX, HIBB, HOG, PHM and REGN. I want to see how this possible market top plays out and I wanted to book some profits as well as get rid of laggards.
Current Market Outlook:
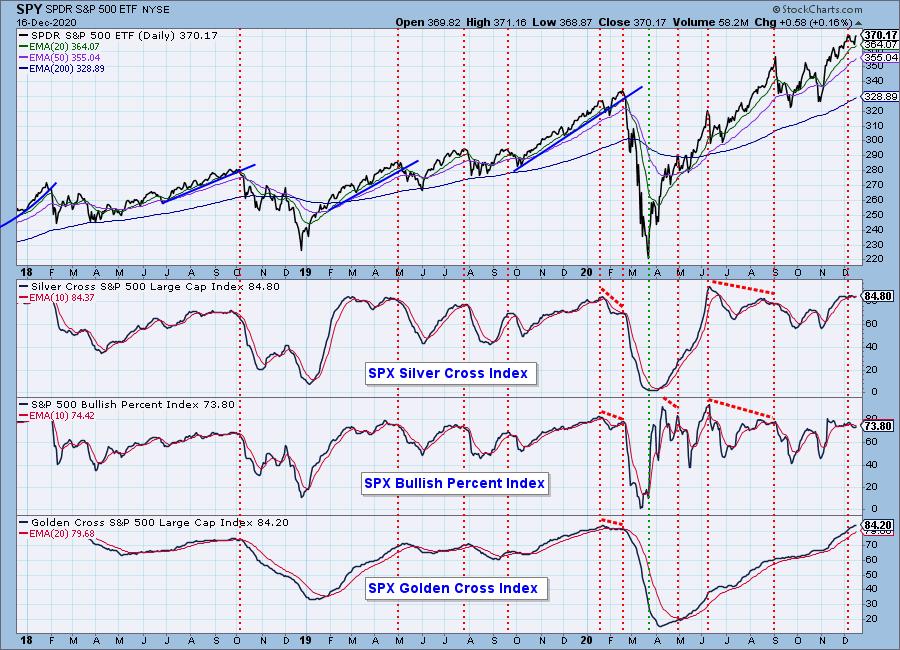
Market Environment: It is important to consider the odds for success by assessing the market tides. The following chart uses different methodologies for objectively showing the depth and trend of participation for intermediate- and long-term time frames.
- The Silver Cross Index (SCI) shows the percentage of SPX stocks on IT Trend Model BUY signals (20-EMA > 50-EMA)
- The Golden Cross Index (GCI) shows the percentage of SPX stocks on LT Trend Model BUY signals (50-EMA > 200-EMA)
- The Bullish Percent Index (BPI) shows the percentage of SPX stocks on Point & Figure BUY signals.
Don't forget that as a "Diamonds" member, you have access to our GCI/SCI curated ChartList on DecisionPoint.com. You'll find it under "Members Only" links on the left side on the Blogs and Links Page.
Here is the current chart:
Diamond Index:
- Diamond Scan Results: 2
- Diamond Dog Scan Results: 1
- Diamond Bull/Bear Ratio: 2.00
I'm in the process of trying to plot the Diamond Index, but with time at a premium, it is on the back burner.
Technical Analysis is a windsock, not a crystal ball.
Happy Charting!
- Erin
erin@decisionpoint.com
Watch the latest episode of DecisionPoint with Carl & Erin Swenlin on Mondays 7:00p EST or on the DecisionPoint playlist on the StockCharts TV YouTube channel here!
NOTE: The stocks reported herein are from mechanical trading model scans that are based upon moving average relationships, momentum and volume. DecisionPoint analysis is then applied to get five selections from the scans. The selections given should prompt readers to do a chart review using their own analysis process. This letter is not a call for a specific action to buy, sell or short any of the stocks provided. There are NO sure things or guaranteed returns on the daily selection of "diamonds in the rough."
Helpful DecisionPoint Links:
DecisionPoint Shared ChartList and DecisionPoint Chart Gallery
Price Momentum Oscillator (PMO)
Swenlin Trading Oscillators (STO-B and STO-V)
For more links, go to DecisionPoint.com!d