
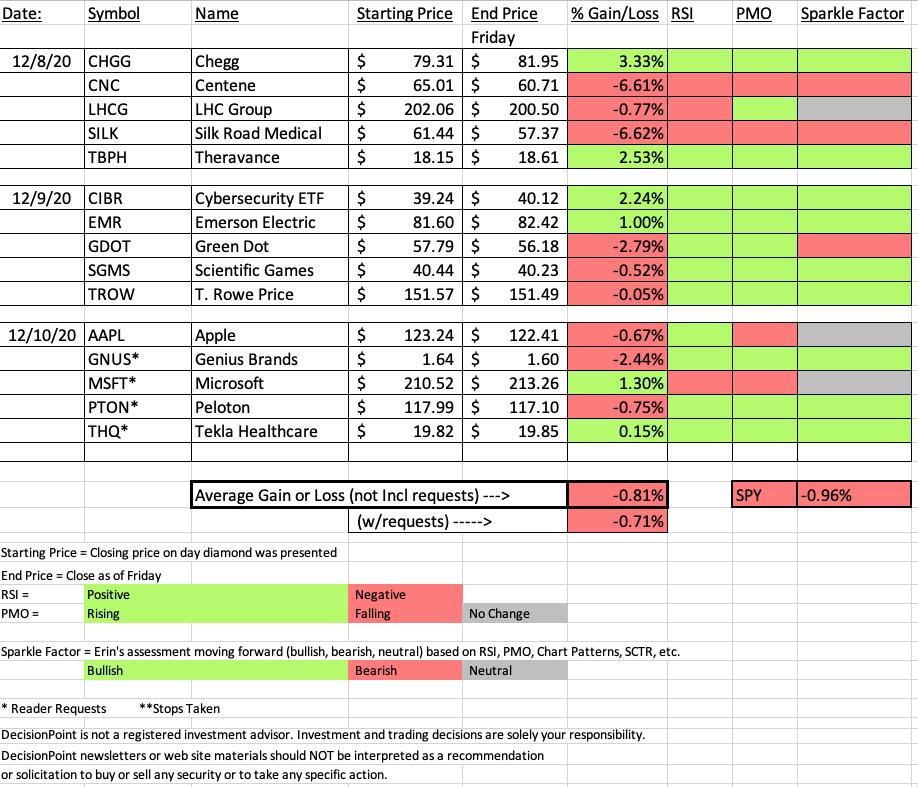
DecisionPoint "Diamonds in the Rough" performed slightly better than the SPY for the week, but ultimately, the SPY was down -0.96% and the diamonds in the rough were down -0.81%. Of the 15 diamonds presented this week, I am bullish on 9 going forward (note the "sparkle factor" in the final column of the spreadsheet is green). There are three neutral (gray) sparkle factor stocks.
Chegg (CHGG) was the best performer this week, up +3.33% so I will cover that one. Additionally, the biggest loser was mostly a tie between Centene (CNC) and Silk Road Medical (SILK) down -6.61% and -6.62% respectively. I'm opting not to cover those, I think the failure on these are clear and I went over them in the Diamond Mine. The one I want to cover under the "Dud" section would be Green Dot (GDOT). It was down -2.79% this week and despite a positive RSI and rising PMO, I gave it a bearish Sparkle Factor--I don't like it going forward.
The new Diamond Mine registration link is available below. Remember to save your confirmation email from Zoom. It has the link needed to join the room on Friday. Many times Zoom doesn't send out the one-hour reminder email on time, so having a copy of the original registration with the link will serve you well.
 Diamond Mine Information:
Here is today's (12/11/2020) recording link. Access Passcode: ?3mEYKLj
Register in advance for the next "DecisionPoint Diamond Mine" trading room on Friday (12/18/2020) 12:00p ET:
Here is the registration link for Friday, 12/18/2020. Registration & Entry Password: evergreen
Please do not share these links! They are for Diamonds subscribers ONLY!
Save the registration confirmation email with login instructions in case Zoom doesn't notify you in time.
A few items about the spreadsheet: I decided it only fair to denote "reader requests" as I shouldn't get to take credit if they turn out great! I've put on the spreadsheet whether the RSI is positive (green) or negative (red). The PMO column tells you if it is rising (green) or falling (red). Finally I've added my own "Sparkle Factor" that gives you my assessment going forward, bullish (green), bearish (red) or neutral (gray). The Sparkle Factor is basically my thoughts on whether I expect it to rise or fall. A neutral means it could really go either way so it could be added to a watch list. If you're in a stock I consider "neutral" going forward, the ball is in your court.

It's FREE!
***Click here to register for this recurring free DecisionPoint Trading Room!***
Did you miss the 12/9 DP Trading Room! Here's a link to the recording with Passcode: fNN=Q8h9
For best results, copy and paste the password to avoid typos.
Darling:
Chegg, Inc. (CHGG)
EARNINGS: 2/8/2021 (AMC)
Chegg, Inc. engages in the operations of learning platform for students. It intends to empower students to take control of their education and help the students study, college admissions exams, accomplish their goals, get grades, and test scores. The firm offers required and non-required scholastic materials including textbooks in any format; access to online homework help and textbook solutions; course organization and scheduling; college and university matching tools; and scholarship connections. Its services include Chegg study, writing, tutors, and math solver. The company was founded by Osman Rashid and Aayush Phumbhra on July 29, 2005 and is headquartered in Santa Clara, CA.
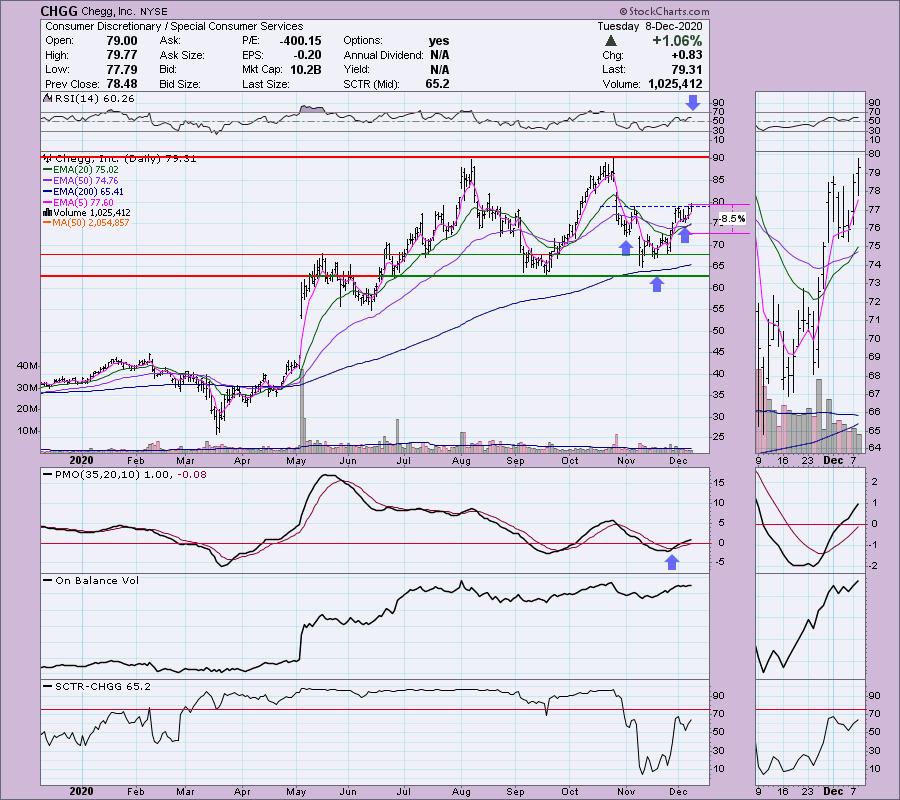
Here is the chart and commentary from 12/8:
"Up +0.24% in after hours trading, I covered CHGG twice before--April 27th (up +79.31%) and September 23rd (up +13.38%). It's lining up nice again with a reverse head and shoulders pattern. The RSI is positive and has been. The PMO is on a BUY signal. The PMO just recently hit positive territory and it is oversold. The OBV is confirming the current short-term rally. I set the stop around the left shoulder."
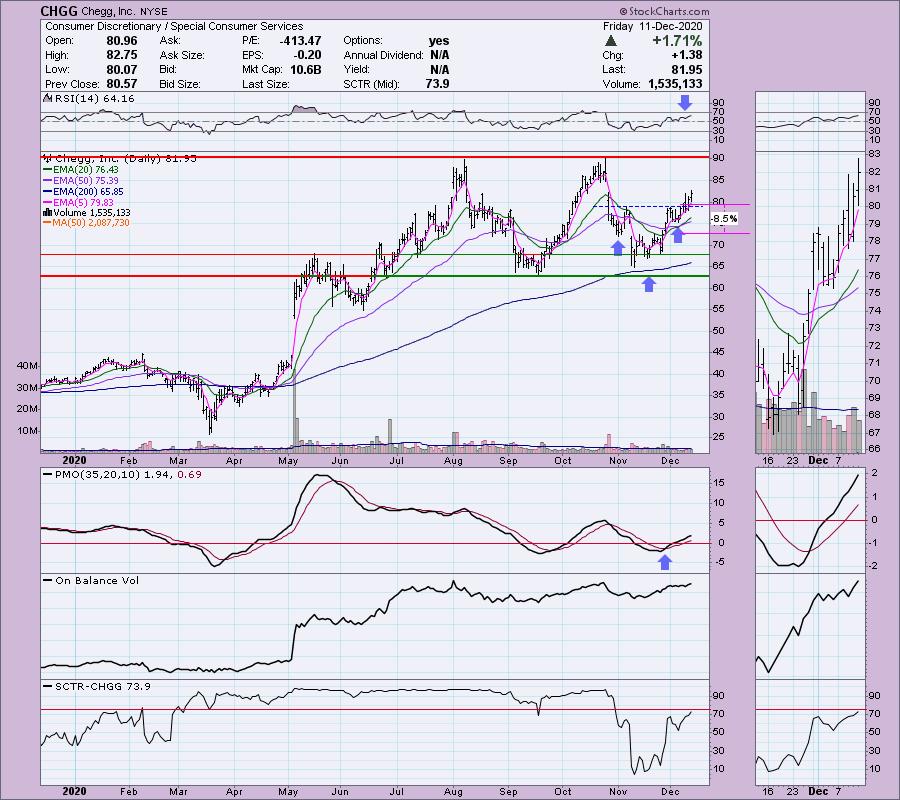
Here is today's chart.
I was looking for the breakout to execute the reverse head and shoulders. We got that yesterday, but today's follow-through makes Chegg (CHGG) even more attractive. The RSI isn't overbought yet and the PMO is still on that BUY signal and also not overbought. I expect more upside and a challenge of overhead resistance at $90.
Don't forget, on Thursdays I look at reader-requested symbols, so shoot me an email at erin@decisionpoint.com. I read every email I receive and try to answer them all!
Dud:
Green Dot Corp. (GDOT)
EARNINGS: 2/17/2021 (AMC)
Green Dot Corp. operates as a financial technology leader and bank holding company, which engages in the provision of prepaid cards, debit cards, checking accounts, secured credit cards, payroll debit cards, consumer cash processing services, wage disbursements, and tax refund processing services. It operates through the following segments: Account Services; and Processing and Settlement Services. The Account Services segment consists of revenues and expenses derived from deposit account programs, such as prepaid cards, debit cards, consumer and small business checking accounts, secured credit cards, payroll debit cards and gift cards. The Processing and Settlement Services segment comprises of products and services that specialize in facilitating the movement of funds on behalf of consumers and businesses. The company was founded by Steven W. Streit in October 1, 1999 and is headquartered in Pasadena, CA.
Here is the chart and commentary from 12/9:
"This one was very interesting. We have a double-bottom (or even a triple bottom if you wish). Price hasn't quite broken out yet, but seeing the now positive RSI and PMO crossover BUY signal just above the zero line, I believe it will. We even have an OBV positive divergence. I would go with a tight stop. If it can't hold above those EMAs, it likely isn't done consolidating."
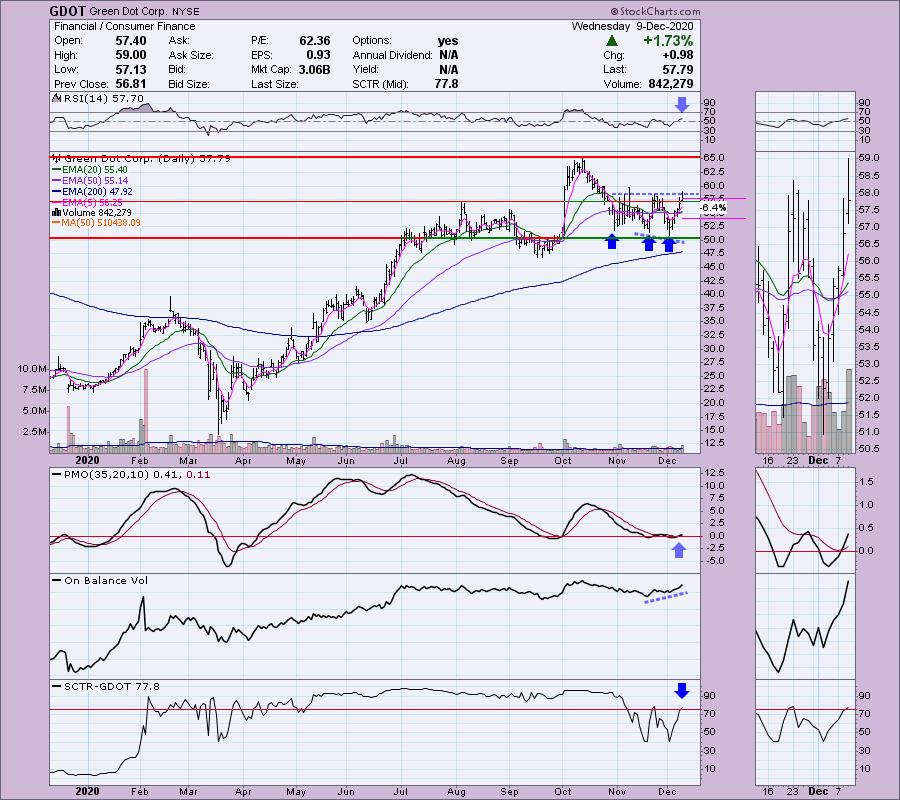
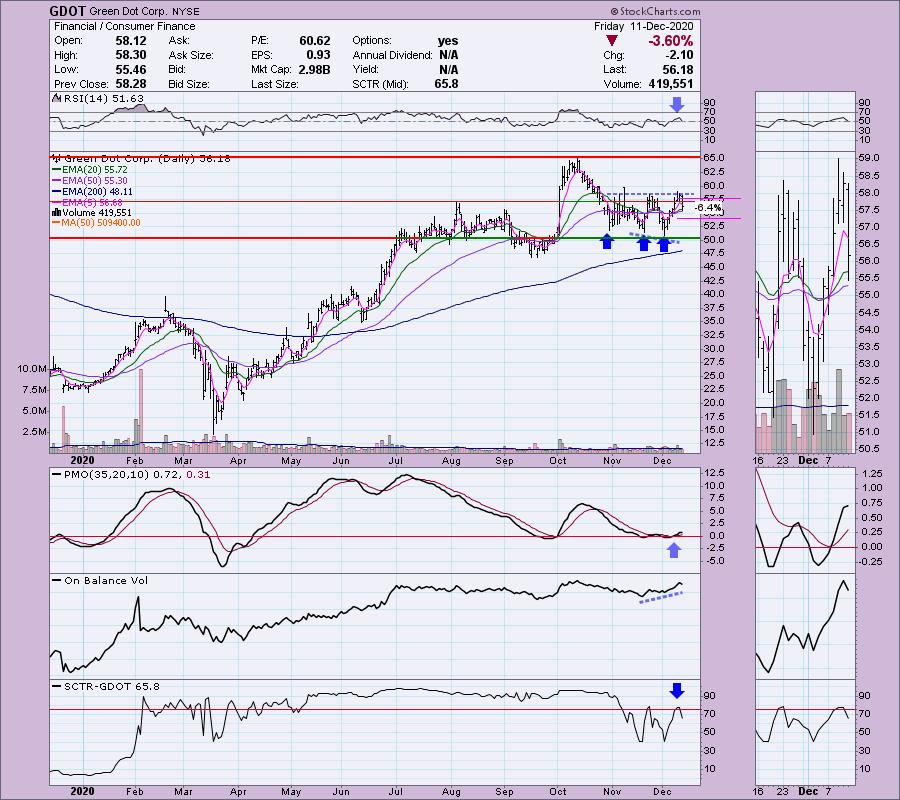
Below is today's chart:
The breakout never occurred so this one is likely headed to test the bottom of the trading range. The double-bottom/triple-bottom pattern didn't execute. I would keep this on a watch list since the indicators are still flashing positive for now. This could be a great grab if it rebounds near support at $50.
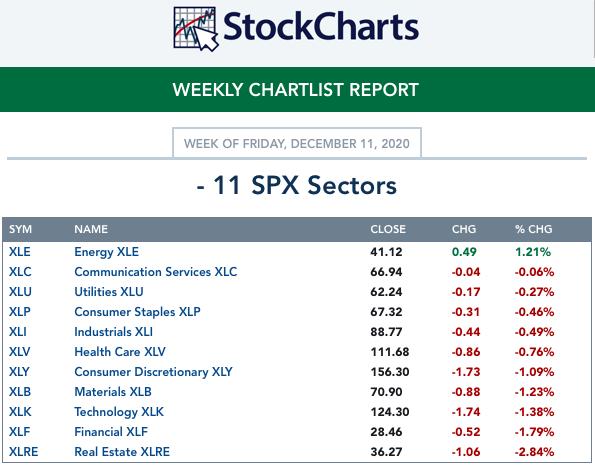
THIS WEEK's Sector Performance:
Click Here to view Carl's annotated Sector ChartList!
CONCLUSION:
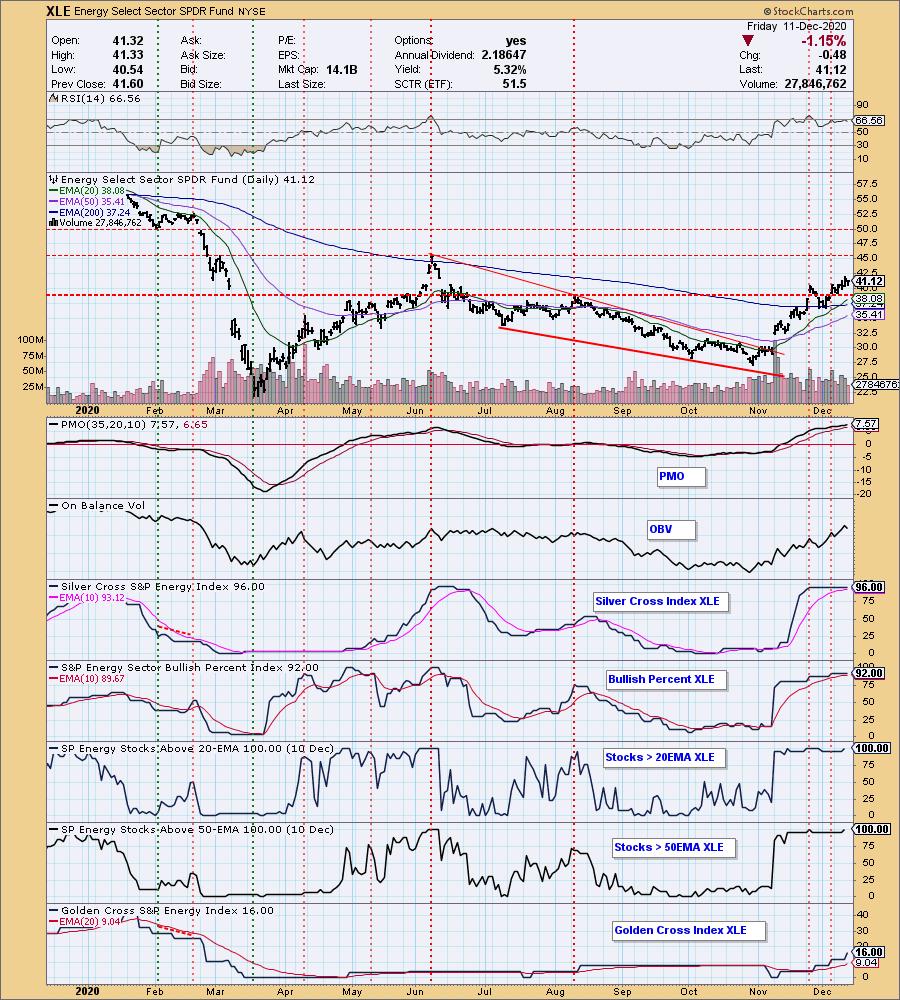
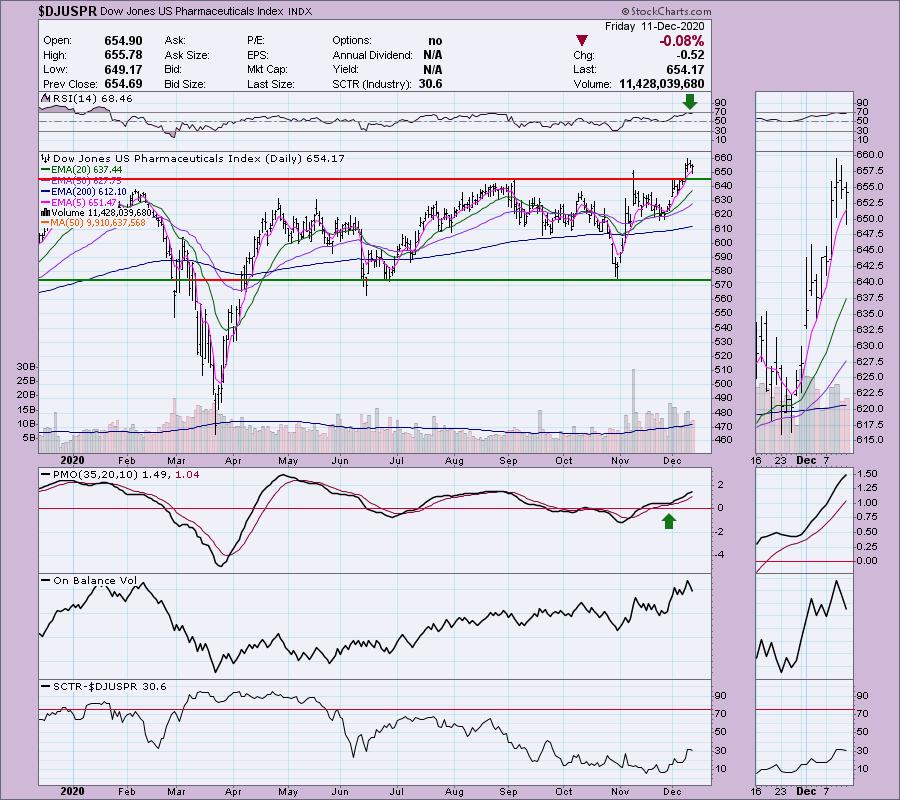
Last week's sector to watch was the Real Estate (XLRE) sector. Turns out I was wrong, but if you look at the sector chart, you can see how the indicators were on the rise and not overbought last Friday, hence my choice. The ONLY sector with rising momentum is Energy. The rest are overbought and falling so I have to make Energy my choice, although I am expecting to see it breakdown eventually because it has been in overbought territory for some time now when you look at the indicators. I actually picked my industry group to watch from the Healthcare sector. I really liked the chart with the breakout and pullback to the breakout point.
Sector to Watch: Energy (XLE)
Industry Group to Watch: Pharmaceuticals ($DJUSPR)
Go to our Sector ChartList on DecisionPoint.com to get an in depth view of all the sectors.
Have a great weekend! Happy Charting!
- Erin
erin@decisionpoint.com
Full Disclosure: I'm about 70% invested right now and 30% is in 'cash', meaning in money markets and readily available to trade with. I will continue to add to my portfolio next week if the market outlook remains bullish in the short term. I will be considering entries into SGEN and XRAY next week.
Technical Analysis is a windsock, not a crystal ball.
Watch the latest episode of DecisionPoint with Carl & Erin Swenlin on Mondays 7:00p EST or on the DecisionPoint playlist on the StockCharts TV YouTube channel here!
NOTE: The stocks reported herein are from mechanical trading model scans that are based upon moving average relationships, momentum and volume. DecisionPoint analysis is then applied to get five selections from the scans. The selections given should prompt readers to do a chart review using their own analysis process. This letter is not a call for a specific action to buy, sell or short any of the stocks provided. There are NO sure things or guaranteed returns on the daily selection of "diamonds in the rough."
Helpful DecisionPoint Links:
DecisionPoint Shared ChartList and DecisionPoint Chart Gallery
Price Momentum Oscillator (PMO)
Swenlin Trading Oscillators (STO-B and STO-V)
For more links, go to DecisionPoint.com!f