
I decided to stay up late and do the DP Diamonds Report today instead of Wednesday to prep for Thanksgiving. I wavered somewhat as I sat down to write this given the late hour, but I knew I would be unhappy with myself on Wednesday if I didn't do it now. Fortunately there were plenty of "diamonds in the rough" to review and I easily found my five.
I know that we all have been surveying the Energy sector to find stocks that can take advantage of the rally in Oil prices before a reversal. I found one that I think is favorable. Let's go!
Today's "Diamonds in the Rough" are: AUDC, COG, CVM, SEDG and SPWH.
 Diamond Mine Information:
Here is Friday's (11/20) recording link. Use Access Passcode: @f#x+6qP
Register in advance for the next "DecisionPoint Diamond Mine" trading room on Friday (12/4/2020) 12:00p ET:
Here is the registration link for Friday, 12/4/2020. Password: turkey
Please do not share these links! They are for Diamonds subscribers ONLY!

It's Free!
***Click here to register for this recurring free DecisionPoint Trading Room on Mondays at Noon ET!***
Did you miss the 11/23 free trading room? Here is a link to the recording. Access Code: EE4Xi6Y$
For best results, copy and paste the access code to avoid typos.
Welcome to DecisionPoint Daily Diamonds, wherein I highlight five "diamonds in the rough." These are selected from the results of my DecisionPoint scans, which search for stocks that could benefit from the trend and condition of the market. Remember, these are not recommendations to buy or sell, but are the most interesting of the stocks that surfaced in my scans. My objective is to save you the work of the initial, tedious culling process, but you need to apply your own analysis to see if these stocks pique your interest as well. There are no guaranteed winners here!
AudioCodes Ltd. (AUDC)
EARNINGS: 1/26/2021 (BMO)
AudioCodes Ltd. engages in the development, manufacture, and marketing of products for transferring voice and data over the internet. Its products include products for Microsoft 365, session border controllers, multi-service business routers, internet protocol phones, digital and analog media gateways, management products and solutions, and voice applications. The company was founded by Shabtai Adlersberg in 1993 and is headquartered in Lod, Israel.
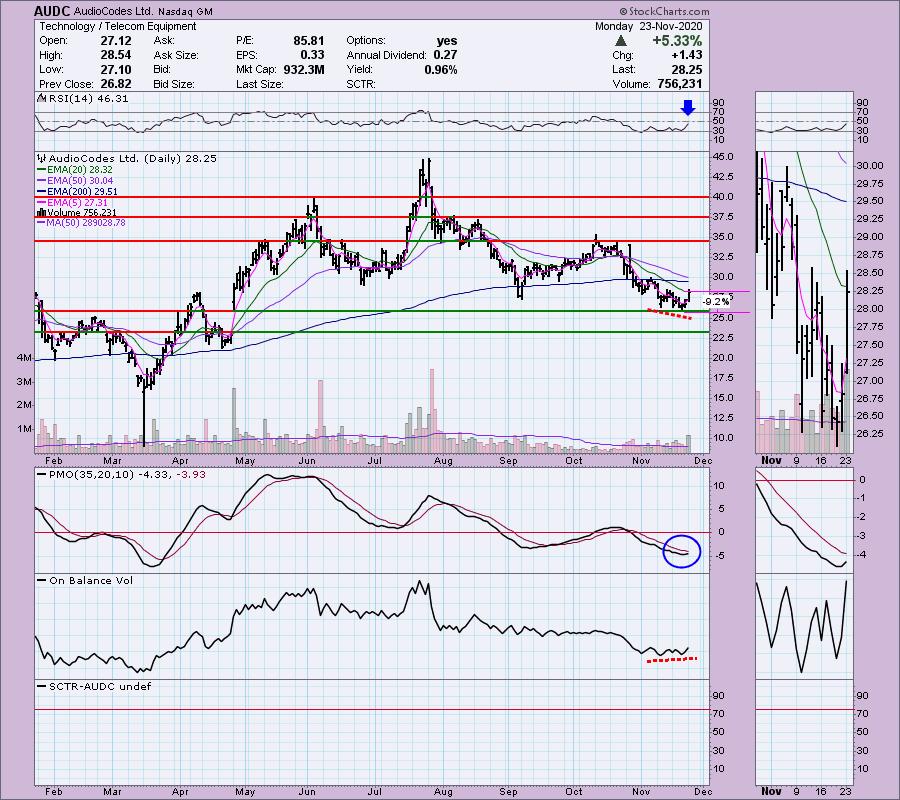
I covered AUDC as a reader request in the May 29th Diamonds Report. At the time I wrote that I was "Neutral to Bearish" on the stock. It's now hit important gap support. Notice the gap that formed at the end of April. That gap has yet to be closed which is a good thing. If it can avoid closing that gap, it should rebound higher. The rally today took price back above the 20-EMA for the first time since it lost it in late October. There is a nice positive OBV divergence and the PMO has turned up. The RSI is still negative, but is rising and getting close to positive territory. Setting the stop level was easy given short-term support is clear and the percentage is manageable at less than 10%.
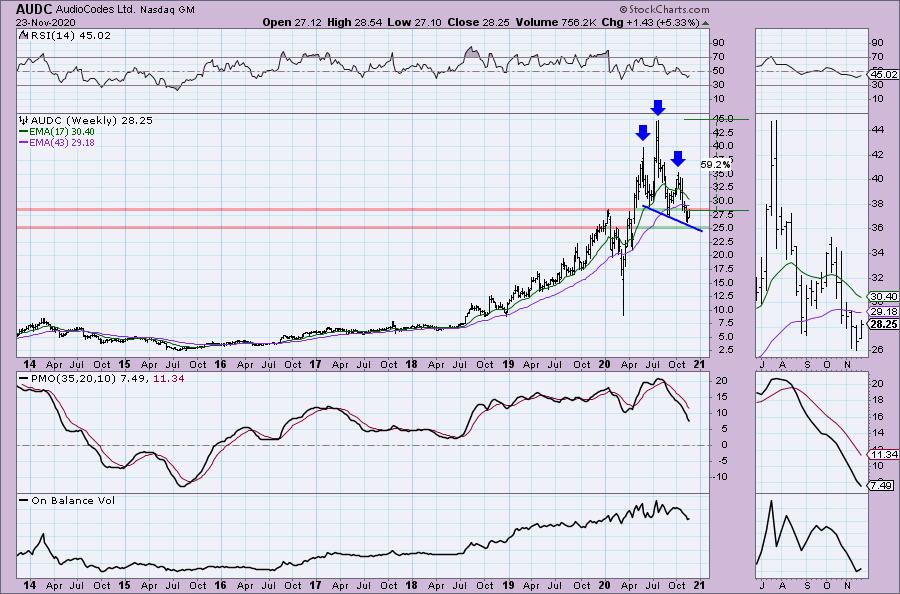
I'll tell you right now that every weekly chart in today's report is bearish. This means we should consider this and the rest short-term investments. The large head and shoulders on the weekly chart is very ugly, but fortunately it has a downward sloping neckline so price hasn't executed the pattern. The RSI and PMO are negative.
Cabot Oil & Gas Corp. (COG)
EARNINGS: 2/18/2021 (AMC)
Cabot Oil & Gas Corp. engages in the development, exploitation, and exploration of oil and gas properties. It operates through the Marcellus shale in Pennsylvania. The company was founded in 1989 and is headquartered in Houston, TX.
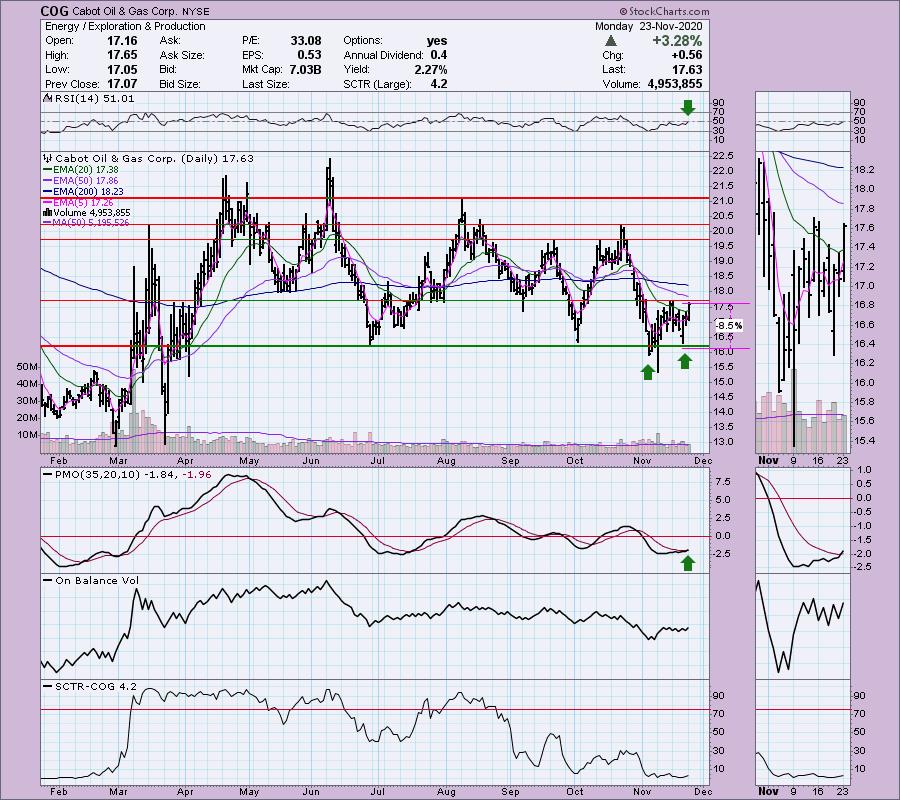
Here is your possible Energy sector trade. The indicators are lined up beautifully with the RSI just moving into positive territory and the PMO just now triggering a crossover BUY signal. The upside target of the double-bottom would put price just below overhead resistance at $19.50. The SCTR is ugly, but folks, this is from the beat down Energy sector. I doubt you'll find many strong SCTRs there. This is another with a fairly obvious stop level.
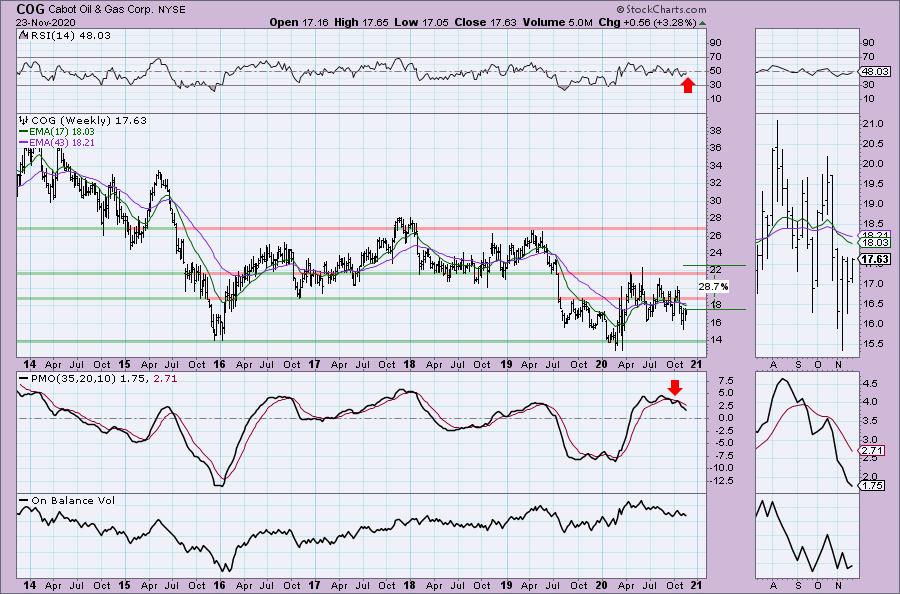
Another ugly weekly chart. Again, when the weekly chart is ugly, you'll need to watch your investment with a short-term horizon. There certainly is more upside potential than I have marked, but I would be pleased to just reach the 2020 top.
Don't forget, on Thursdays I look at reader-requested symbols, so shoot me an email at erin@decisionpoint.com. I read every email I receive and try to answer them all!
Cel-Sci Corp. (CVM)
EARNINGS: 12/14/2020 (AMC)
CEL-SCI Corp. is a biotechnology company, which engages in the research, development, and manufacture of investigational immunotherapy products for the treatment of cancer and infectious diseases. Its product pipeline includes Multikine and Ligand Epitope Presentation System (LEAPS). Multikine is an investigational immunotherapy for the potential treatment of head and neck cancers. LEAPS is categorized into LEAPS-H1N1-DC, a product candidate for the treatment of pandemic influenza for hospitalized patients; and CEL-2000 and CEL-4000 which are vaccine candidates for the treatment of rheumatoid arthritis. The company was founded by Maximilian de Clara on March 22, 1983 and is headquartered in Vienna, VA.
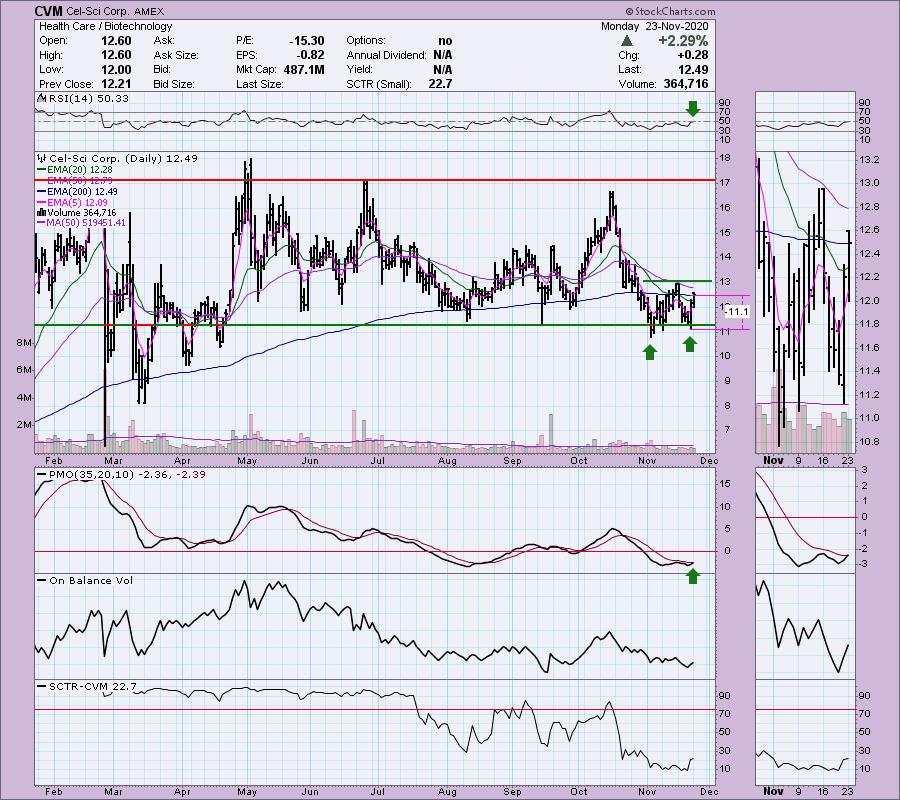
This is another stock that is in a very wide trading range and currently price is near the bottom of it. There is a double-bottom forming. The PMO triggered a BUY signal and the RSI just popped into positive territory. Price is above the 20-EMA, but we can see that the 50-EMA will be the first test and the second test will be the confirmation line of the building double-bottom pattern. The OBV isn't telling us much right now, but we do see the SCTR rising. I picked the stop level to be at the second bottom of the developing pattern.
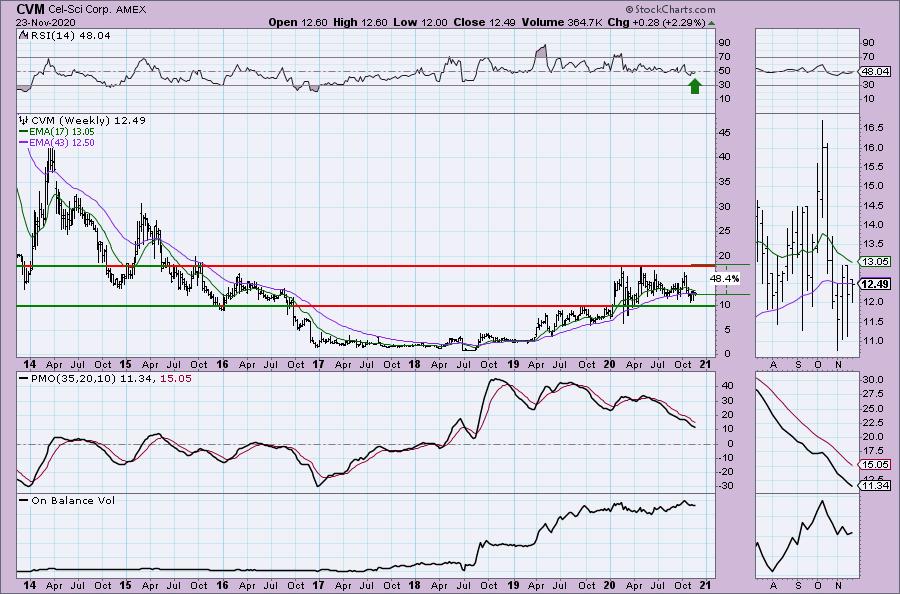
If price can get back to the top of the 2020 trading range, that would be a 48%+ gain. The weekly PMO is ugly, but we are seeing some improvement on the weekly RSI.
SolarEdge Technologies, Inc. (SEDG)
EARNINGS: 2/17/2021 (AMC)
SolarEdge Technologies, Inc. engages in the development of smart energy technology. Its products and services include photovoltaic inverters, power optimizers, photovoltaic monitoring, software tools, and electric vehicle chargers. The company was founded by Guy Sella, Lior Handelsman, Yoav Galin, Meir Adest, and Amir Fishelov in 2006 and is headquartered in Herzliya, Israel.
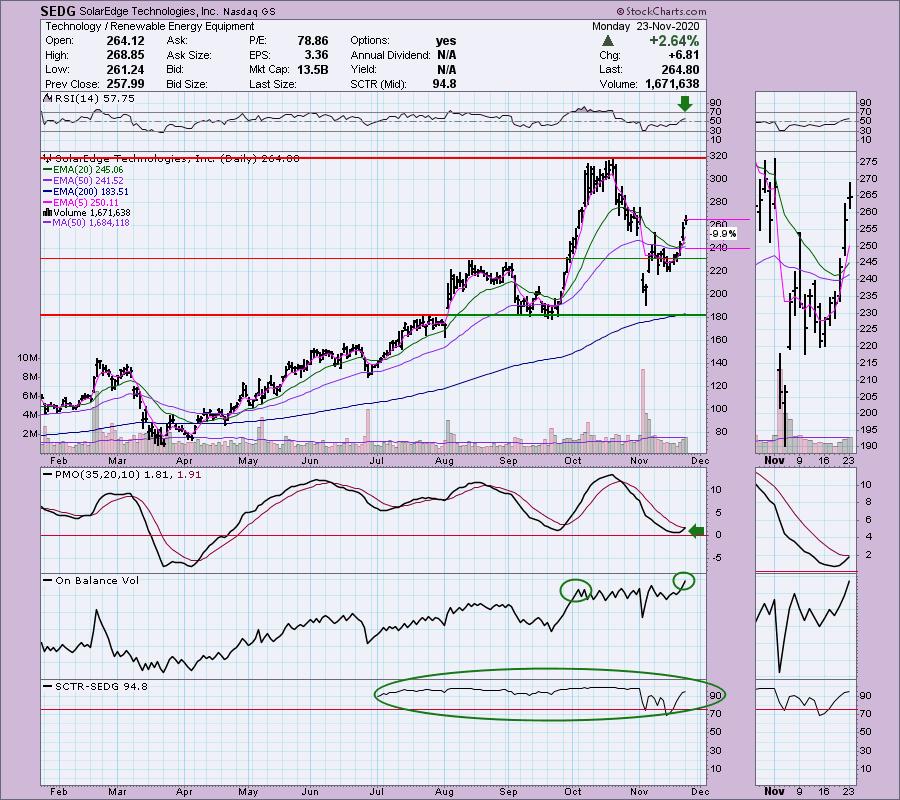
Here is yet another solar stock for you that appeared in my Diamond PMO Scan today. I covered Sunrun (RUN) on Thursday of last week. This one looks great. It avoided a negative 20/50-EMA crossover. The PMO is nearing a BUY signal. The RSI just hit positive territory and the SCTR is first-rate. Price retracing after a deep correction. If you wanted something to worry about, there is a reverse divergence on the OBV. Notice the influx in volume based on the OBV, yet the price top was well below the previous price top. Price should follow volume and when it doesn't, we should be careful. I still like it.
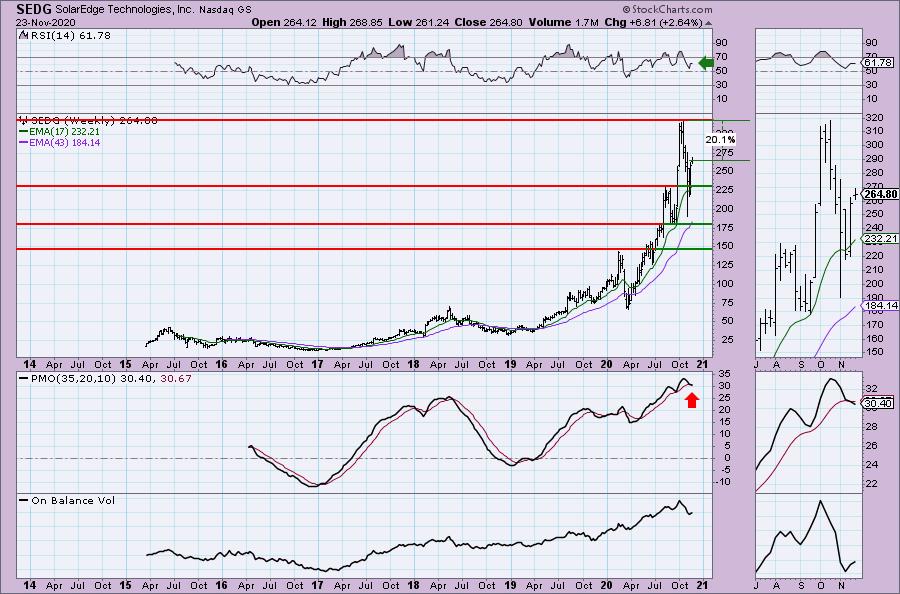
Another less than bullish weekly chart given the new PMO SELL signal. The RSI is positive. I believe price will easily overcome the previous 2020 price high, but watch this weekly chart and make sure that PMO flattens out more.
Sportsman's Warehouse Holdings, Inc. (SPWH)
EARNINGS: 12/2/2020 (AMC)
Sportsman's Warehouse Holdings, Inc. engages in the retail of sporting and athletic goods through its wholly owned subsidiaries, Sportsman's Warehouse, Inc., and Minnesota Merchandising Corp. Its products include hunting and shooting; archery; fishing; camping; boating accessories; optics and electronics; knives and tools; and footwear. The company was founded in 1986 and is headquartered in West Jordan, UT.
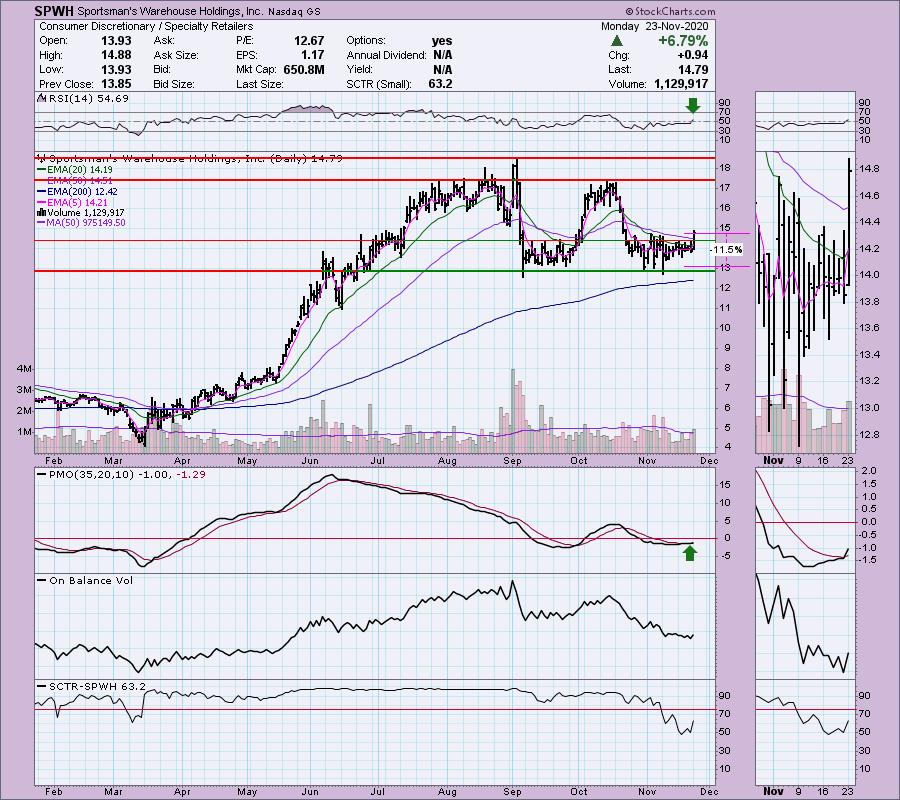
I presented Hibbett Sports (HIBB) and bought it last week. Today this sporting goods company appeared on my scans. I like this chart, but know that it will likely pullback tomorrow. I'll be glad for that if it does as I can thin out my stop. I don't like stops greater than 10%, but this one needed to be set at least that low based on the September bottoms. The PMO is on a BUY signal and the RSI just moved positive. We are seeing confirmation on the OBV, but the SCTR is rising back toward the "hot zone" above 75. Today's breakout was very constructive, bringing price up above both the 20/50-EMAs and out of the recent trading zone.
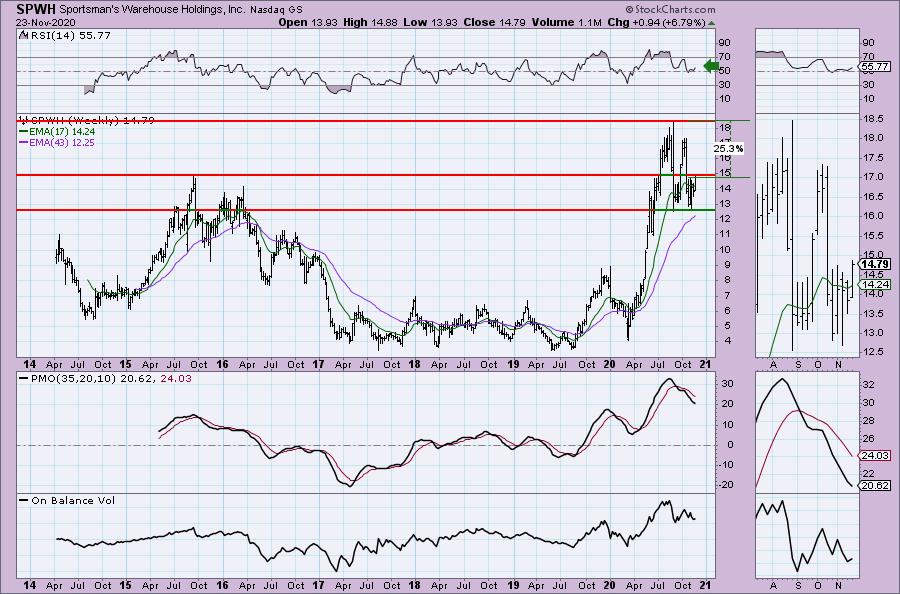
The weekly PMO doesn't look good, but the RSI is still positive. We really need to see price get back above $15 given that area of resistance matches up with the 2015 top.
Full Disclosure: Orders went through as I noted in Friday's Recap so I'm about 65% invested and 35% is in 'cash', meaning in money markets and readily available to trade with.
Current Market Outlook:
Market Environment: It is important to consider the odds for success by assessing the market tides. The following chart uses different methodologies for objectively showing the depth and trend of participation for intermediate- and long-term time frames.
- The Silver Cross Index (SCI) shows the percentage of SPX stocks on IT Trend Model BUY signals (20-EMA > 50-EMA)
- The Golden Cross Index (GCI) shows the percentage of SPX stocks on LT Trend Model BUY signals (50-EMA > 200-EMA)
- The Bullish Percent Index (BPI) shows the percentage of SPX stocks on Point & Figure BUY signals.
Don't forget that as a "Diamonds" member, you have access to our GCI/SCI curated ChartList on DecisionPoint.com. You'll find it under "Members Only" links on the left side on the Blogs and Links Page.
Here is the current chart:

Diamond Index:
- Diamond Scan Results: 7
- Diamond Dog Scan Results: 7
- Diamond Bull/Bear Ratio: 1.00
I'm in the process of trying to plot the Diamond Index, but with time at a premium, it is on the back burner.
Technical Analysis is a windsock, not a crystal ball.
Happy Charting!
- Erin
erin@decisionpoint.com
Watch the latest episode of DecisionPoint with Carl & Erin Swenlin on Mondays 7:00p EST or on the DecisionPoint playlist on the StockCharts TV YouTube channel here!
NOTE: The stocks reported herein are from mechanical trading model scans that are based upon moving average relationships, momentum and volume. DecisionPoint analysis is then applied to get five selections from the scans. The selections given should prompt readers to do a chart review using their own analysis process. This letter is not a call for a specific action to buy, sell or short any of the stocks provided. There are NO sure things or guaranteed returns on the daily selection of "diamonds in the rough."
Helpful DecisionPoint Links:
DecisionPoint Shared ChartList and DecisionPoint Chart Gallery
Price Momentum Oscillator (PMO)
Swenlin Trading Oscillators (STO-B and STO-V)
For more links, go to DecisionPoint.com!I