
I sent you an early look at Snap (SNAP) yesterday as it was my "Diamond of the Week" on this week's DecisionPoint Show, but I will talk more about it today as I still like it, especially on the pullback today. Technology did seem to dominate my scan results so it wasn't surprising that I added a few in today. I know many of you like to trade ETFs and today I had two interesting ones cross my screen. I would remind everyone of one of last week's Diamonds SKYY which is a cloud ETF and it continues to perform. I had a subscriber ask me if I could put the stock symbols in this opening paragraph, but as I explained to him, not everyone on our website is a Diamond subscriber (crazy, I know!) and therefore, I do not want to share the symbols in a way that they can be deciphered by non-subscribers. I'm very much enjoying the trading rooms! I have information for both the subscriber-only "Diamond Mine" and the free DP LIVE Trading Room below. Given that I put these links inside the Diamond Reports, I will probably stop inundating your email with the links. It's easier on me and hopefully easier on your email box.
 Diamond Mine Information:
Recording from 8/28 is at this link. The password to view the recording is: $LeoDog24
Register in advance for the "DecisionPoint Diamond Mine" Friday (9/4) 12:00p EST:
Here is this week's registration link. Password: dpdmine
Please do not share links! They are for Diamonds subscribers ONLY!

Click here to register in advance for the recurring free DecisionPoint Trading Room! Did you miss the 8/31 trading room? Here is a link to the recording (password: V#^P89Yv).
Welcome to DecisionPoint Daily Diamonds, wherein I highlight five "diamonds in the rough." These are selected from the results of my DecisionPoint scans, which search for stocks that could benefit from the trend and condition of the market. Remember, these are not recommendations to buy or sell, but are the most interesting of the stocks that surfaced in my scans. My objective is to save you the work of the initial, tedious culling process, but you need to apply your own analysis to see if these stocks pique your interest as well. There are no guaranteed winners here!
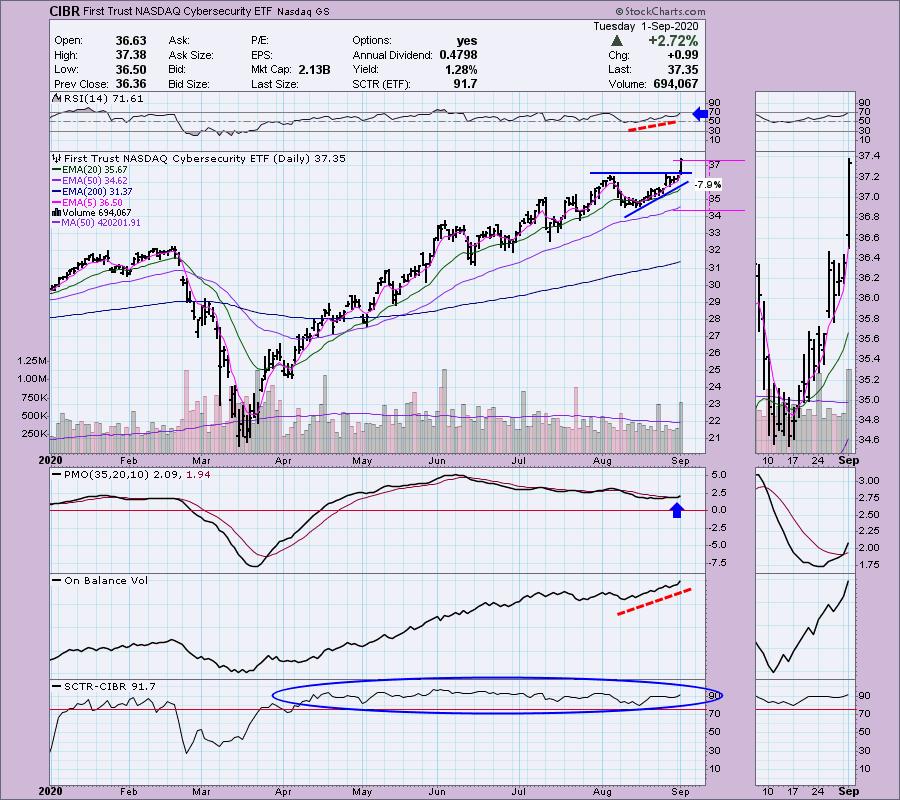
First Trust NASDAQ Cybersecurity ETF (CIBR) - Earnings: N/A
CIBR tracks a liquidity-weighted index that targets companies engaged in the cybersecurity industry.
Up 0.46% in after hours trading, CIBR was a Diamond back on July 6th at $33.85. It hit my radar again today on a big breakout from a bullish ascending triangle. I would look for a pullback, but given it is up nearly half a percent in after hours trading, that may not be possible. Keep an eye on the 5-minute bar chart tomorrow. The RSI is getting a bit overbought which does hint at a possible pullback ahead. However, the PMO has just given us a crossover BUY signal and the OBV is confirming the rally. I like that I can set a stop just below strong support at those August lows.
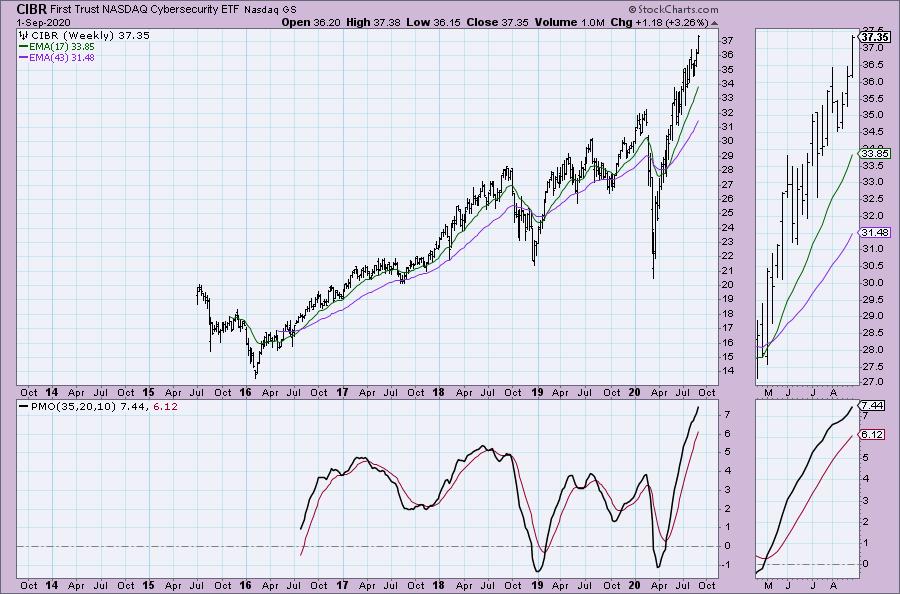
Nothing to complain about on the weekly chart except maybe the vertical rally. However, those types of rallies are everywhere coming out of the March lows. Just be sure to be true to your stops.
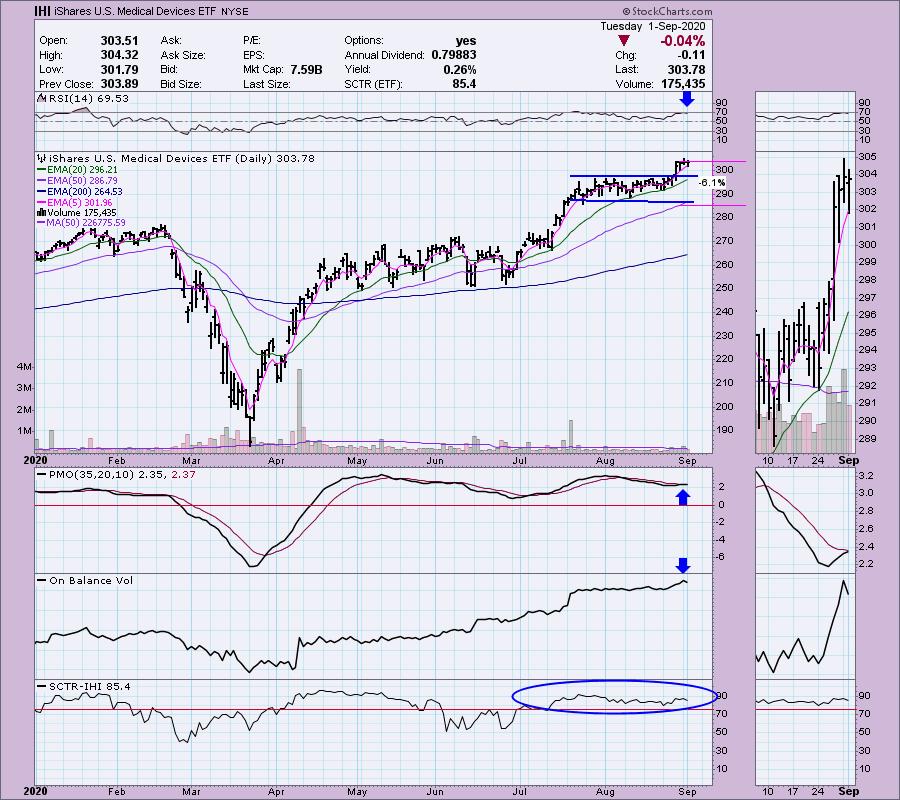
iShares US Medical Devices (IHI) - Earnings: N/A
IHI tracks a market-cap-weighted index of manufacturers and distributors of medical devices in the US.
Down -0.11% in after hours trading, IHI broke out of a consolidation or basing pattern. Since breaking out it seems to be taking a pause. I like that we saw a breakout on the OBV at the same time we had the first price breakout. The RSI is positive and the PMO is about to give us a crossover BUY signal.
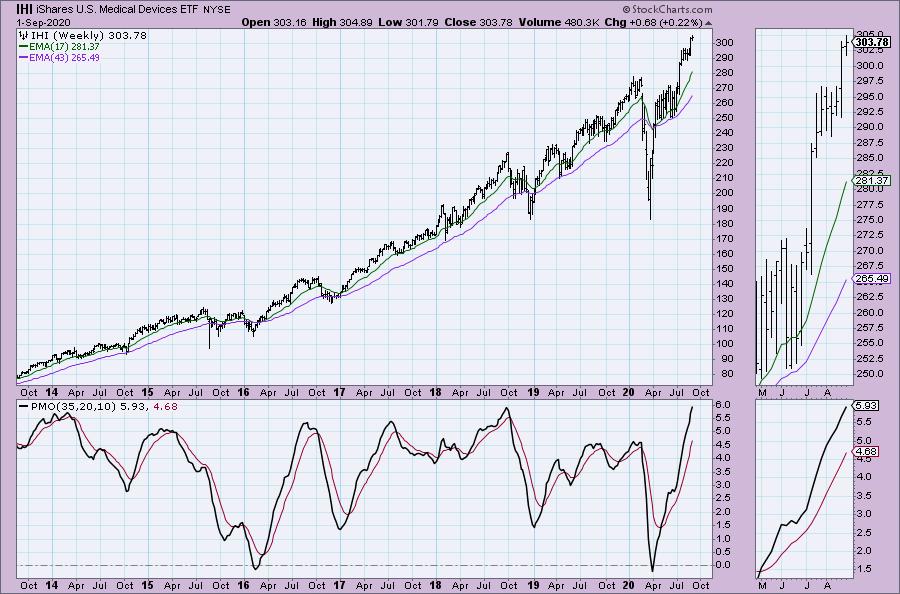
I like the bull flag on the IHI on the weekly chart. You can see that the breakout has essentially executed that flag. The PMO is rising nicely though overbought.
Don't forget, on Thursdays I look at reader-requested symbols, so shoot me an email at erin@decisionpoint.com. I read every email I receive and try to answer them all!
MSCI Inc (MSCI) - Earnings: 10/29/2020 (BMO)
MSCI, Inc. engages in the provision of investment decision support tools, including indices, portfolio risk and performance analytics and corporate governance products and services. The company operates through the following business segments: Index; Analytics; Environmental, Social, and Governance (ESG); and Real Estate. The Index segment involves in the index-linked product creation and performance benchmarking, as well as portfolio construction and rebalancing, and asset allocation. The Analytics segment offers risk management, performance attribution and portfolio management content, applications and services. The ESG segment offers products and services that help institutional investors understand how ESG factors can impact the long-term risk of investments. The Real Estate segment includes research, reporting, market data and benchmarking offerings that provide real estate performance analysis for funds, investors and managers.. The company was founded by Andrew Thomas Rudd in 1998 and is headquartered in New York, NY.
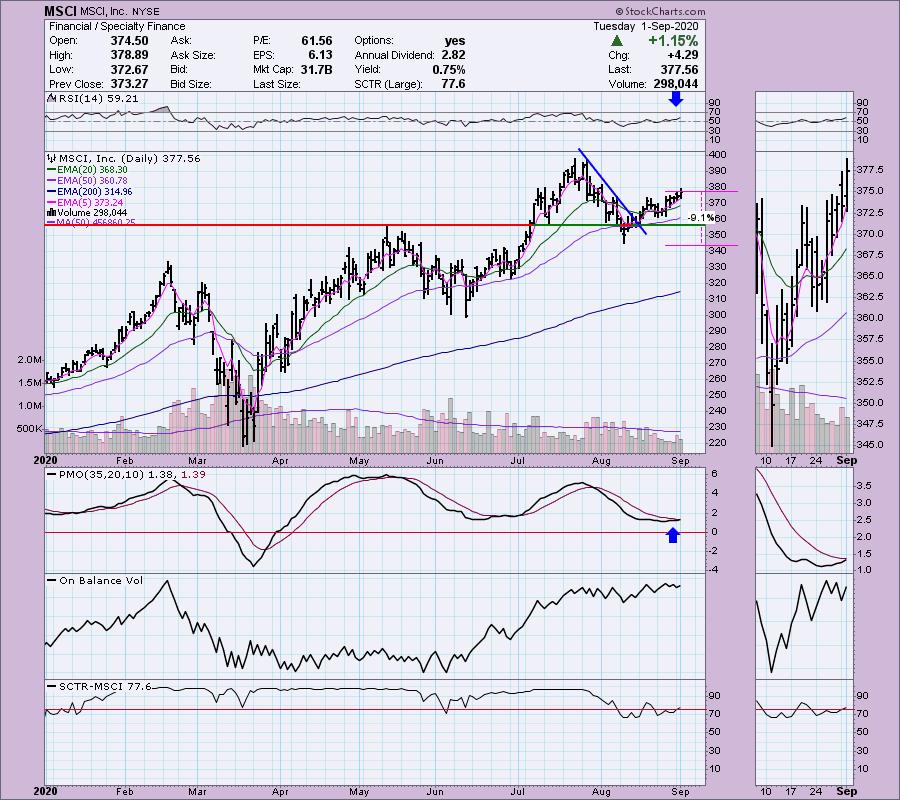
I was expecting financials to perk up this week, but so far I haven't seen much action there--at least as far as my scans are concerned. This one has been in the results for three days and I think it is now ripe. Price had broken a declining trend and has now formed a bullish "V" bottom. I think you could also make a case for a short-term reverse head and shoulders coming off the big decline from the July top. The RSI has just turned positive and the PMO is going in for a crossover BUY signal. The OBV is confirming the rally in the shorter term. It is a somewhat deep stop at 9%, but you could certainly tighten it up to just below the May top.
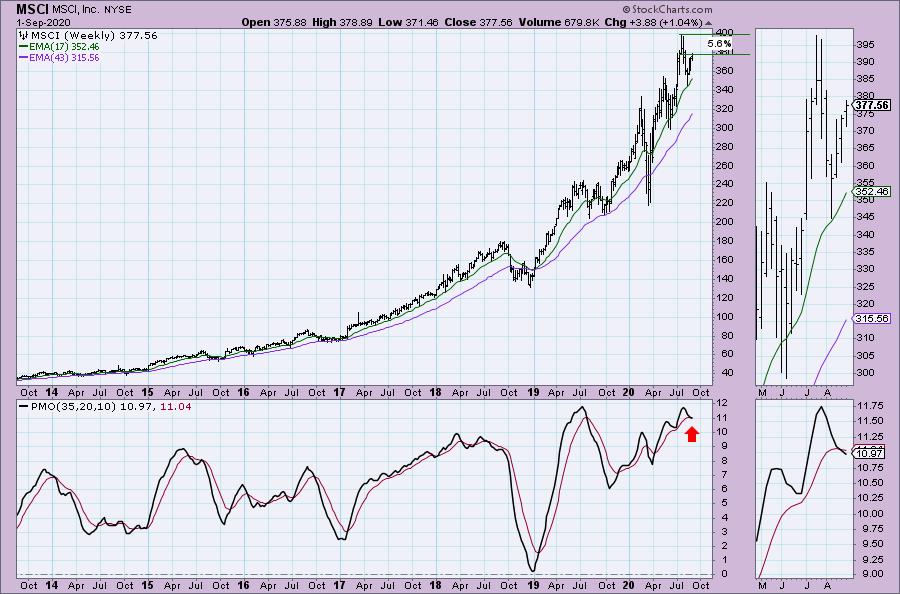
This was disconcerting when I pulled it up. I like the daily chart, but seeing a new PMO SELL signal in overbought territory isn't comforting. Using a tighter stop might be a good idea after all.
Snap Inc (SNAP) - Earnings: 10/20/2020 (AMC)
Snap, Inc. engages in the operation of its camera platform. Its products include Snapchat, using the camera and editing tools to take and share Snaps, Friends Page, which lets users create and use Stories, Groups, Video and Chat, Discover for searching and surfacing relevant Stories, Snap Map, which shows friends, Stories and Snaps near the user, Memories, for saving personal collections, and Spectacles, wearable sunglasses capable of taking Snaps and interacting directly with the Snapchat application. The company's primary source of revenue is advertising. Snap was founded by Frank Reginald Brown IV, Evan Thomas Spiegel, and Robert C. Murphy in 2010 and is headquartered in Santa Monica, CA.
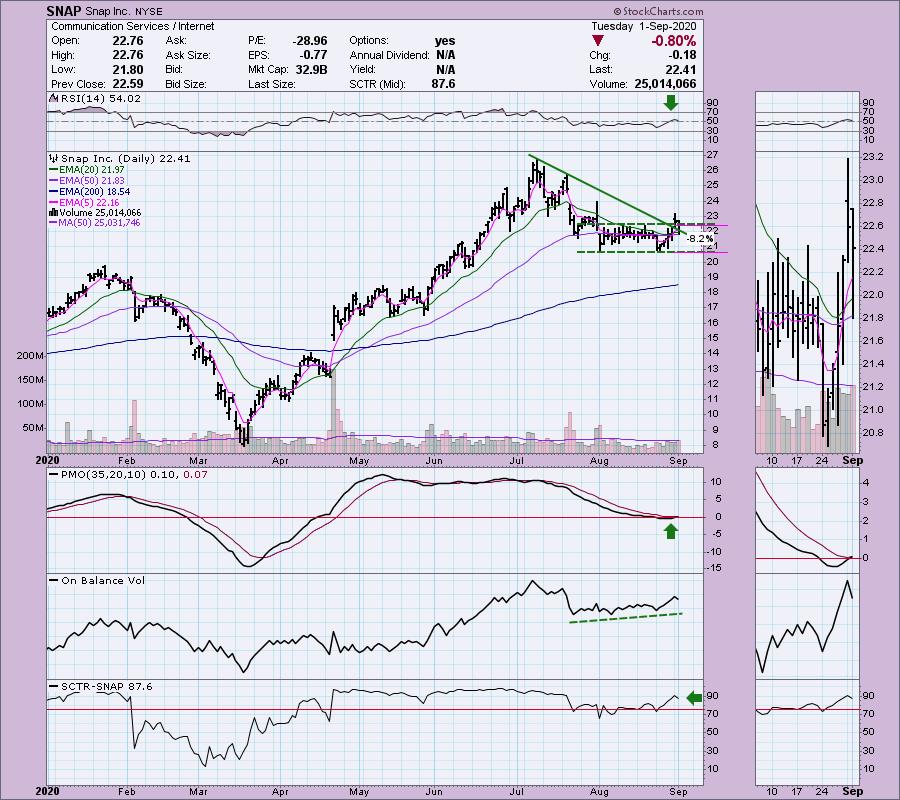
Down slightly (-0.05%) in after hours trading, SNAP broke out nicely yesterday, but pulled back today. It still closed above the consolidation zone and is holding above the declining tops trendline. We got the PMO BUY signal today and the RSI remains positive.
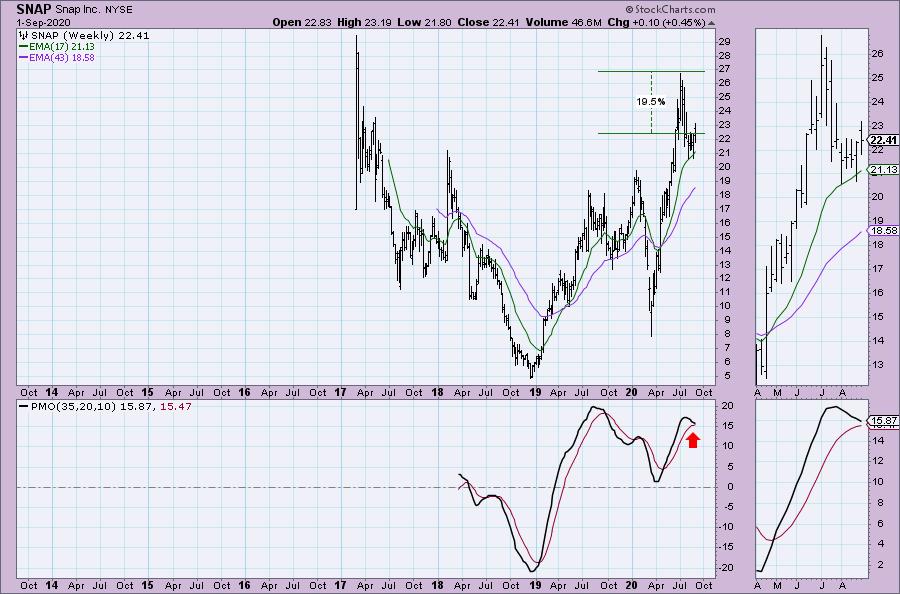
The weekly PMO has turned down in overbought territory. This would be another one to watch carefully. You can see in the thumbnail the bounce off the 17-week EMA.
2U Inc (TWOU) - Earnings: 10/29/2020 (AMC)
2U, Inc. engages in the provision of education technology for nonprofit colleges and universities. It operates through the following segments: Graduate Program and Alternative Credential. The Graduate Program segment provides technology and services to nonprofit colleges and universities to enable the online delivery of degree programs. The Alternative Credential segment provides premium online short courses and technical, skills-based boot camps through relationships with nonprofit colleges and universities. The company was founded by Christopher J. Paucek on April 2, 2008 and is headquartered in Lanham, MD.
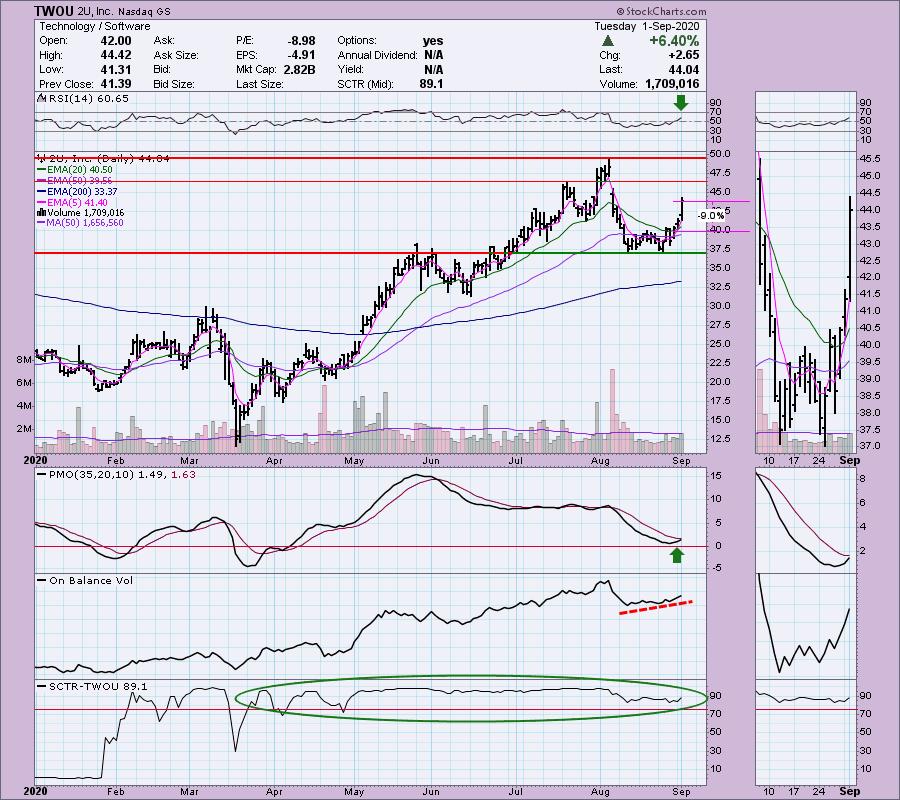
Up 0.93% in after hours trading, TWOU is ready to keep running. The PMO is approaching a BUY signal and the RSI has just moved into positive territory. The OBV is confirming the rally. I do want to see a breakout on the OBV along with price when we do see a move above the August top.
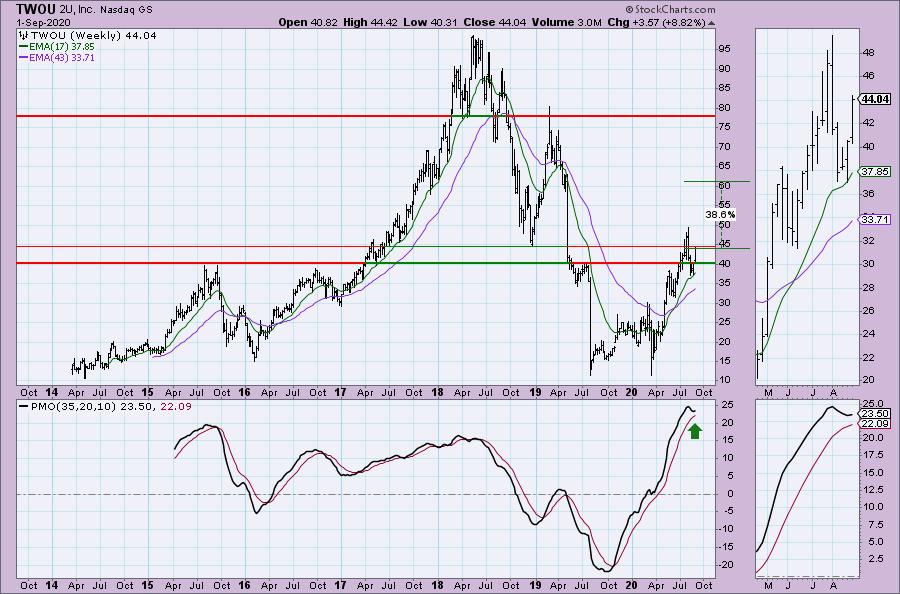
Thankfully, the weekly PMO has turned up above its signal line.
Current Market Outlook:
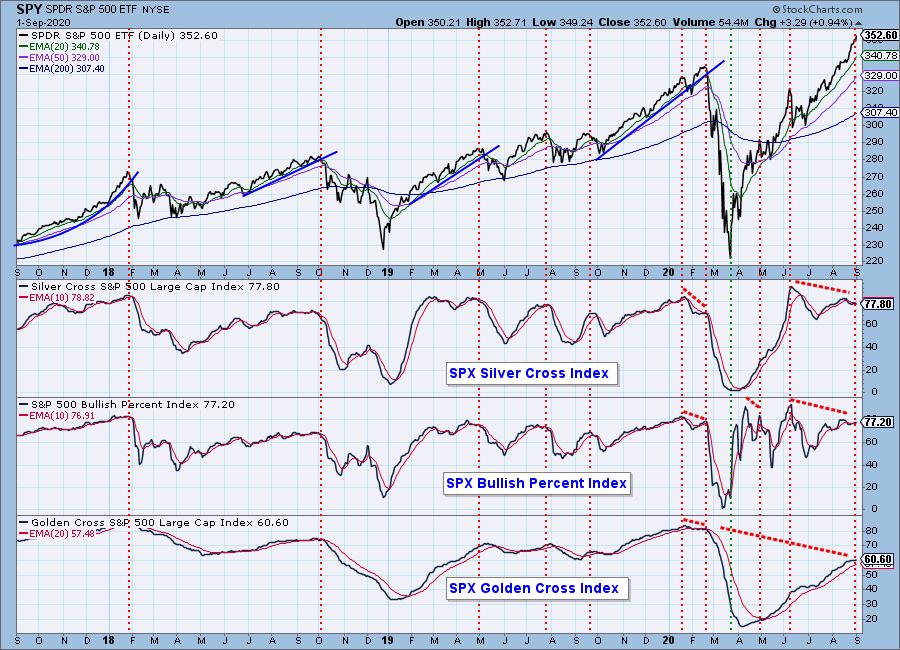
Market Environment: It is important to consider the odds for success by assessing the market tides. The following chart uses different methodologies for objectively showing the depth and trend of participation for intermediate- and long-term time frames.
- The Silver Cross Index (SCI) shows the percentage of SPX stocks on IT Trend Model BUY signals (20-EMA > 50-EMA)
- The Golden Cross Index (GCI) shows the percentage of SPX stocks on LT Trend Model BUY signals (50-EMA > 200-EMA)
- The Bullish Percent Index (BPI) shows the percentage of SPX stocks on Point & Figure BUY signals.
Don't forget that as a "Diamonds" member, you have access to our GCI/SCI curated ChartList on DecisionPoint.com. You'll find it under "Members Only" links on the left side on the Blogs and Links Page.
Here is the current chart:
Diamond Index:
- Diamond Scan Results: 17
- Diamond Dog Scan Results: 16
- Diamond Bull/Bear Ratio: 1.06
Full Disclosure: I'm about 70% invested right now and 30% is in 'cash', meaning in money markets and readily available to trade with.
Technical Analysis is a windsock, not a crystal ball.
Happy Charting!
- Erin
erin@decisionpoint.com
Watch the latest episode of DecisionPoint with Carl & Erin Swenlin on Mondays 7:00p EST or on the DecisionPoint playlist on the StockCharts TV YouTube channel here!
NOTE: The stocks reported herein are from mechanical trading model scans that are based upon moving average relationships, momentum and volume. DecisionPoint analysis is then applied to get five selections from the scans. The selections given should prompt readers to do a chart review using their own analysis process. This letter is not a call for a specific action to buy, sell or short any of the stocks provided. There are NO sure things or guaranteed returns on the daily selection of "diamonds in the rough."
Helpful DecisionPoint Links:
DecisionPoint Shared ChartList and DecisionPoint Chart Gallery
Price Momentum Oscillator (PMO)
Swenlin Trading Oscillators (STO-B and STO-V)
For more links, go to DecisionPoint.com!