
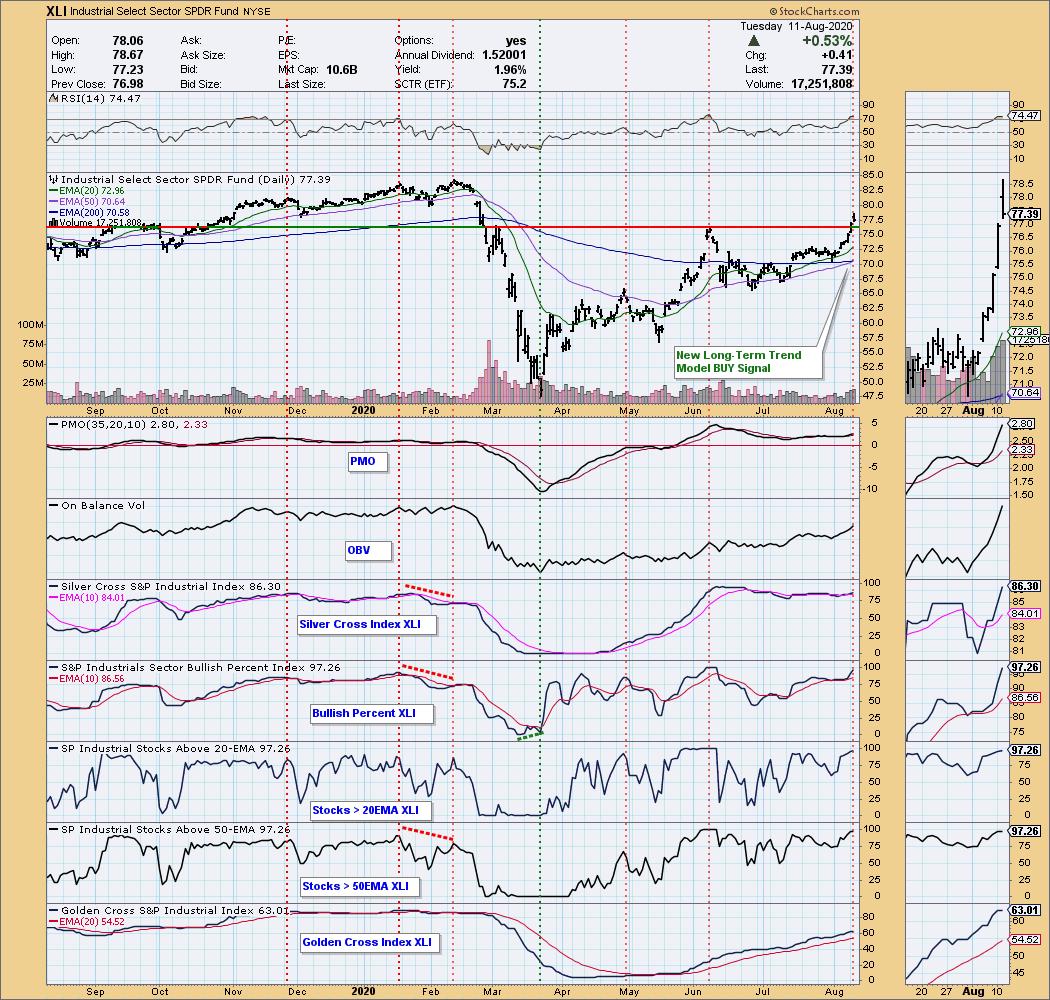
I think everyone has seen the Industrial SPDR (XLI) chart quite a bit from me, but I'm looking at it to start off today. I had quite a few Industrial stocks hit the scan results today and I have to say, Banks have been intriguing me lately. I'll share with you one of my holdings (prior Diamond from 7/21 Report) as well as a Bank ETF that I've been in and out of, but am considering reentering this week. I'd like to give a shout out to our new subscribers out there! As of late I have been letting subscribers know that I am using trailing stops on my own positions given the negative divergences I'm seeing on the index charts. I want to be protected from a correction which is entirely possible near-term.
Next Friday (8/21) the "Diamond Mine" trading room will begin at 12p EST. I'll be sending the link out to all Diamond members next Wednesday. Can't wait to chat with you in this very intimate trading room!
XLI's RSI is now very overbought so we want to be careful here. I'm happy to report that the 50-EMA just crossed above the 200-EMA to generate a LT Trend Model BUY signal. The indicators are all looking great except the RSI. However, we know that the RSI can maintain overbought conditions in a bull market and oversold conditions can persist with a bearish market bias. I like that we saw a breakout and trading completely above resistance at the June top.
** PRICES ARE GOING UP! **
You do NOT need to concern yourself if you're happy with what you have. Your current rate will stay the same as long as your subscription remains in good standing. You can also switch to an annual subscription at anytime where you pay for 10 months and get 12 months.
For our DP Diamond-only subscribers: You should consider our Bundle package. DP Alert Reports will be going up 33% to $40/mo so adding DP Alert later will be more expensive. Bundles currently are $50/mo or $500/yr.
If you add DP Alert after August 16th, it will cost you an additional $40/mo or $400/yr for a Bundle total of $65/mo or $650/yr after August 16th!
To summarize, if you don't have the Bundle, subscribe now before it becomes very expensive!
For my Diamonds subscribers, there will be a new 1-hour trading room, "The DecisionPoint Diamond Mine" on Fridays beginning 8/21! It will be an opportunity for us to talk live, review current and past Diamonds for possible entries/exits/stops/targets and take your questions and symbol requests in this intimate trading room. But wait, there's more for Diamonds subscribers! I will be adding a Friday Diamonds Recap where I will look at the performance of that week's Diamonds and their prospects moving forward. Over the weekend we clean the slate and start over again.

Welcome to DecisionPoint Daily Diamonds, wherein I highlight five "diamonds in the rough." These are selected from the results of my DecisionPoint scans, which search for stocks that could benefit from the trend and condition of the market. Remember, these are not recommendations to buy or sell, but are the most interesting of the stocks that surfaced in my scans. My objective is to save you the work of the initial, tedious culling process, but you need to apply your own analysis to see if these stocks pique your interest as well. There are no guaranteed winners here!
ASGN Inc (ASGN) - Earnings: 10/21/2020 (AMC)
ASGN, Inc. engages in the business of information technology (IT) and professional services in the technology, digital, creative, engineering and life sciences fields across commercial and government sectors. It operates through the following segments: Apex, Oxford, and ECS. The Apex segment provides technical, scientific, digital, and creative services and solutions to Fortune 1000 and mid-market clients across the United States and Canada. The Oxford segment offers "hard to find" technical, digital, engineering, and life sciences services and solutions in select skill and geographic markets. The ECS segment delivers advanced solutions in cloud, cybersecurity, artificial intelligence, machine learning, software development, IT modernization, and science and engineering primarily focused on Federal Government activities. ASGN helps corporate enterprises and government organizations develop, implement and operate critical IT and business solutions through its integrated offering of professional staffing and IT solutions.
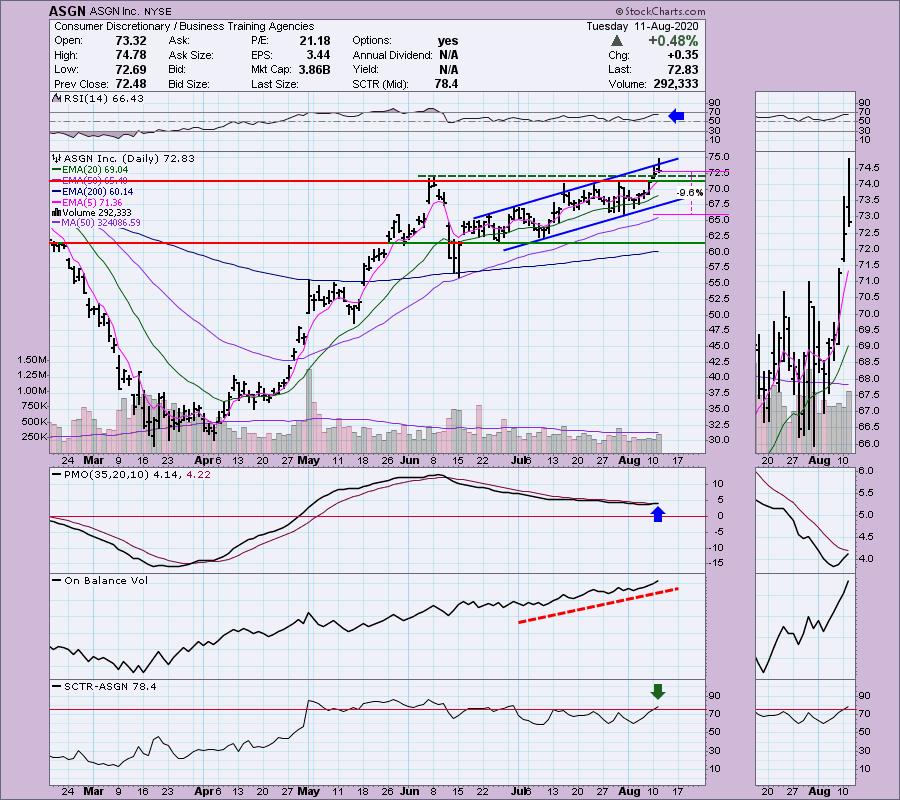
This of course isn't an industrial but I found it to be such a great chart, I had to include it. The RSI is positive and above net neutral (50), The OBV is confirming the uptrend. ASGN has been in a rising trend channel since the beginning of July. The PMO tracked lower while price was rising. That's not a bad thing, it has now cleared overbought conditions and is ready to give us a BUY signal above the zero line. Also I note that the SCTR has just reached the "hot zone" above 75. Price broke out above resistance yesterday and continued higher today. Main negative for me--I'm not thrilled with price closing near the bottom of the range today.
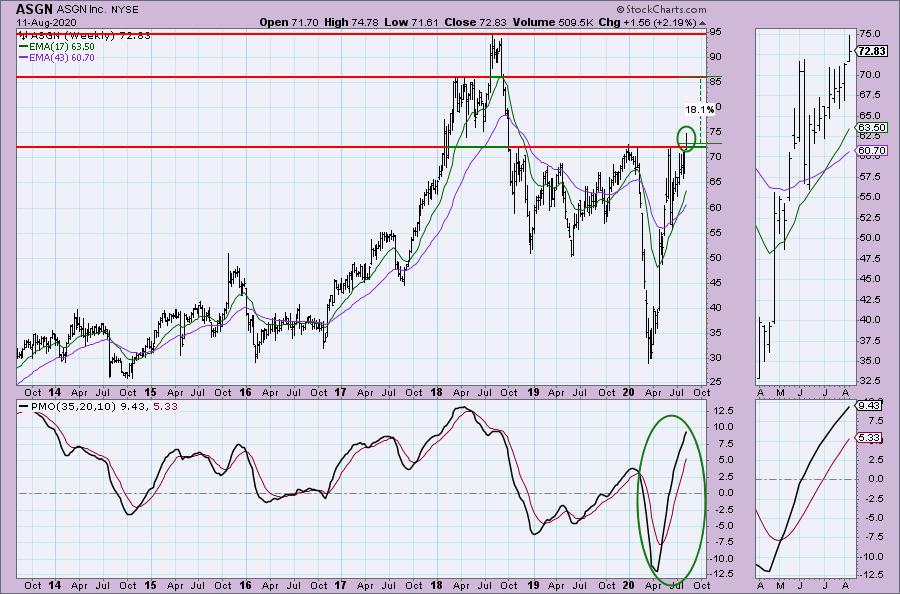
I really like this weekly chart. I think a conservative upside target would be around $85 or $86, but it certainly could move higher.
Armstrong World Industries Inc (AWI) - Earnings: 10/26/2020 (BMO)
Armstrong World Industries, Inc. engages in the design, manufacture, and trade of commercial and residential ceiling, wall, and suspension system solutions. It operates through the following segments: Mineral Fiber, Architectural Specialties and Unallocated Corporate. Mineral Fiber segment produces suspended mineral fiber and soft fiber ceiling systems for use in commercial and residential settings. Architectural Specialties segment roduces and sources ceilings and walls for use in commercial settings. Unallocated Corporate segment includes assets, liabilities, income and expenses that have not been allocated to other business segments.
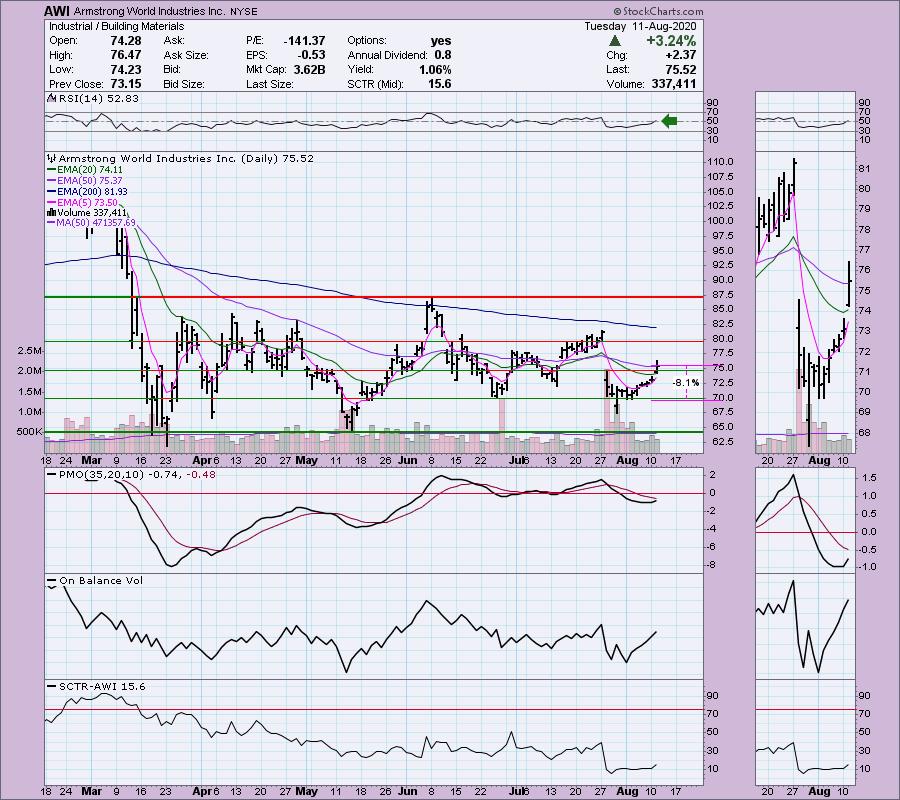
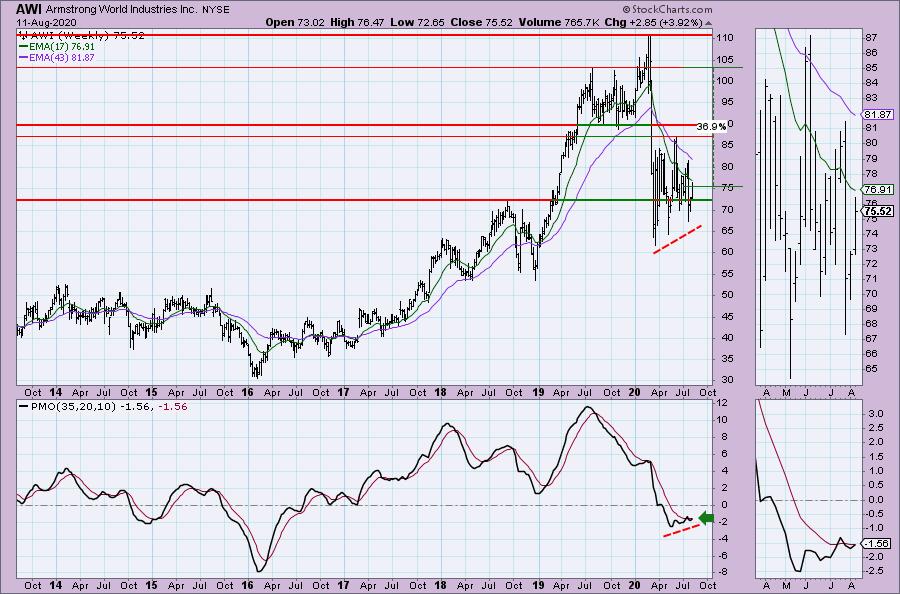
I like this industrial on the breakout today that is likely beginning the move to close the gap formed at the end of July. The PMO has swung higher in oversold territory and the RSI just went positive. An 8% stop would put you just below support at the June low.
The weekly PMO is trying to trigger a new crossover BUY signal. Upside potential I'm looking for is a move to the 2019 tops, but I must say that resistance around $90 could be a little tricky.
Don't forget, on Thursdays I look at reader-requested symbols, so shoot me an email at erin@decisionpoint.com. I read every email I receive and try to answer them all!
CSX Corp (CSX) - Earnings: 10/14/2020 (AMC)
CSX Corp. engages in the provision of rail-based freight transportation services. Its services include rail service, the transport of intermodal containers and trailers, rail-to-truck transfers and bulk commodity operations.
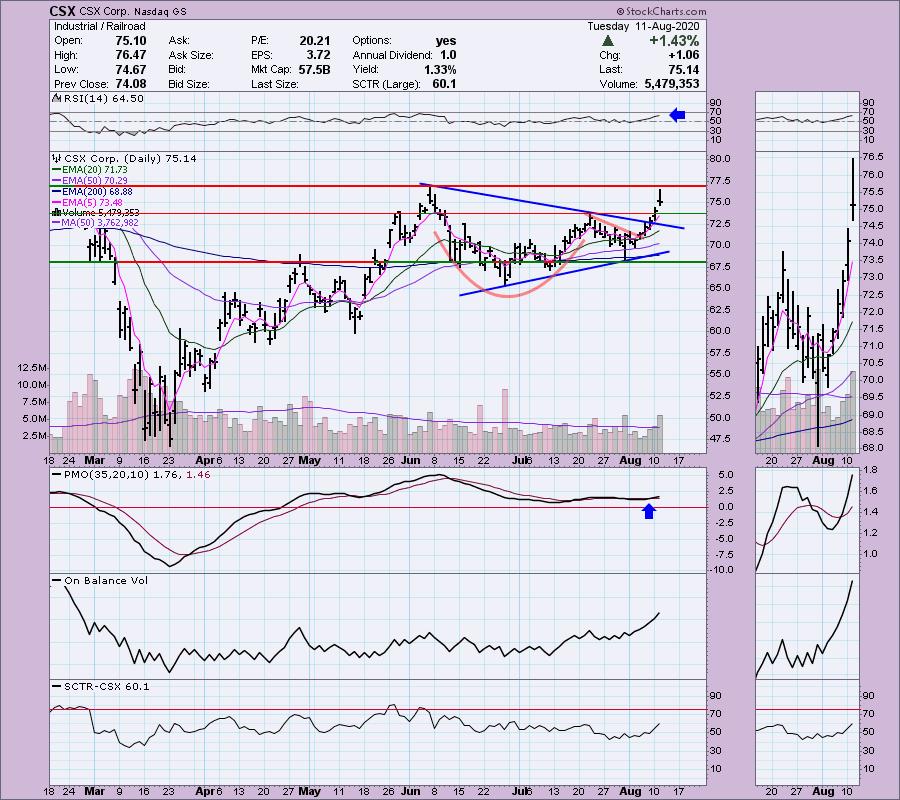
I wish I'd gotten a Railroad out there for my readers sooner. I noticed during the WealthWise Women taping that Railroads were beginning to look interesting. On CSX we have a cup and handle that executed as expected to the upside. The pattern would suggest price will breakout above the June top and move higher. The RSI is not overbought and the PMO just recently had a crossover BUY signal. Volume is definitely coming in on this rally.
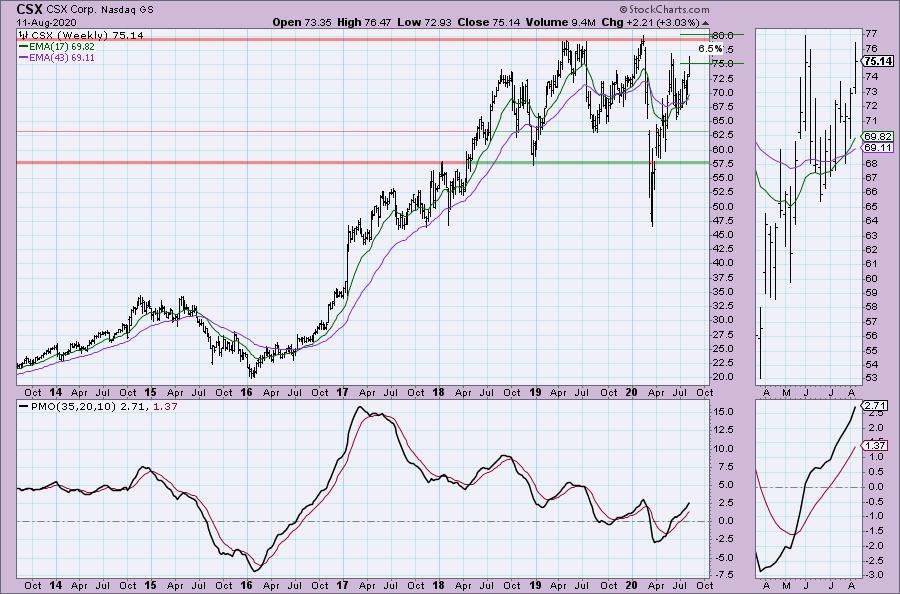
Upside potential as far as reaching all-time highs isn't spectacular, but I suspect a breakout to new all-time highs is coming given the very positive PMO configuration and the recent 17-week/43-week EMA positive crossover.
SPDR S&P Regional Banking ETF (KRE) - Earnings: N/A
KRE tracks an equal-weighted index of US regional banking stocks.
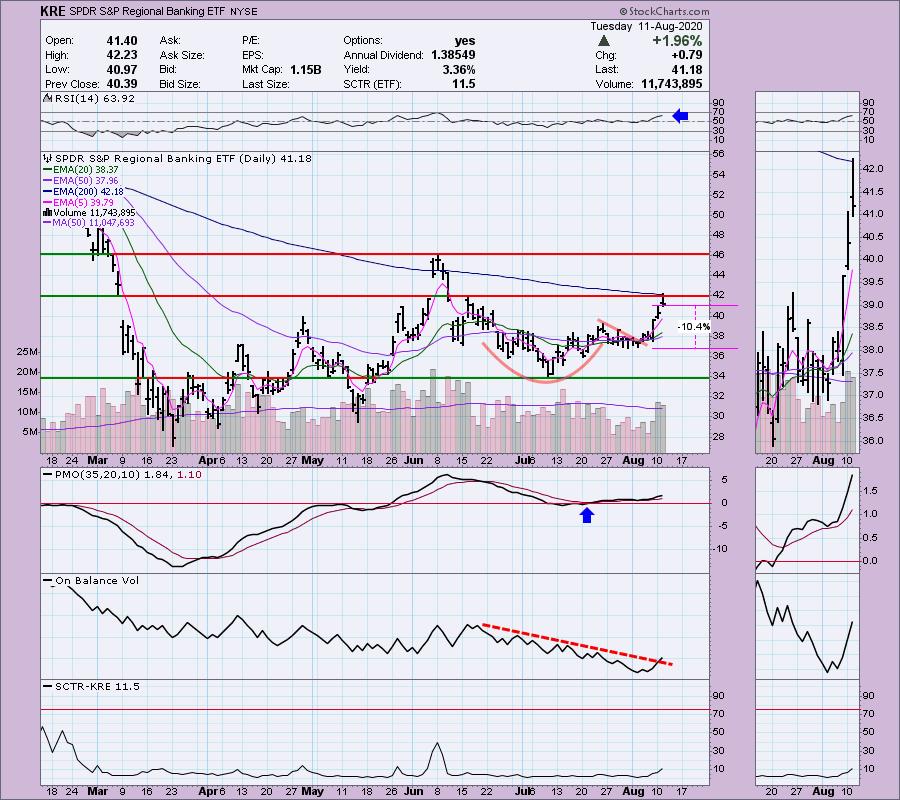
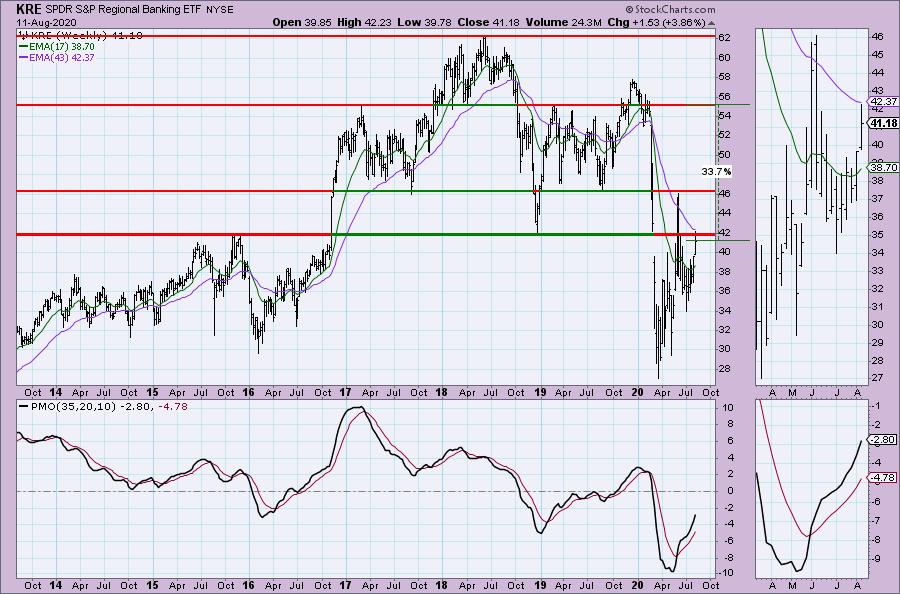
The bank stocks have been breaking out so I decided to look at the Regional Banking ETF, KRE. I do like it but we are at strong overhead resistance at the 200-EMA and June gap resistance. The RSI looks very good and the PMO is on a BUY signal. Additionally it formed a bottom above its signal line which is usually especially bullish. I do have issues with the OBV declining, but we do see a spike to the upside given the high volume of the past three trading days. I might wait on this for the actual breakout to occur or wait for an entry closer to $40. The stop area I have is under the 20/50-EMAs and lined up with recent short-term support.
Overhead resistance is stronger than I had originally thought given the 2018 low and 2015 high match up with the 2020 gap resistance. That gap was closed this week and we saw a tiny breakout above that resistance. The PMO is very positive and certainly suggests more upside to come.
PNC Financial Services Gr (PNC) - Earnings: 10/14/2020 (BMO)
PNC Financial Services Group, Inc. is a holding company, which engages in the provision of financial services. It operates through the following segments: Retail Banking, Corporate & Institutional Banking, Asset Management Group, and BlackRock. The Retail Banking segment offers deposit, lending, brokerage, investment management, and cash management products and services to consumer and small business customers. The Corporate & Institutional segment covers the lending, treasury management, and capital markets-related products and services to mid-sized and large corporations, government, and not-for-profit entities. The Asset Management Group segment includes personal wealth management for high net worth and ultra high net worth clients and institutional asset management. The BlackRock segment operates as a publicly-traded investment management firm providing a range of investment, risk management and technology services to institutional and retail clients.
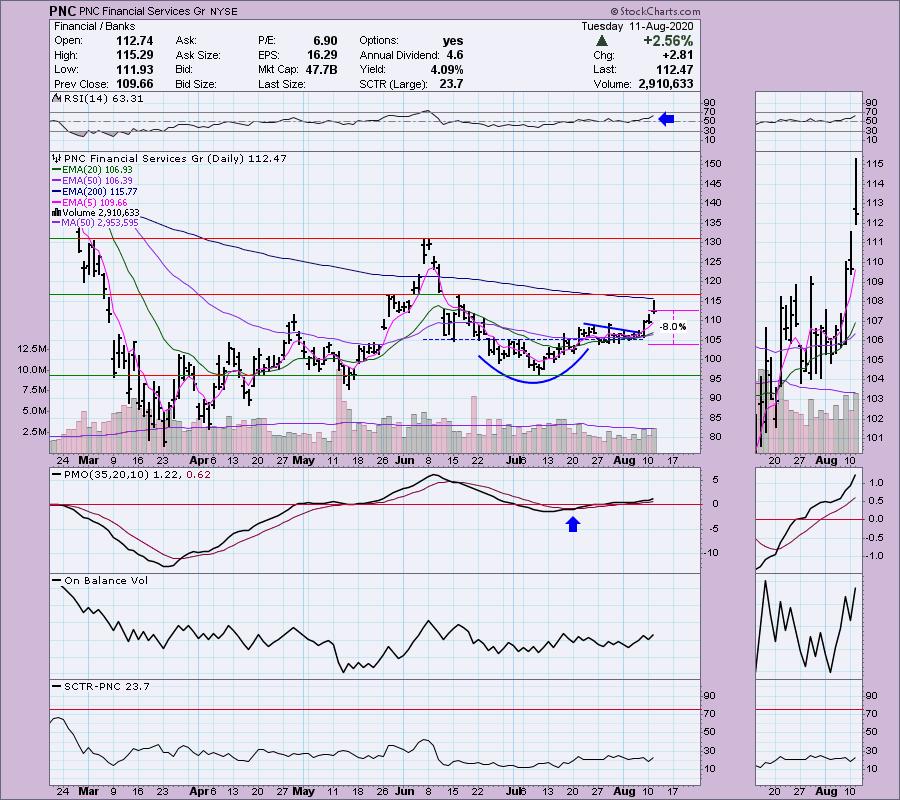
This a Diamond I presented on July 21st. I bought it the next day. Well it hasn't done much since I purchased it. However, it did form a cup and handle and we are now seeing the breakout that could be executing this pattern. The RSI is positive and the PMO is on a BUY signal. Like KRE above, the 200-EMA is the issue. I need to see that broken. My stop is trailing but basically is set where this one is, just below support at the late July bottoms.
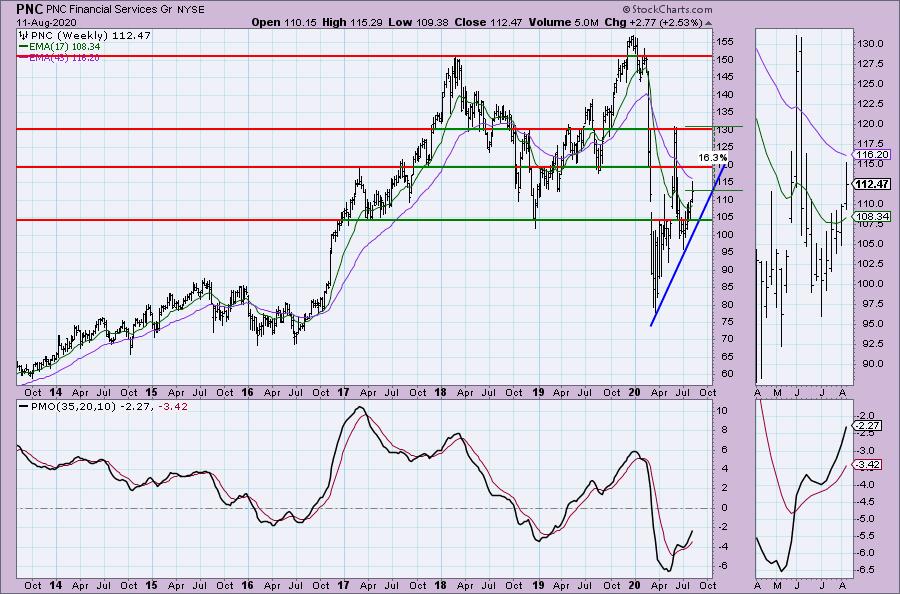
The weekly chart is still looking positive. My upside target is the $130 level, but I suspect if resistance is overcome at $130, it will continue higher.
Current Market Outlook:
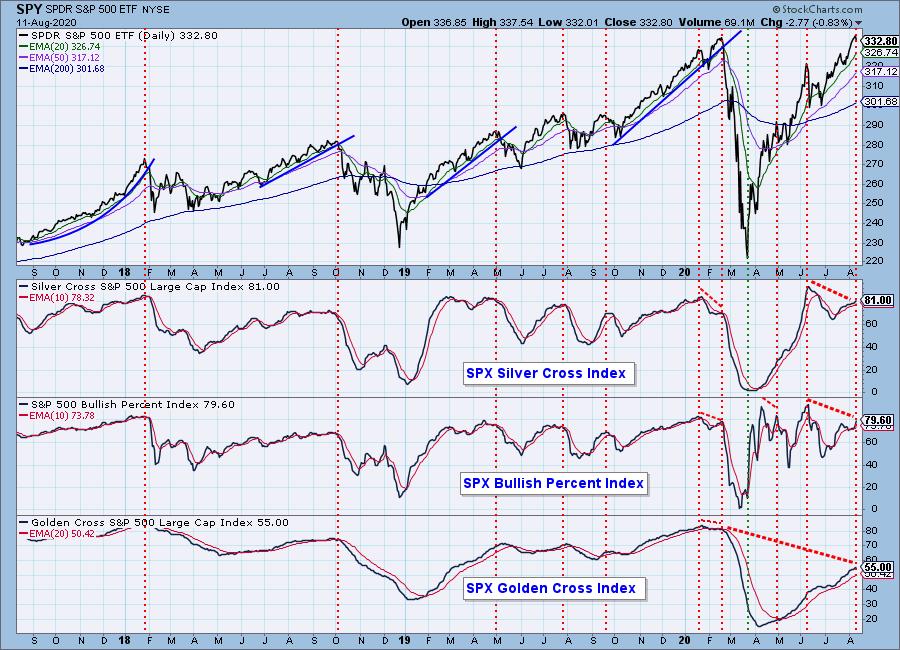
Market Environment: It is important to consider the odds for success by assessing the market tides. The following chart uses different methodologies for objectively showing the depth and trend of participation for intermediate- and long-term time frames.
- The Silver Cross Index (SCI) shows the percentage of SPX stocks on IT Trend Model BUY signals (20-EMA > 50-EMA)
- The Golden Cross Index (GCI) shows the percentage of SPX stocks on LT Trend Model BUY signals (50-EMA > 200-EMA)
- The Bullish Percent Index (BPI) shows the percentage of SPX stocks on Point & Figure BUY signals.
Don't forget that as a "Diamonds" member, you have access to our GCI/SCI curated ChartList on DecisionPoint.com. You'll find it under "Members Only" links on the left side on the Blogs and Links Page.
Here is the current chart:
Diamond Index:
- Diamond Scan Results: 3
- Diamond Dog Scan Results: 3
- Diamond Bull/Bear Ratio: 0.00
Full Disclosure: I'm about 65% invested right now and 25% is in 'cash', meaning in money markets and readily available to trade with. I'm considering a few different positions, but honestly, I am feeling iffy about the market right now and don't want to be overexposed. As noted above all but two positions in my portfolio have been on trailing stops for 2 weeks and I am considering closing a few positions.
Technical Analysis is a windsock, not a crystal ball.
Happy Charting!
- Erin
erin@decisionpoint.com
ANNOUNCEMENT:
I have the information for my VIRTUALpresentation at The Money Show! My presentation will on August 19th at 1:20p EST! Click here for information on how to register to see me!

Watch the latest episode of DecisionPoint with Carl & Erin Swenlin on Thursdays 8:00a EST or on the DecisionPoint playlist on the StockCharts TV YouTube channel here!
NOTE: The stocks reported herein are from mechanical trading model scans that are based upon moving average relationships, momentum and volume. DecisionPoint analysis is then applied to get five selections from the scans. The selections given should prompt readers to do a chart review using their own analysis process. This letter is not a call for a specific action to buy, sell or short any of the stocks provided. There are NO sure things or guaranteed returns on the daily selection of "diamonds in the rough."
Helpful DecisionPoint Links:
DecisionPoint Shared ChartList and DecisionPoint Chart Gallery
Price Momentum Oscillator (PMO)
Swenlin Trading Oscillators (STO-B and STO-V)
For more links, go to DecisionPoint.com!