
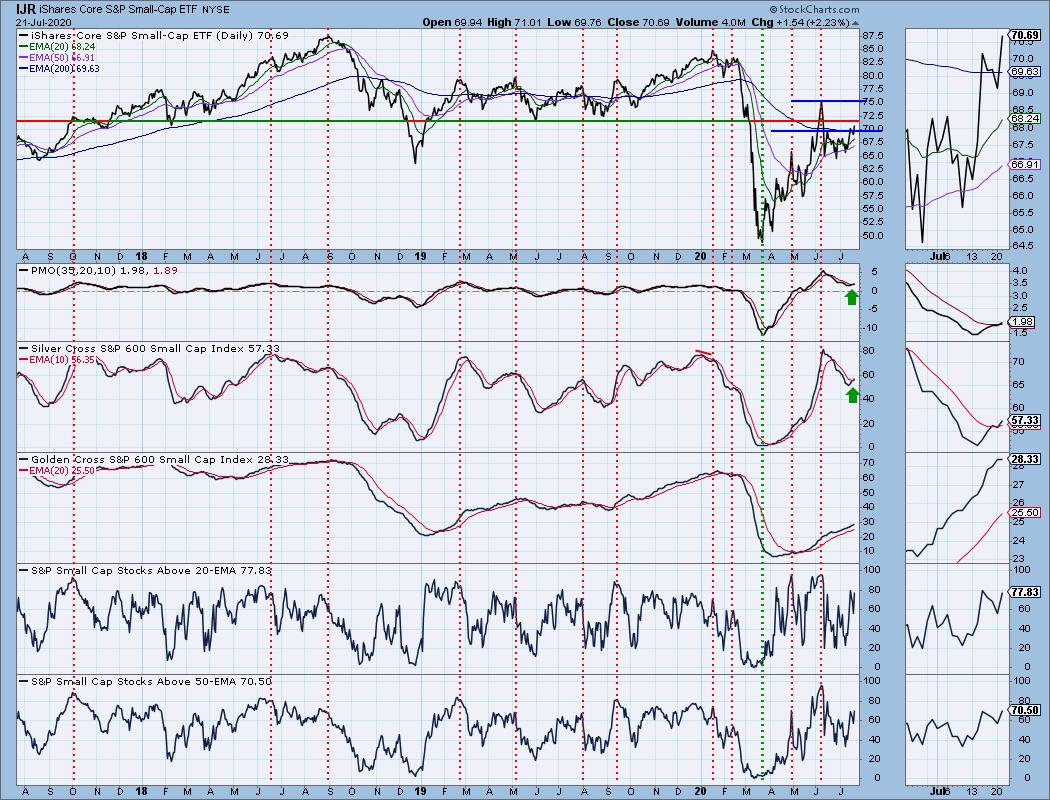
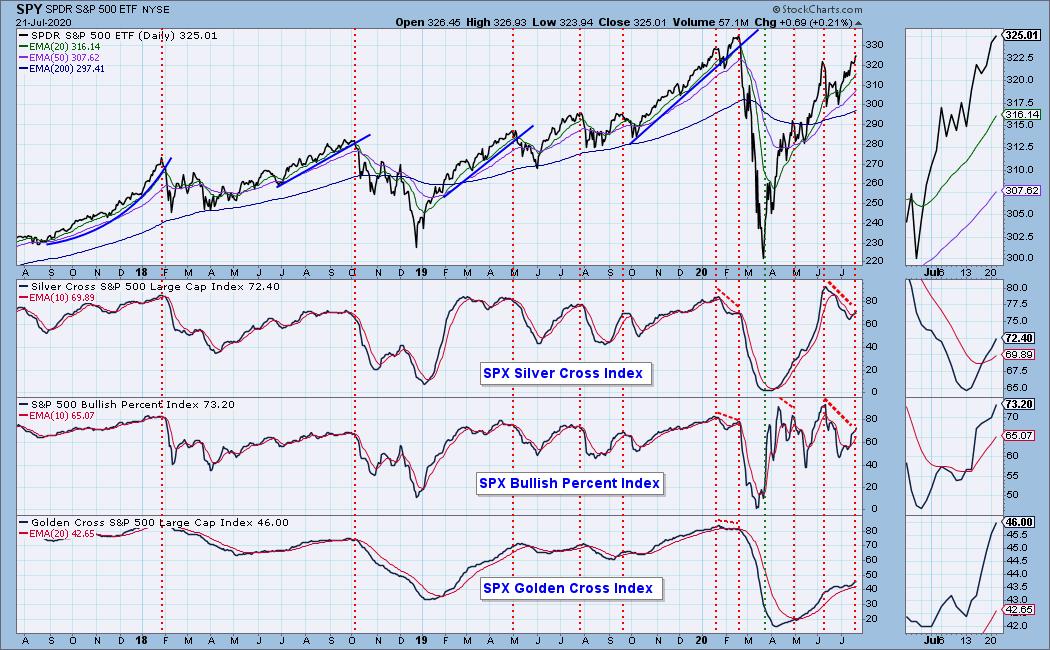
I've noticed that small-caps are beginning to perform and breakout. We just got a new PMO BUY Signal on the SP600 ETF (IJR). You'll also notice that the Silver Cross Index is back above its signal line. There's still plenty of room for improvement, but it makes me wonder if money is flowing out of large-cap Technology (Nasdaq floundering) and now is flowing into the small-cap companies. I have a mixed bag of diamonds in the rough today. I did purposely select three small-cap companies. I found some nice short-term set-ups and a few longer-term set-ups based on the weekly charts. I've noticed that Banks are showing up on my scans so I picked a large-cap bank with very positive daily/weekly charts.
Welcome to DecisionPoint Daily Diamonds, wherein I highlight five "diamonds in the rough." These are selected from the results of my DecisionPoint scans, which search for stocks that could benefit from the trend and condition of the market. Remember, these are not recommendations to buy or sell, but are the most interesting of the stocks that surfaced in my scans. My objective is to save you the work of the initial, tedious culling process, but you need to apply your own analysis to see if these stocks pique your interest as well. There are no guaranteed winners here!
American Software Inc (AMSWA) - Earnings: 8/26/2020 (AMC)
American Software, Inc. engages in the development and marketing of supply chain management and enterprise software solutions. It operates through the following segments: Supply Chain Management (SCM), Information Technology (IT) Consulting, and Other. The SCM segment offers supply chain optimization and retail planning solutions. The IT Consulting segment provides software enhancements, documentation, updates, customer education, consulting, systems integration services, maintenance, and support services. The Other segment involves the purchasing and materials management, customer order processing, financial, e-commerce, and traditional manufacturing solutions.
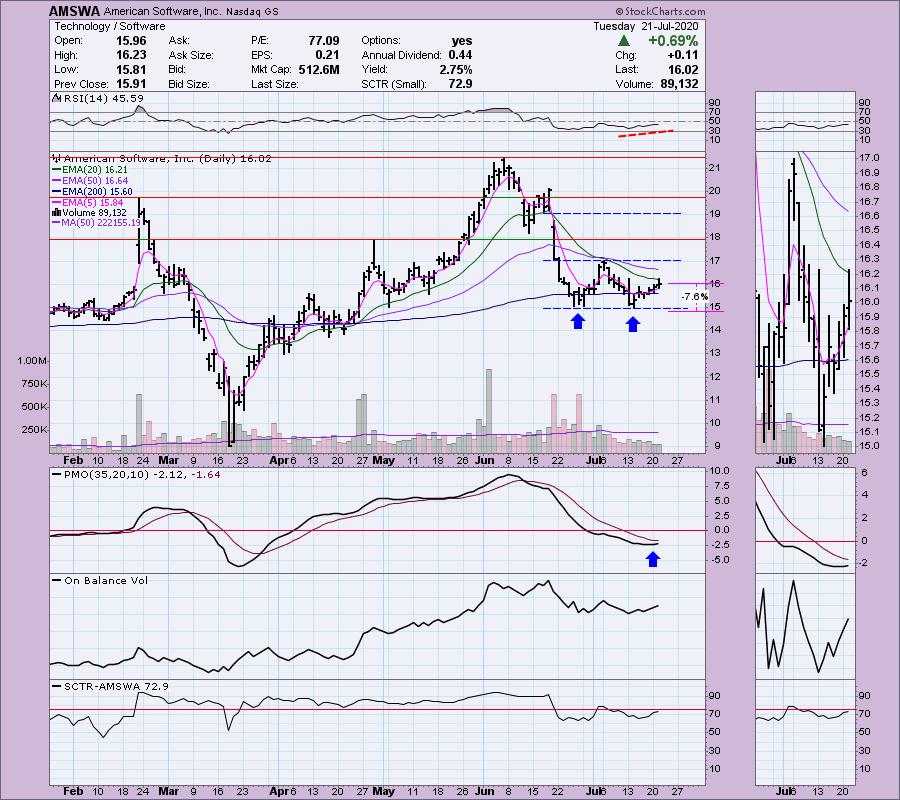
This one came up on "Carl's Scan" which gives us bottom fishing opportunities on very beat down stocks. I don't have a volume or price restriction in the scan so some of them will come in very low priced and very liquid with low volume numbers. I would put this one in the higher risk category as looking at both the daily and weekly charts, the daily chart is very bullish, but the weekly chart isn't. Risk/reward is good so it seems a good candidate. The stop level can be set at less than 8% which I always find a plus. If it got to the June top, that would be an over 30% gain and I think that is doable in the short term. We have a beautiful double-bottom pattern forming. The RSI is moving up, although negative. The PMO is just starting to turn up so we could be getting in on something early here.
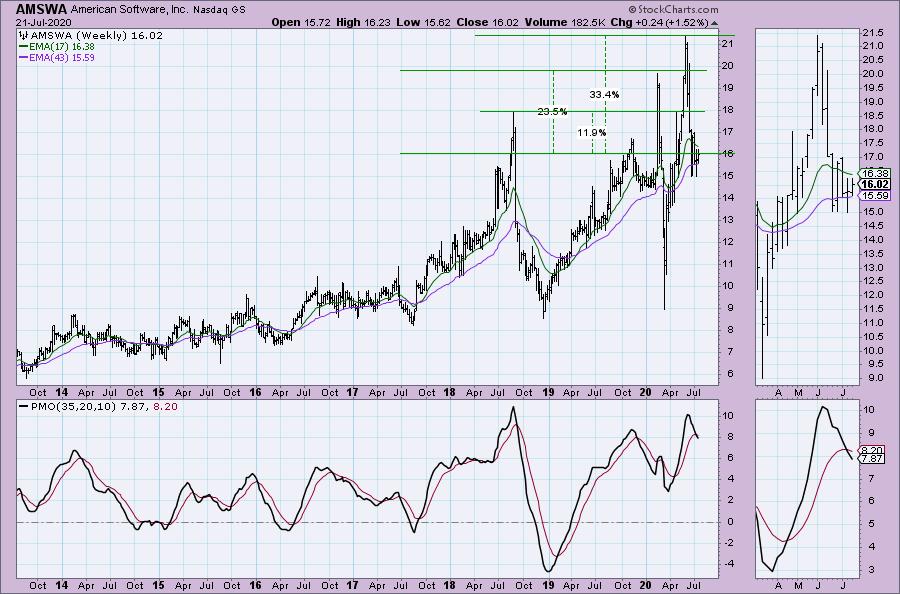
But...as I said, the weekly chart doesn't look that great with the new weekly PMO SELL signal so I would bail quickly if it doesn't immediately go the way we want.
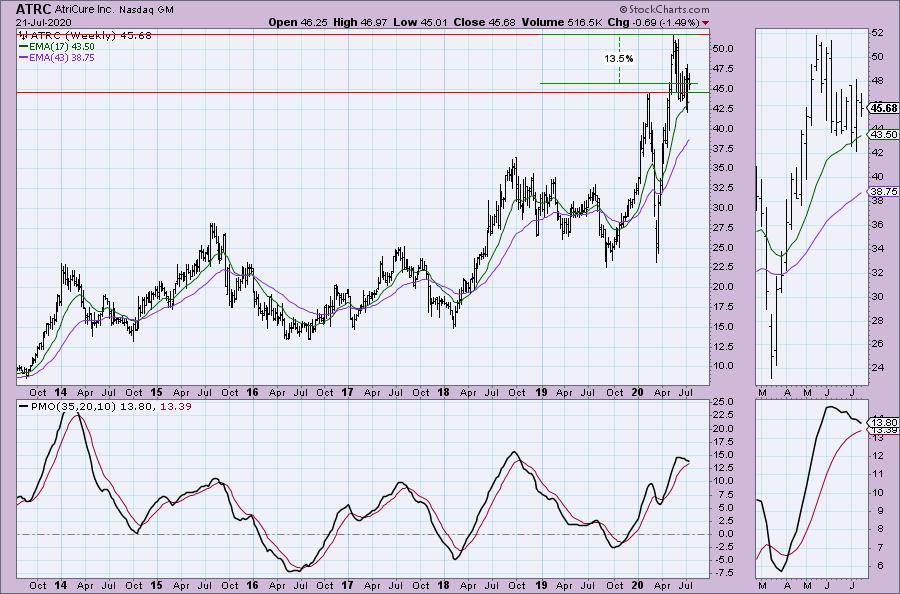
AtriCure Inc (ATRC) - Earnings: 7/28/2020 (AMC)
AtriCure, Inc. engages development, manufacture and sale of devices designed primarily for the surgical ablation of cardiac tissue, and systems for the exclusion of the left atrial appendage. Its products include radio Frequency (RF) ablation pacing and sensing, cryo, left atrial appendage management, soft tissue dissection, estech surgical instrumentation, and cart configuration. It operates through the following geographical segments: United States, Europe, Asia, Other International, and Total International.
IJH is the SP400 ETF and it also garnered a new PMO BUY signal, so here is a mid-cap possibility. The dominant pattern is a bullish falling wedge. The PMO has nearly crossed over its signal line. There is a beautiful positive divergence between the OBV and price lows that suggests a breakout to me. The RSI is holding up in positive territory above net neutral (50).
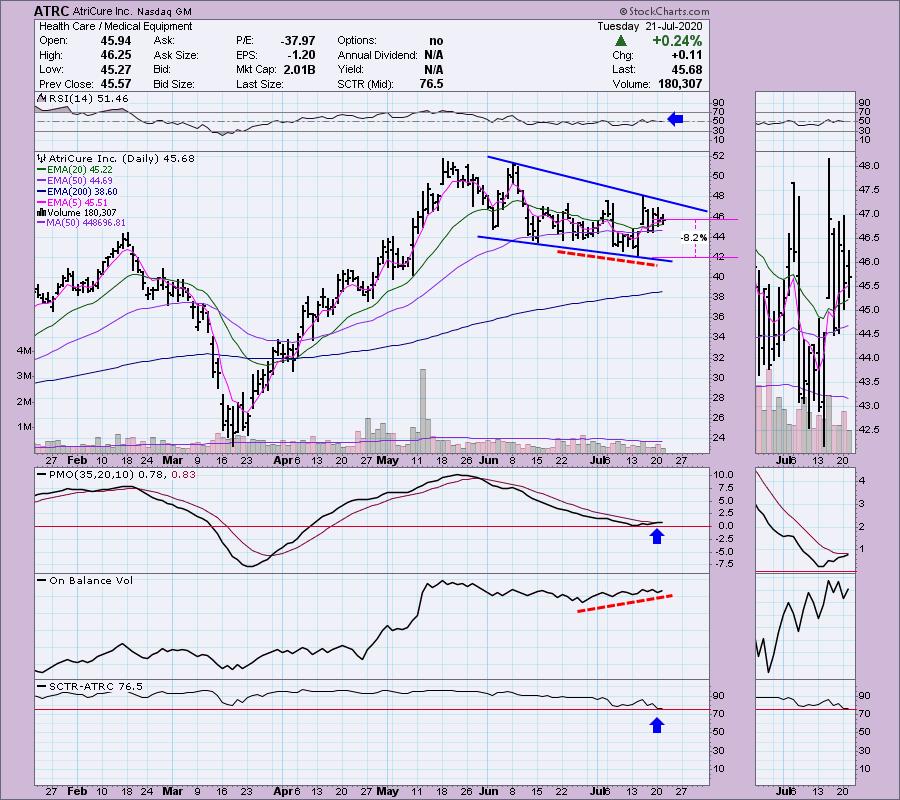
The weekly chart isn't so hot given the declining weekly PMO, but support isn't far.
Don't forget, on Thursdays I look at reader-requested symbols, so shoot me an email at erin@decisionpoint.com. I read every email I receive and try to answer them all!
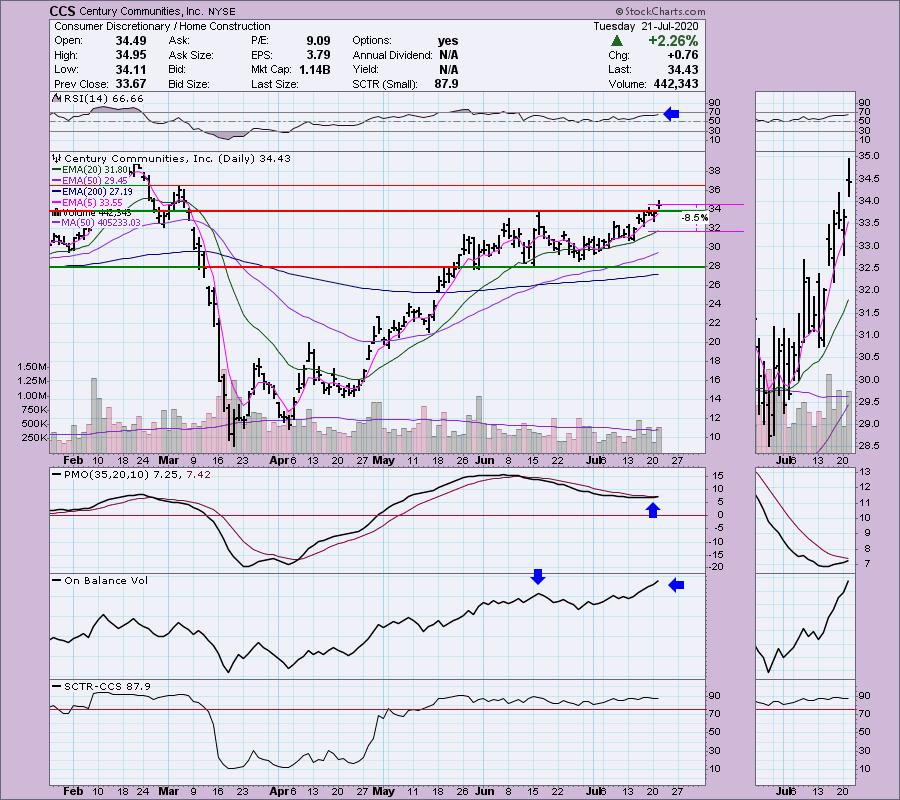
Century Communities Inc (CCS) - Earnings: 7/28/2020 (AMC)
Century Communities, Inc. engages in the development, design, construction, marketing and sale of single-family attached and detached homes. It operates through the following business segments: West, Mountain, Texas, Southeast, and Wade Jurney Homes. The West segment refers to Southern California, Central Valley, Bay Area and Washington. The Mountain segment represents Colorado, Nevada and Utah. The Texas segment is comprised of Houston, San Antonio and Austin. The Southeast segment is consisting of Georgia, North Carolina, South Carolina and Tennessee. The Wade Jurney Homes segment is consist of Alabama, Arizona, Florida, Georgia, Indiana, North Carolina, Ohio, South Carolina, and Tennessee.
I wrote about Home Construction industry group yesterday and the strength that it is showing. I liked this small-cap home builder. The PMO is about to give us a BUY signal. Price just broke out and closed above overhead resistance. The RSI is positive and the OBV broke out along with price. The SCTR is in the "hot zone" above 75.
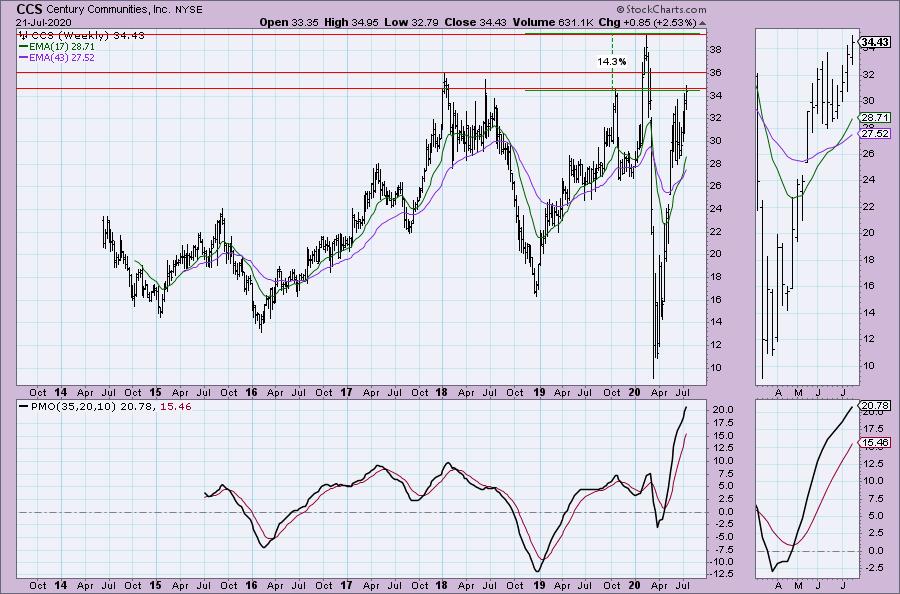
Much healthier weekly chart for CCS. Upside potential is over 14%.
PNC Financial Services Grp (PNC) - Earnings: 10/14/2020 (BMO)
PNC Financial Services Group, Inc. is a holding company, which engages in the provision of financial services. It operates through the following segments: Retail Banking, Corporate & Institutional Banking, Asset Management Group, and BlackRock. The Retail Banking segment offers deposit, lending, brokerage, investment management, and cash management products and services to consumer and small business customers. The Corporate & Institutional segment covers the lending, treasury management, and capital markets-related products and services to mid-sized and large corporations, government, and not-for-profit entities. The Asset Management Group segment includes personal wealth management for high net worth and ultra high net worth clients and institutional asset management. The BlackRock segment operates as a publicly-traded investment management firm providing a range of investment, risk management and technology services to institutional and retail clients.
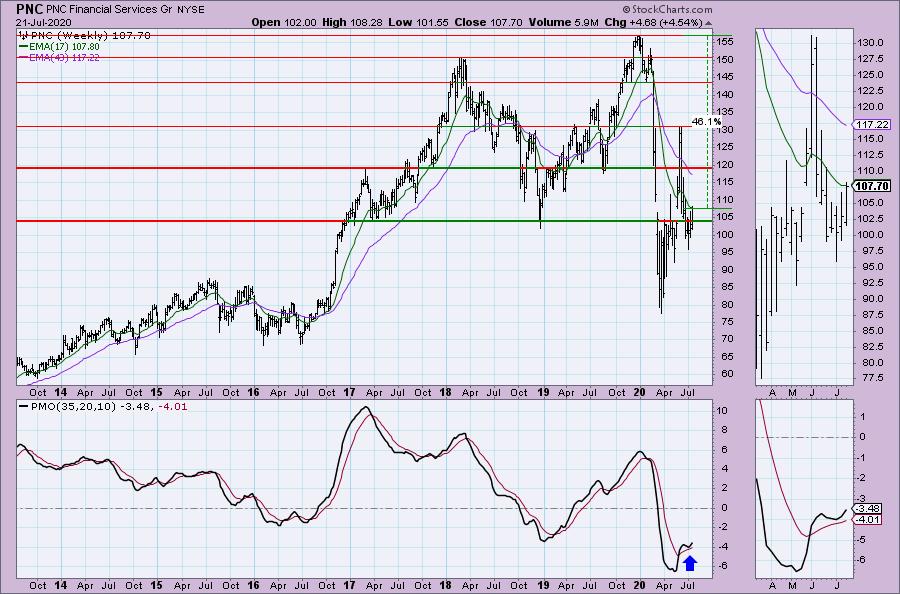
Although this one is down about 0.48% in after hours trading, I like this one. I believe a decline toward the breakout point would be constructive and give us a better entry. The PMO just triggered a new BUY signal on the crossover. The RSI is positive and OBV seems to be confirming the new rising trend. Saucer shaped bottoms are generally seen before strong upside reversals.
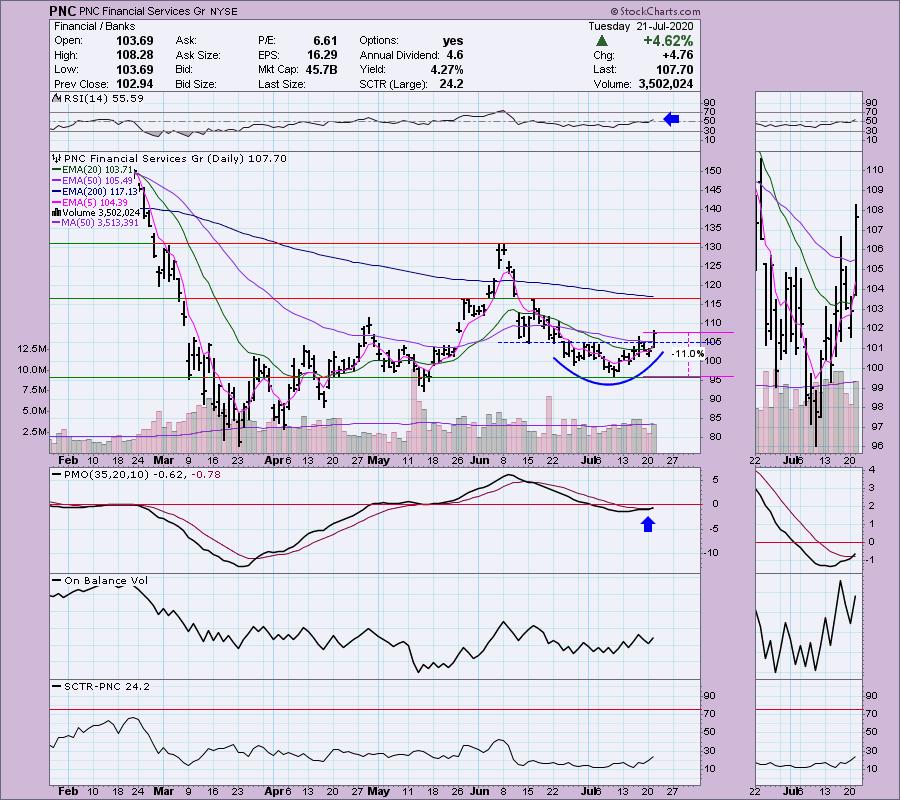
The weekly chart on PNC is probably the strongest of all Diamonds today with a weekly PMO that has bottomed above its signal line. It is far from overbought and upside potential is excellent.
Sharps Compliance Corp (SMED) - Earnings: 8/19/2020 (BMO)
Sharps Compliance Corp. engages in the provision of healthcare waste management services including medical, pharmaceutical, and hazardous. It focuses on developing management solutions for medical waste and unused dispensed medications generated by small and medium quantity generators.
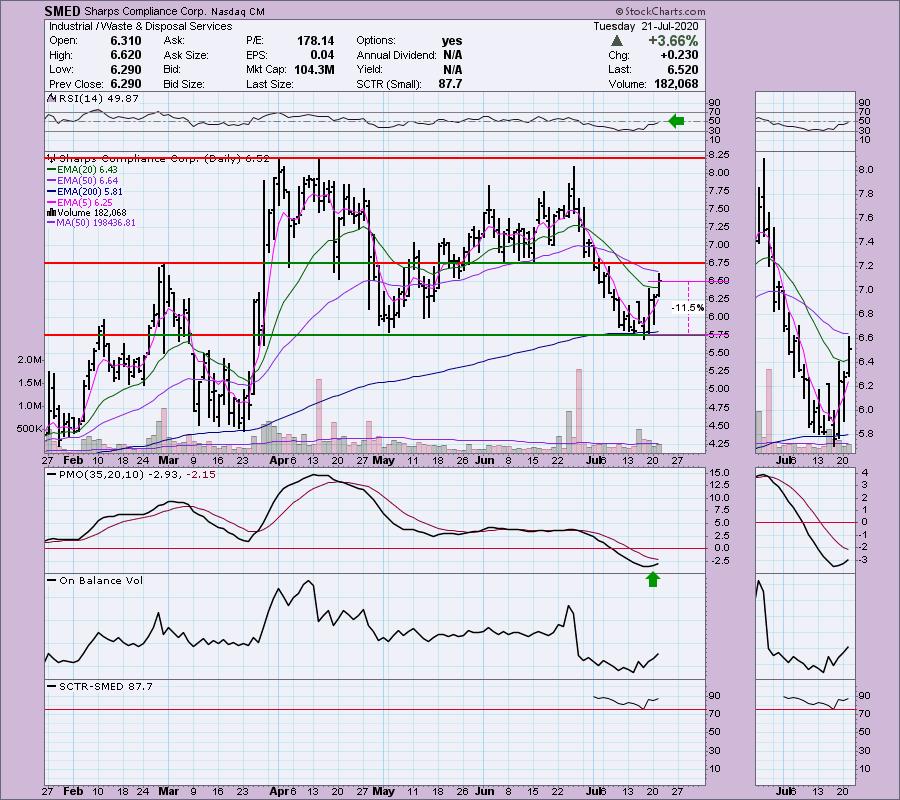
This stock is down about 0.28% in after hours trading. That's good since it had such a big gain today. The PMO is rising nicely in oversold territory and the RSI is just about in positive territory above 50. Volume is picking up on the OBV. Among its small-cap peers, SMED is in the top 13% based on the StockCharts Technical Rank (SCTR).
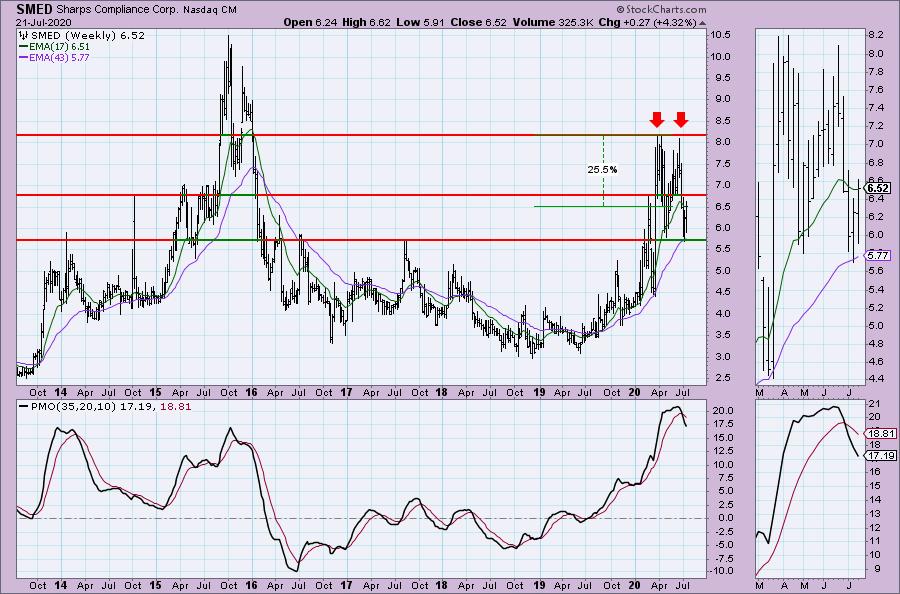
Unfortunately the weekly chart is pretty stinky which is why I would consider this a short-term investment. There's a double-top trying to form and the weekly PMO just generated a SELL signal. This is a low-priced stock so watch it closely and take profits if it starts to look shaky. This is a "virus" play given they are in the needle disposal business for smaller to mid-sized companies...I'm thinking CVS or grocery store pharmacies that will have a lot of sharps to dispose of when we get a vaccine. I don't know if that is true, just making conclusions based on the company description.
Current Market Outlook:
Market Environment: It is important to consider the odds for success. The Silver Cross Index measures the percentage of stocks on IT Trend Model BUY signals (20-EMA > 50-EMA), while the Golden Cross Index measures the percentage of stocks on LT Trend Model BUY signals (50-EMA > 200-EMA). Don't forget that as a "Diamonds" member, you have access to our GCI/SCI curated ChartList on DecisionPoint.com. You'll find it under "Members Only" links on the left side on the Blogs and Links Page. Here are the current percentages on the Silver and Golden Cross Indexes:
Diamond Index:
- Diamond Scan Results: 30
- Diamond Dog Scan Results: 3
- Diamond Bull/Bear Ratio: 10.00
Full Disclosure: I don't plan on adding any of the above stocks to my portfolio. No recent additions or subtractions to report. I'm about 65% invested right now. 35% is in 'cash', meaning in money markets and readily available to trade with.
Technical Analysis is a windsock, not a crystal ball.
Happy Charting!
- Erin
erin@decisionpoint.com
ANNOUNCEMENT:
The MoneyShow Las Vegas has been canceled "in person", but I will still be presenting during their video production. As soon as I have information, I will forward it! In the meantime, if you haven't already, click to get your free access pass!

Watch the latest episode of DecisionPoint with Carl & Erin Swenlin on Thursdays 8:00a EST or on the DecisionPoint playlist on the StockCharts TV YouTube channel here!
NOTE: The stocks reported herein are from mechanical trading model scans that are based upon moving average relationships, momentum and volume. DecisionPoint analysis is then applied to get five selections from the scans. The selections given should prompt readers to do a chart review using their own analysis process. This letter is not a call for a specific action to buy, sell or short any of the stocks provided. There are NO sure things or guaranteed returns on the daily selection of "diamonds in the rough."
Helpful DecisionPoint Links:
DecisionPoint Shared ChartList and DecisionPoint Chart Gallery
Price Momentum Oscillator (PMO)
Swenlin Trading Oscillators (STO-B and STO-V)
For more links, go to DecisionPoint.com!