
Looks like this might be a good time to revisit a few industry groups that I continue to see strength in based on my scan results. I do have a strong performer from a beat down sector and I am returning to a previous stock (and current holding of mine) that is lining up for possible reentry. A friend of mine that I met at two of our ChartCon events pointed out that if a weekly PMO is not rising, he believes there is only about a 50/50 chance the stock will go up in the short term. While I'm not so certain of the percentages, it is important to know what momentum looks like on a longer-term chart. It tells me the time horizon for the investment. If the daily chart looks fantastic but the weekly chart has declining momentum, I know that stock will require "babysitting" and should be considered a short-term investment. Right now with the volatility in the market, it is wise to consider all of your investments 'short-term' for the time being.
** Announcements **
I will be traveling July 1 - July 15. I will be writing on the road, but broadcasting will be suspended during that time. It's going to be an adventurous road trip for me and my husband. We will be taking a train from Los Angeles to New Orleans, visiting family, checking out retirement areas and then renting a car and making our way back to California with various stops along the way. I'll be sure to post a picture or two and I'm sure I'll have funny stories to share along the way. It'll be interesting to see the various stages of the reopening of America.
A heads up to Bundle subscribers, the LIVE Trading Room will be going on hiatus as Mary Ellen will also be out of pocket in the upcoming month. We hope to reopen in late-July. If you recently upgraded to get the Trading Room, I do hope you'll continue the subscription while we are on hiatus. Please direct questions to erin@decisionpoint.com.
Welcome to DecisionPoint Daily Diamonds, wherein I highlight five "diamonds in the rough." These are selected from the results of my DecisionPoint scans, which search for stocks that could benefit from the trend and condition of the market. Remember, these are not recommendations to buy or sell, but are the most interesting of the stocks that surfaced in my scans. My objective is to save you the work of the initial, tedious culling process, but you need to apply your own analysis to see if these stocks pique your interest as well. There are no guaranteed winners here!
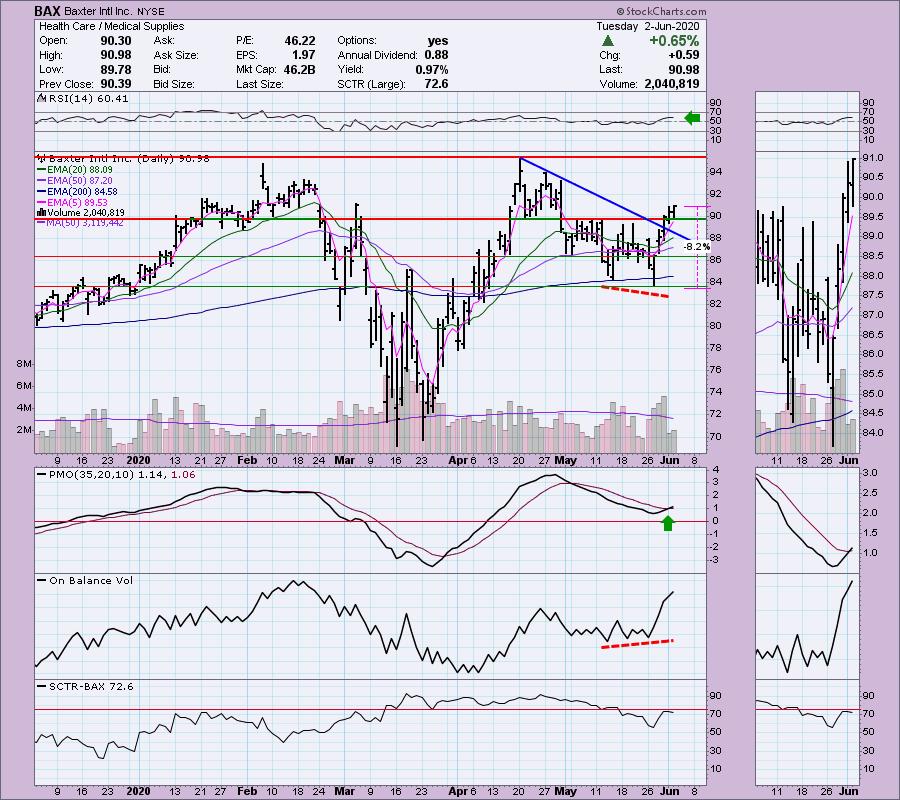
Baxter Intl Inc (BAX) - Earnings: 7/23/2020 (BMO)
Baxter International, Inc. provides portfolio of essential renal and hospital products, including acute and chronic dialysis, sterile IV solutions, infusion systems and devices, parenteral nutrition therapies; premixed and oncolytic injectable, bio surgery products and anesthetics, drug reconstitution systems and pharmacy automation, software and services. It operates through the following segment: Americas, Europe, Middle East & Africa and Asia-Pacific.
I wrote about Medical Supplies yesterday and this medical supply company hit the scans today. I like the breakout from the short-term tops in May and today it closed on its high. The RSI is comfortably above 50 and not overbought. Prior to the current rally, the OBV set up a very nice positive divergence with its rising bottoms matched to declining price bottoms. The PMO just triggered a BUY signal. You can set an 8% stop just below $84.
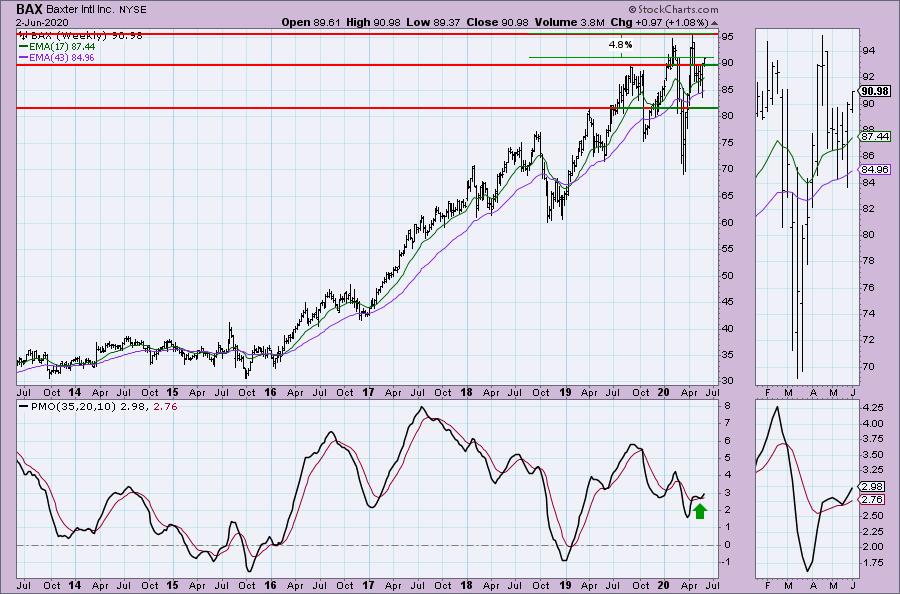
While upside potential on the weekly chart may not be exciting. However, with the PMO turning back up above its signal line, I am looking for a breakout to new all-time highs.
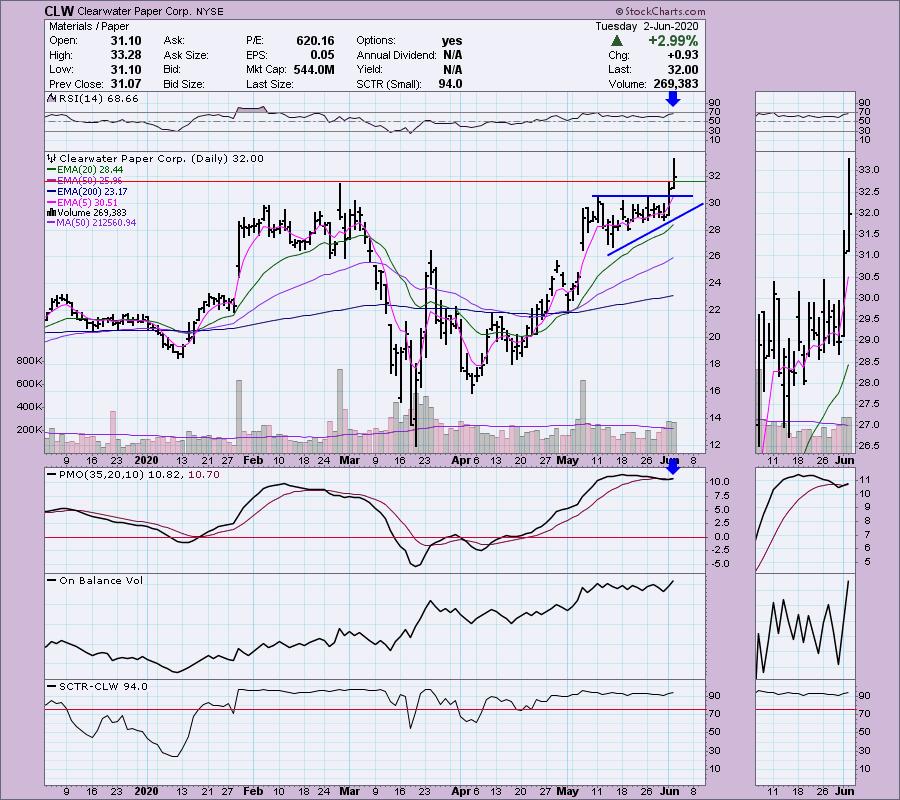
Clearwater Paper Corp (CLW) - Earnings: 7/29/2020 (AMC)
Clearwater Paper Corp. engages in the manufacturing and selling of private label tissue, paperboard, and pulp-based products. It operates through the following segments: Consumer Products, and Pulp & Paperboard. The Consumer Products segment manufactures and sells a complete line of at-home tissue products, or retail products, and away-from-home tissue products, or non-retail products, and parent rolls. The Pulp & Paperboard segment produce and markets solid bleached sulfate paperboard for the high-end segment of the packaging industry as well as offers custom sheeting, slitting, and cutting of paperboard.
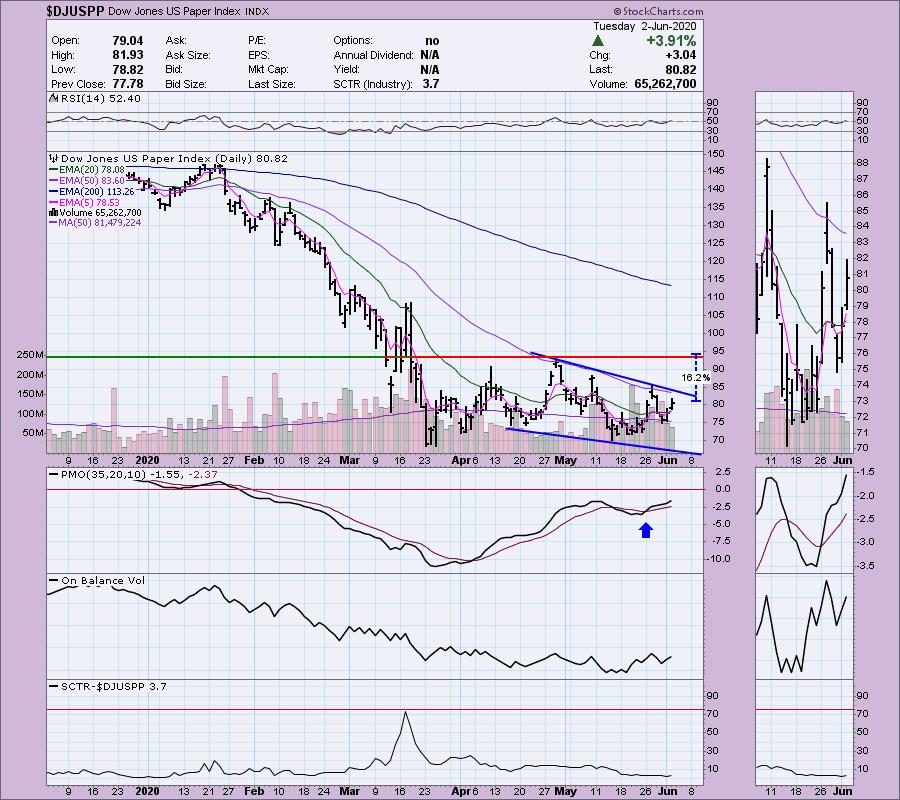
The Paper Industry Group ($DJUSPP) is abysmal with a 3.7 SCTR. It hasn't been performing well. However, take a look at the chart for Paper. It is now on PMO BUY signal, the RSI has reached just above 50 and we have rising bottoms on the OBV. The pattern annotated is a bullish falling wedge.
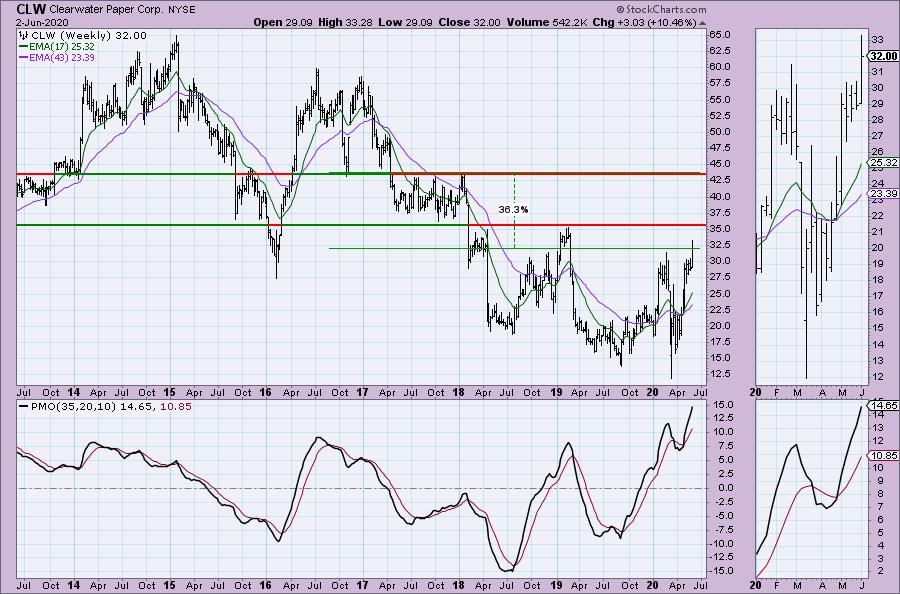
Hard to believe this stock is part of that industry group. It sits with a SCTR of 94 and has made a new annual high. I might watch to make sure this support holds at the top of the bullish ascending triangle. Admittedly the PMO is overbought but it has just triggered another BUY signal. The RSI is healthy and not overbought.
The weekly chart is quite favorable with a strong PMO rising. Even if price got stuck at overhead resistance at the 2019 top, that would still be a 12% gain, but I am looking for it to reach the next level of resistance at those 2017 tops.
Don't forget, on Thursdays I look at reader-requested symbols, so shoot me an email at erin@decisionpoint.com. I read every email I receive and try to answer them all!
Domino's Pizza Group LTD (DPZ) - Earnings: 7/16/2020 (BMO)
Domino's Pizza, Inc. is a pizza company, which operates a network of company-owned and franchise-owned stores in the U.S. and international markets. It operates though the following three segments: U.S. Stores, International Franchise and Supply Chain. The U.S. Stores segment consists primarily of franchise operations. The International Franchise segment comprises of a network of franchised stores. The Supply Chain segment operates regional dough manufacturing and food supply chain centers.
Although DPZ is down in after hours trading, I still like this chart. The PMO is rising again, the RSI is above net neutral and the SCTR is a strong 93.8. The ascending triangle is a bullish pattern and tells us to expect and upside breakout.
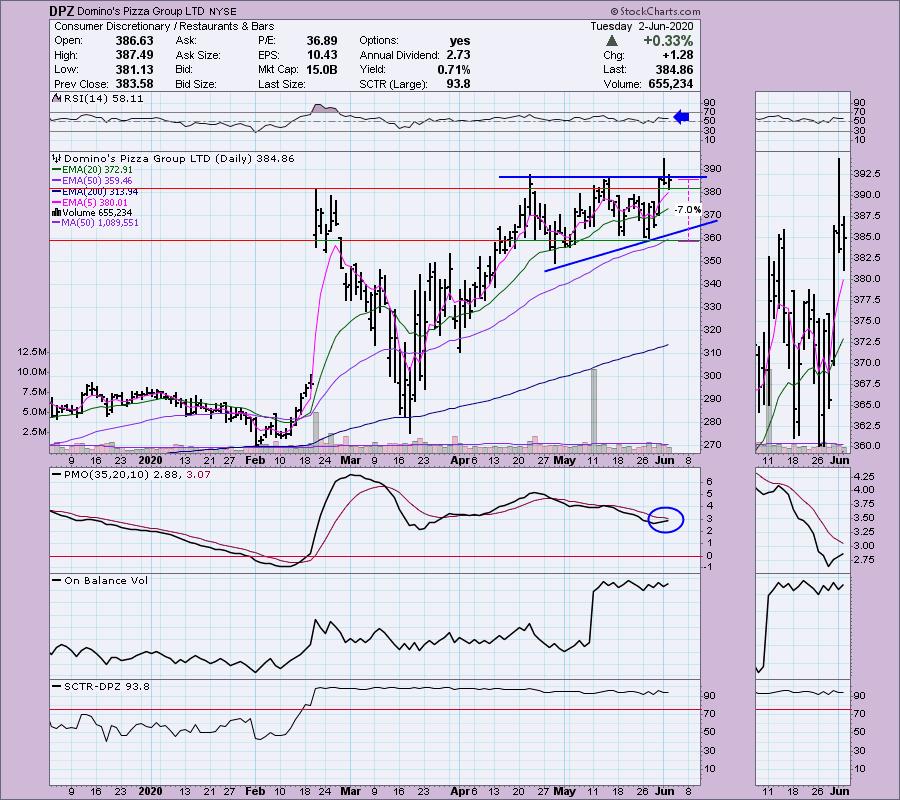
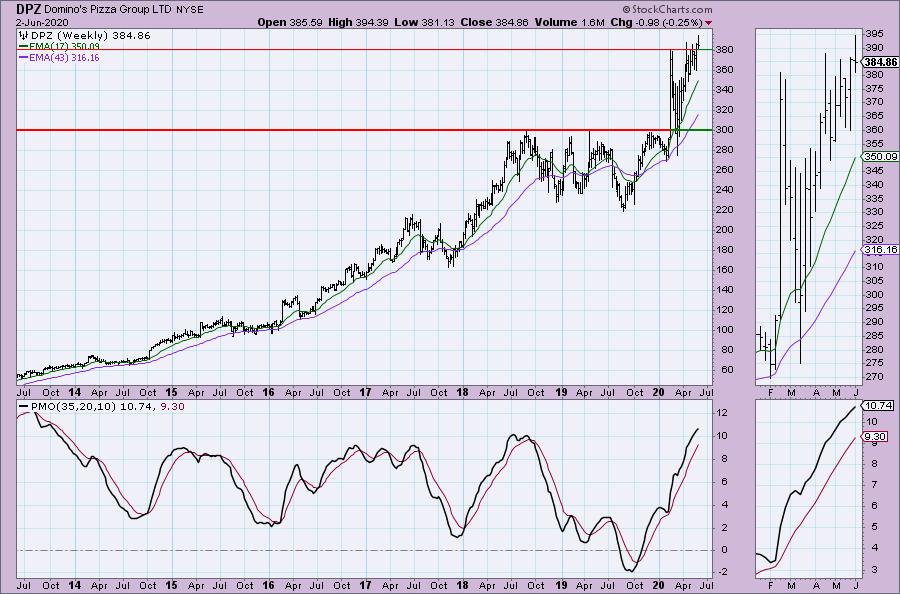
The weekly PMO is rising strongly. It is overbought, but we did see higher PMO values back in 2013.
Rite Aid Corp (RAD) - Earnings: 6/24/2020 (BMO)
Rite Aid Corp. engages in the ownership and management of retail drug stores. It operates through following segments: Retail Pharmacy and Pharmacy Services. The Retail Pharmacy segment includes branded and generic prescription drugs, health and beauty aids, personal care products, and walk-in retail clinics. The Pharmacy Services segment offers transparent and traditional pharmacy benefit management for insurance companies, employers, health plans, and government employee groups.
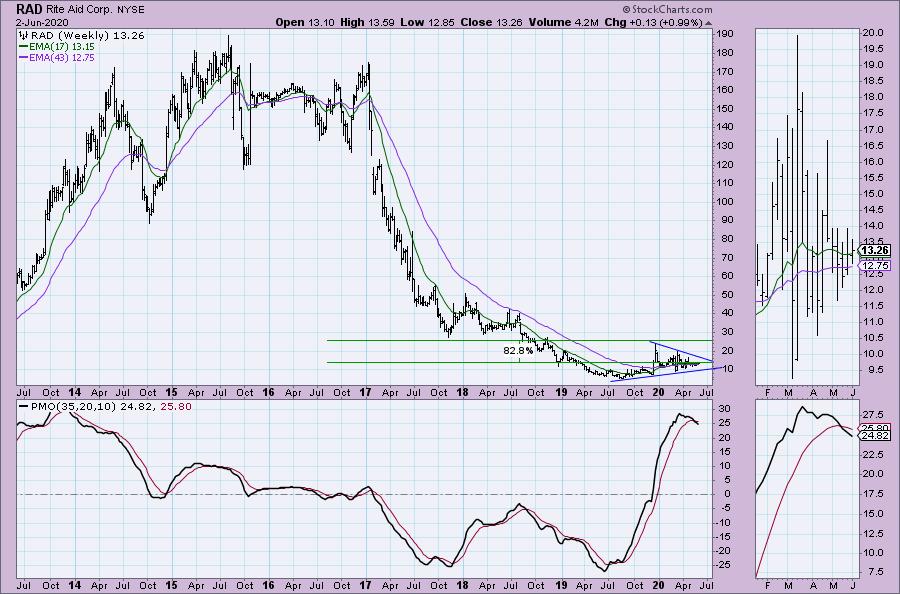
Full disclosure, I own RAD. This one is down in after hours trading. It came back on my radar when the 5-EMA crossed above the 20-EMA giving it a new ST Trend Model BUY signal. The PMO is rising and a bullish ascending triangle has formed. It may take time to marinate, but I would look for an upside breakout. The stop I have put on the chart matches to the low in May. Notice on the last decline, the low didn't test the rising bottoms trendline that forms the bottom of the triangle. That is usually a sign that a breakout is on its way.
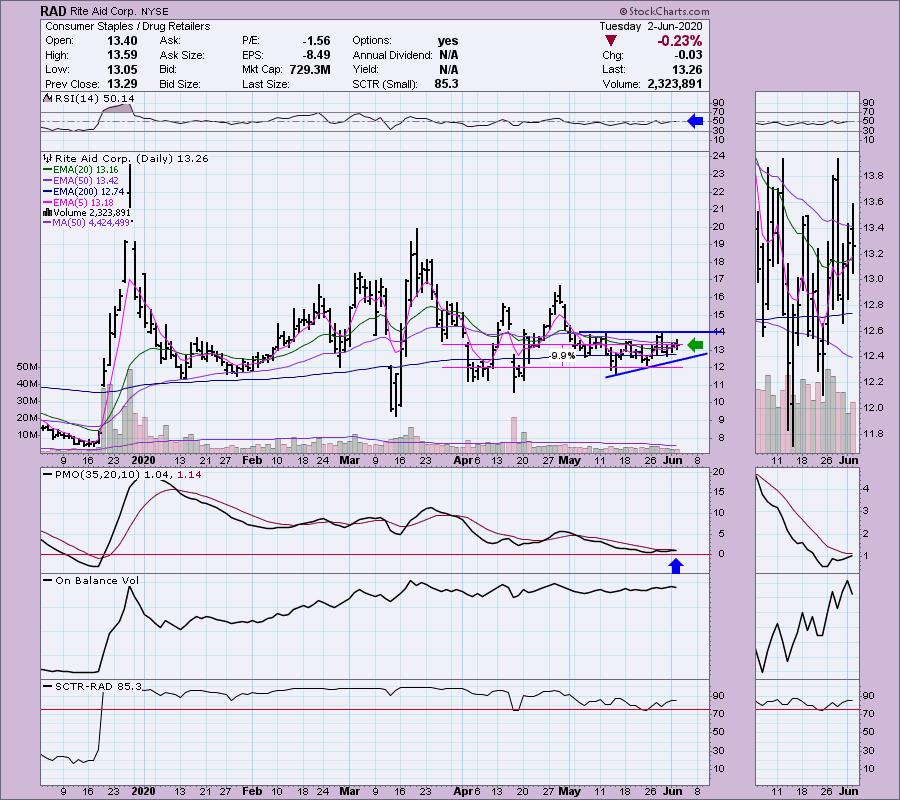
Clearly this should be considered a short-term investment given the ugly PMO on the weekly chart. I do see a symmetrical triangle and rising bottoms that began at the end of 2019. That's typically a continuation pattern so it should have an upside breakout. If price gets to the 2019 high, that would be a whopping 82% gain. I'm not looking for that given the weekly PMO, but I do think there is potential to eke out a nice gain.
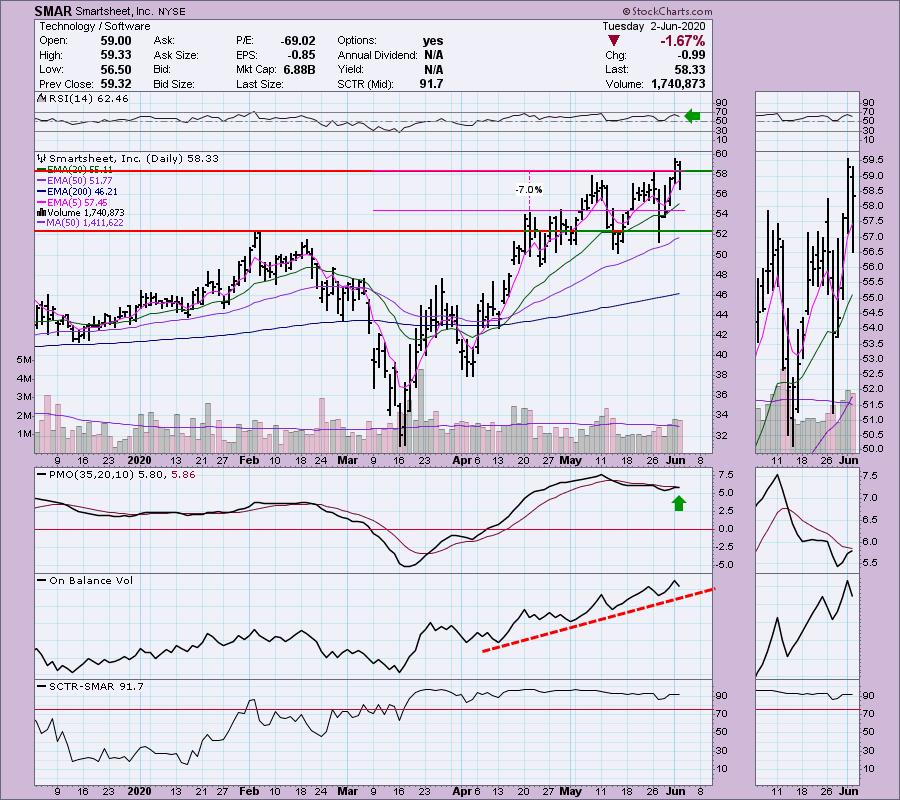
Smartsheet Inc (SMAR) - Earnings: 6/3/2020 (AMC)
Smartsheet, Inc. engages in the design and development of cloud-based platform for work management. It offers ways for customers to plan and manage their work using grids, projects, cards, and calendars.
The Software space has been a leader in the Technology sector. Today SMAR had a sizable pullback, but price closed above the May tops. The PMO is making another run toward a crossover BUY signal. OBV bottoms have continued to rise since April showing this mid-cap stock has been a favorite. The SCTR is strong and the RSI, while it did pullback, is above 50.
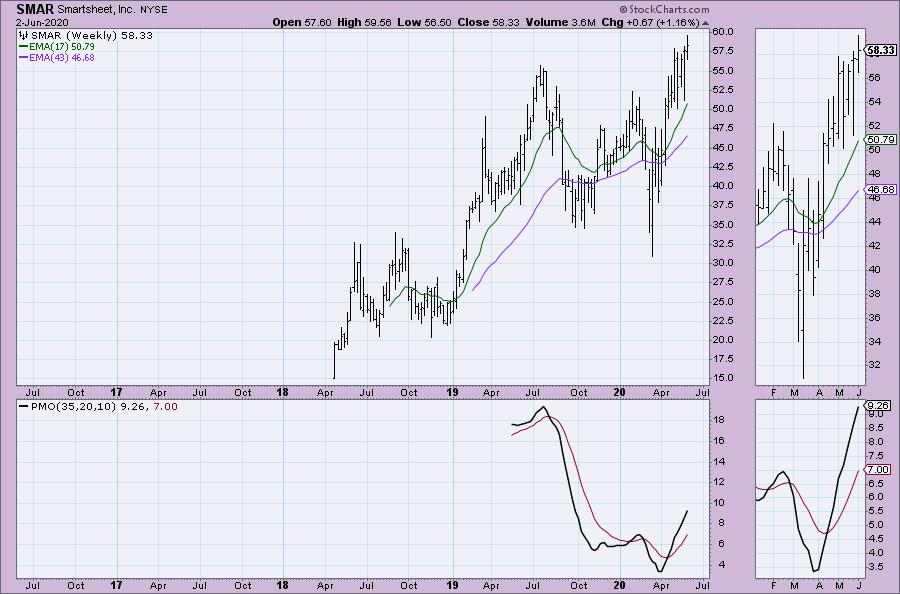
Excellent weekly PMO rising and new all-time highs being challenged.
Current Market Outlook:
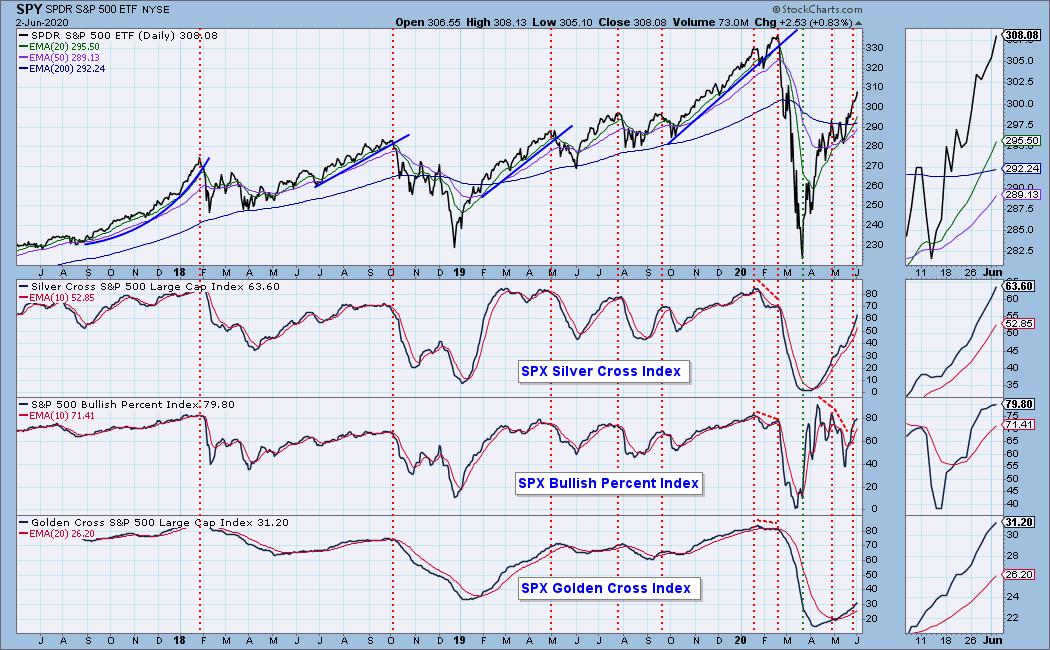
Market Environment: It is important to consider the odds for success. The Silver Cross Index measures the percentage of stocks on IT Trend Model BUY signals (20-EMA > 50-EMA), while the Golden Cross Index measures the percentage of stocks on LT Trend Model BUY signals (50-EMA > 200-EMA). Don't forget that as a "Diamonds" member, you have access to our GCI/SCI curated ChartList on DecisionPoint.com. You'll find it under "Members Only" links on the left side on the Blogs and Links Page. Here are the current percentages on the Silver and Golden Cross Indexes:
Diamond Index:
- Diamond Scan Results: 19
- Diamond Dog Scan Results: 11
- Diamond Bull/Bear Ratio: 1.73
For a more comprehensive review of current market conditions as well as analysis of Dollar, Gold, Oil and Bonds, subscribe to the DecisionPoint Alert! For a LIMITED TIME you can get a coupon code that will give you a discount for bundling your Diamonds subscription with the DecisionPoint Alert! Contact support@decisionpoint.com for more details.
Full Disclosure: I currently own REGN. I'm closing out two positions tomorrow, IBB and HD. I've got a good profit and those charts are looking unfavorable. I'm entering KO and SBUX tomorrow if my limit is reached. I am currently 75% in cash.

Erin Swenlin will be presenting at the The MoneyShow Las Vegas August 16 - 20 at Bally's/Paris Resort! You'll have an opportunity to meet Erin and discuss the latest DecisionPoint news and Diamond Scans. Claim your FREE pass here! You can watch online with this pass too!! There will be online events held in May and when I have more information I'll let you know.
Watch the latest episode of DecisionPoint with Carl & Erin Swenlin on Thursdays 8:00a EST or on the DecisionPoint playlist on the StockCharts TV YouTube channel here!
Technical Analysis is a windsock, not a crystal ball.
Happy Charting!
- Erin
erin@decisionpoint.com
NOTE: The stocks reported herein are from mechanical trading model scans that are based upon moving average relationships, momentum and volume. DecisionPoint analysis is then applied to get five selections from the scans. The selections given should prompt readers to do a chart review using their own analysis process. This letter is not a call for a specific action to buy, sell or short any of the stocks provided. There are NO sure things or guaranteed returns on the daily selection of "diamonds in the rough."
Helpful DecisionPoint Links:
DecisionPoint Shared ChartList and DecisionPoint Chart Gallery
Price Momentum Oscillator (PMO)
Swenlin Trading Oscillators (STO-B and STO-V)
For more links, go to DecisionPoint.com!