
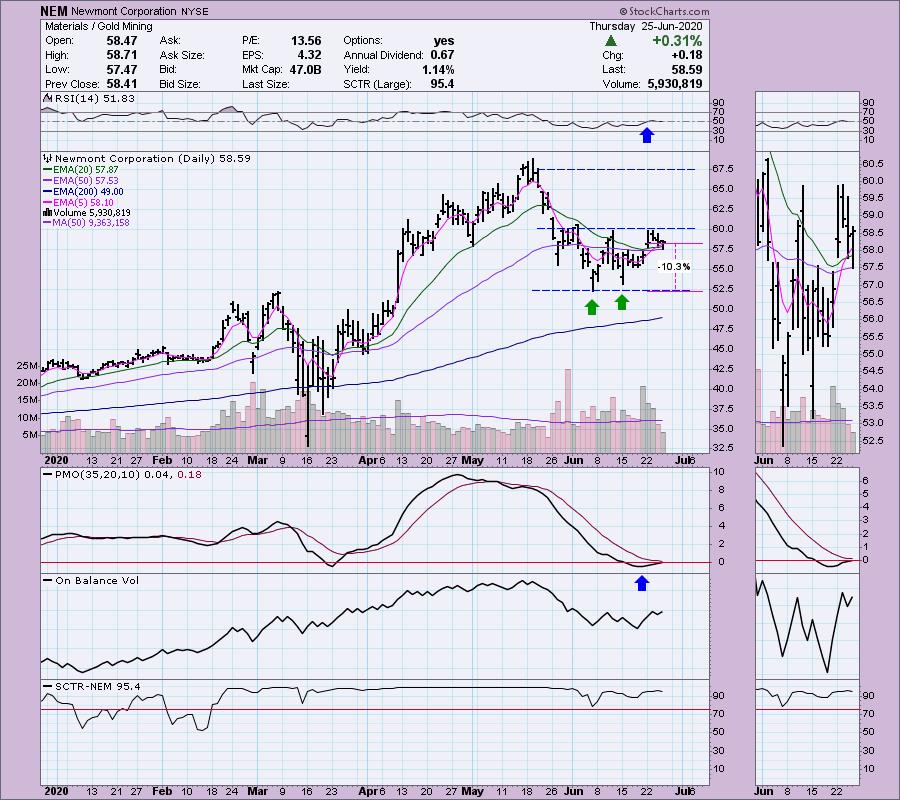
Reader requests were a little light today, but I picked out the ones that could be considered Diamonds. One of the requests was whether a particular ETF was a good hedge right now. The other three are a Miner (an Industry Group I really like right now), a relook at a big winner that still has room to run and a stock I came across during today's WealthWise Women taping. I presented Newmont Mining (NEM) on Tuesday and I still like that chart. I've included an updated version of NEM below. It pulled back yesterday but is now up slightly. It must hold support at the 50-EMA. If lost, there could be another move down to the bottom of the trading range. However, with Gold Miners still looking so positive, I suspect it'll make the bounce. For the full Gold Miners ETF (GDX) chart with indicators, it is included in the DP Alert report everyday!
** Announcements **
I will be traveling July 1 - July 15. I will be writing on the road, but broadcasting will be suspended during that time. It's going to be an adventurous road trip for me and my husband. We will be taking a train from Los Angeles to New Orleans, visiting family, checking out retirement areas and then renting a car and making our way back to California with various stops along the way. I'll be sure to post a picture or two and I'm sure I'll have funny stories to share along the way. It'll be interesting to see the various stages of the reopening of America.
A heads up to Bundle subscribers, the LIVE Trading Room will be going on hiatus as Mary Ellen will also be out of pocket in the upcoming month. We hope to reopen in late-July. Please direct questions to erin@decisionpoint.com.
Welcome to DecisionPoint Daily Diamonds, wherein I highlight five "diamonds in the rough." These are selected from the results of my DecisionPoint scans, which search for stocks that could benefit from the trend and condition of the market. Remember, these are not recommendations to buy or sell, but are the most interesting of the stocks that surfaced in my scans. My objective is to save you the work of the initial, tedious culling process, but you need to apply your own analysis to see if these stocks pique your interest as well. There are no guaranteed winners here!
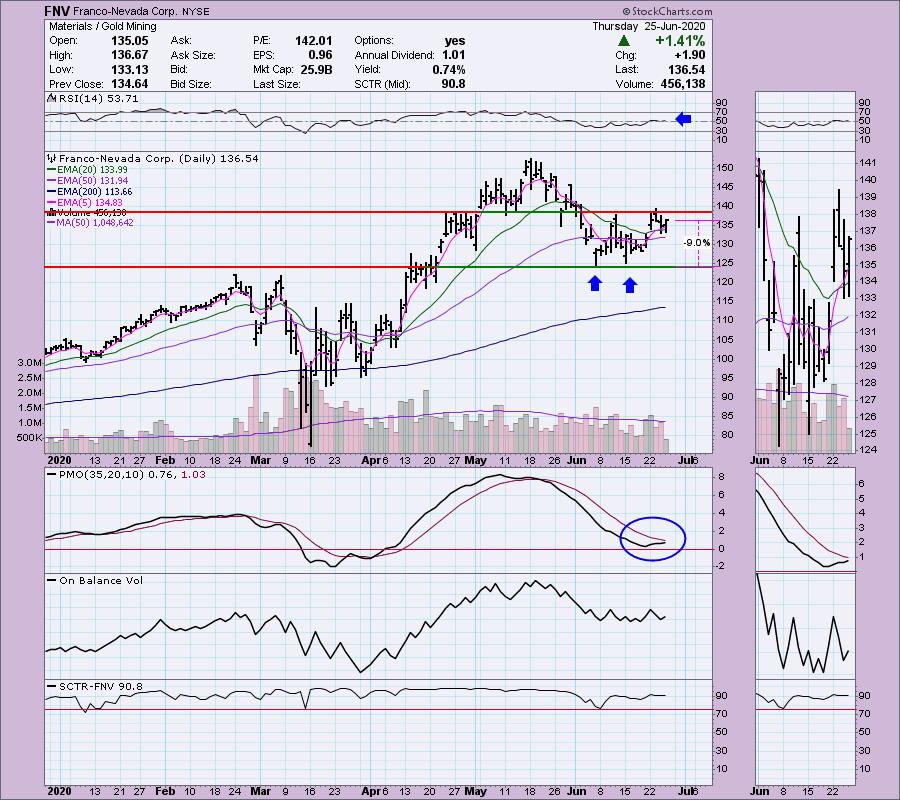
Franco-Nevada Corp (FNV) - Earnings: 8/5/2020 (AMC)
Franco-Nevada Corp. engages in the management of gold-focused royalties and streams portfolio. It provides investors with gold price and exploration optionality while limiting exposure to many of the risks of operating companies.
Here's another Gold Miner. It came up on the Diamond PMO Scan along with AEM and NEM. I liked this chart a bit better. The one thing that does bug me with all of these Miners is the inability to execute the double-bottom pattern. However, it could be looked at as a possible cup and handle. The PMO is still rising and the RSI just got above net neutral. It would be a rather hefty stop here so it might be possible to time your entry and a slightly lower price.
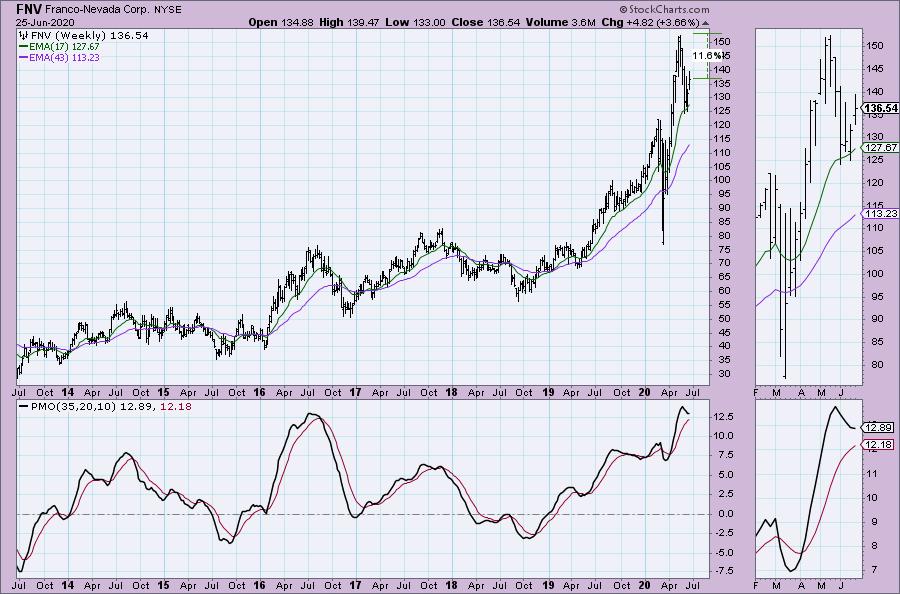
The weekly PMO is in decline and overbought, but it does appear to be decelerating and could turn back up.
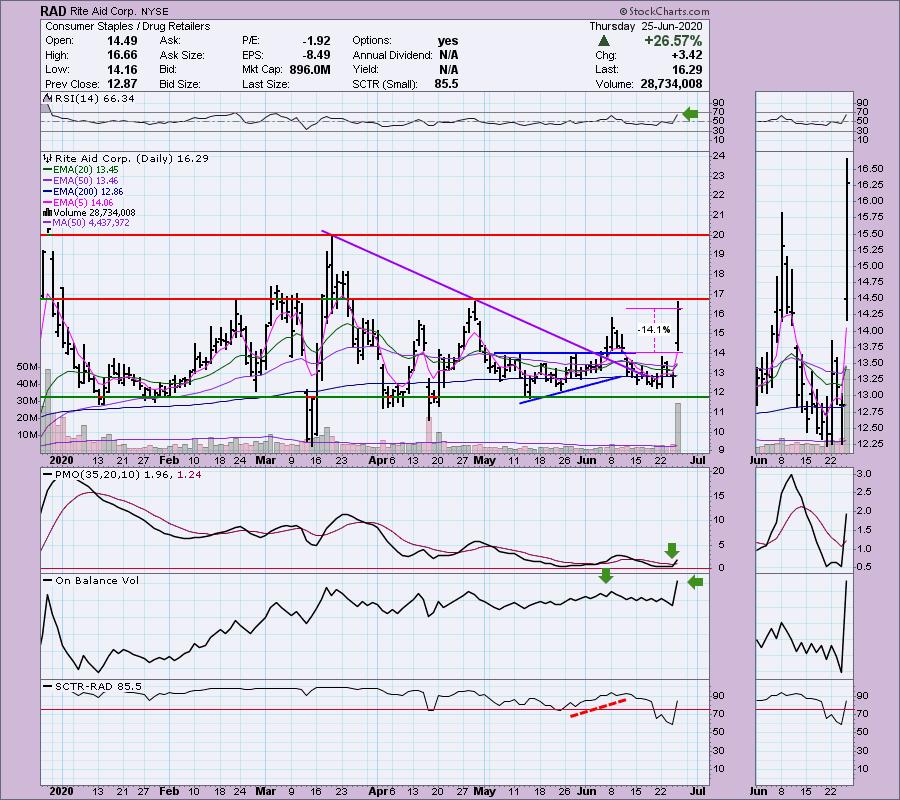
Rite Aid Corp (RAD) - Earnings: 6/25/2020 (Today!)
Rite Aid Corp. engages in the ownership and management of retail drug stores. It operates through following segments: Retail Pharmacy and Pharmacy Services. The Retail Pharmacy segment includes branded and generic prescription drugs, health and beauty aids, personal care products, and walk-in retail clinics. The Pharmacy Services segment offers transparent and traditional pharmacy benefit management for insurance companies, employers, health plans, and government employee groups.
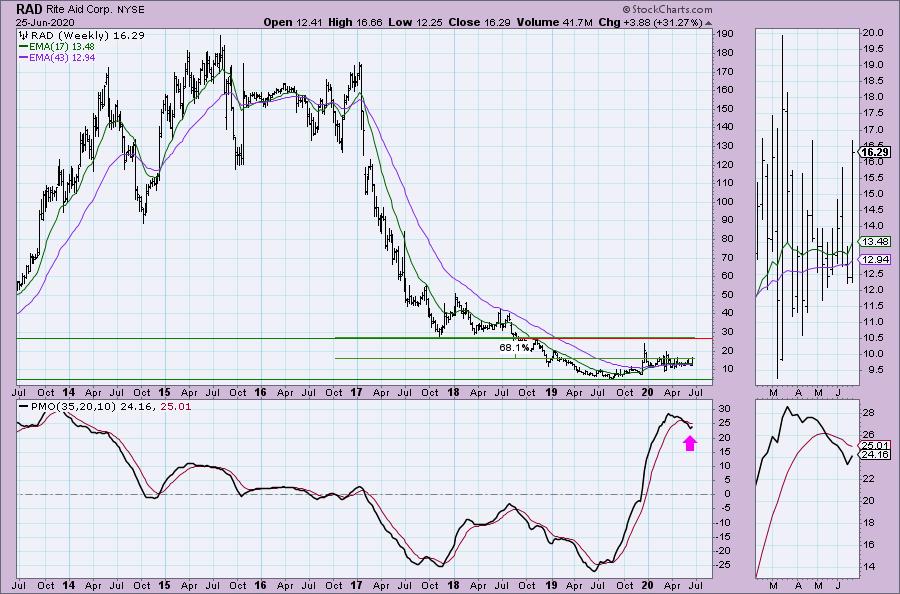
Boom, baby! I had no idea that Rite Aid would put in strong earnings, but I held into them anyway. I purchased this one back in April on the gap down. It's been up and down since then but stayed above support. I republished this Diamond and made it the "Diamond of the Week" during the DecisionPoint Show a few weeks ago. It broke out from the bullish ascending triangle as expected but didn't hold on. My stop is around $11. This one has been beat down for months even before the virus. I still like this one. Typically strong earnings will manifest in higher prices even after a big gap up. I'm looking for a breakout move to $20 given the strong RSI and PMO. Notice also that the OBV made a higher high on the breakout above the prior June top.
Here's what I mean by "beat down". It has been basing for over a year and half. This stock traded in the hundreds of dollars less than five years ago and it is now $16.29 on the big gain today. I'm not looking for a move that would bring it up to the 2013 - 2016 price levels, I'll be happy with a move to overhead resistance at the 2017 low! The weekly PMO has just turned back up.
Don't forget, on Thursdays I look at reader-requested symbols, so shoot me an email at erin@decisionpoint.com. I read every email I receive and try to answer them all!
Sprouts Farmers Market Inc (SFM) Earnings: 7/30/2020 (AMC)
Sprouts Farmers Markets, Inc. engages in operating healthy grocery stores. It specializes in fresh, natural, and organic products. Its products include fresh produce, bulk foods, vitamins and supplements, grocery, meat and seafood, deli, bakery, dairy, frozen foods, body care, and natural household items.
I saw this stock on the WealthWise Women segment "Yeah...That Happened!" where we looked at a few super markets. This one really stood out to both Mary Ellen and I. Today we just got a breakout from a falling wedge pattern. The RSI just popped above 50 and the PMO is turning back up. Rising bottoms on the OBV confirm this rally and I like SCTRs in the 80's as they usually have more room to run. It would be an 8.7% drop to support so the stop is manageable.
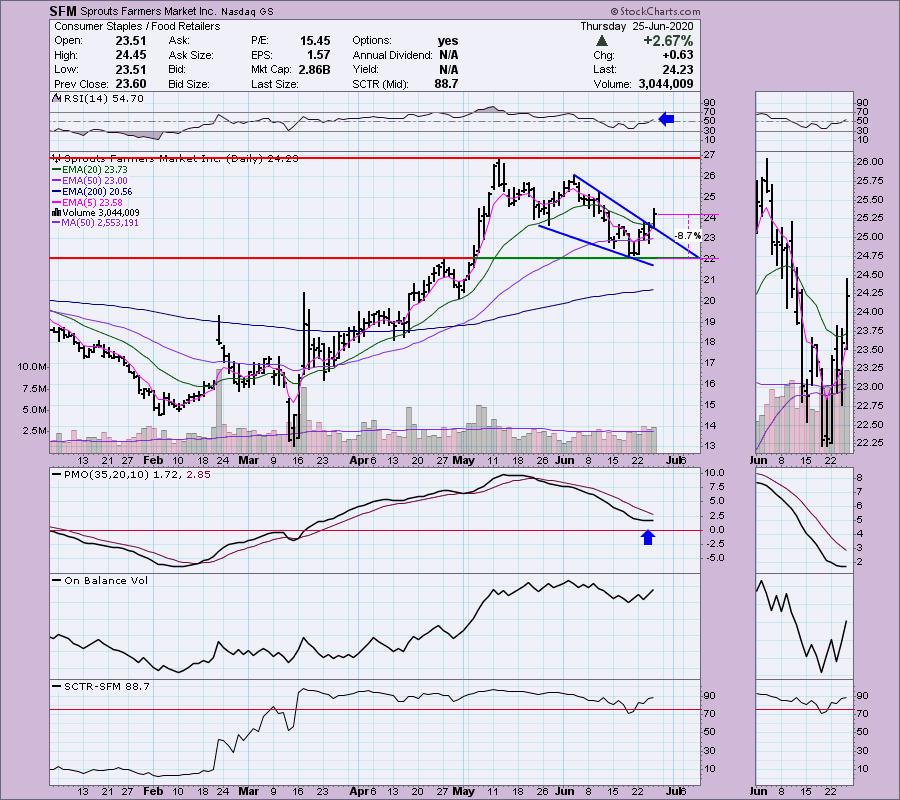
It may not be obvious on the daily chart, but we have a bullish flag formation. The weekly PMO is very overbought right now but it is still rising. If price breaks out from the declining trend of the flag, the minimum upside target would be around $38 or overhead resistance at the 2015 top. I'll just be pleased if it makes it to resistance at the 2016/2019 tops as that would be a 23% gain. Then would be the time to reevaluate. This is a Consumer Staple and as you can see they tend to move sideways within a trading range. It's time for price to test the top of that range.
Olivia - Vista Outdoor Inc (VSTO) -Earnings: 8/6/2020 (BMO)
Vista Outdoor, Inc. engages in the design, manufacture, and marketing of consumer products in the outdoor sports and recreation markets. It operates through the following segments: Shooting Sports and Outdoor Products. The Shooting Sports product lines include centerfire ammunition, rimfire ammunition, shotshell ammunition, reloading components and firearms. The Outdoor Products product lines include action sports, archery and hunting accessories, camping, global eyewear and sport protection products.
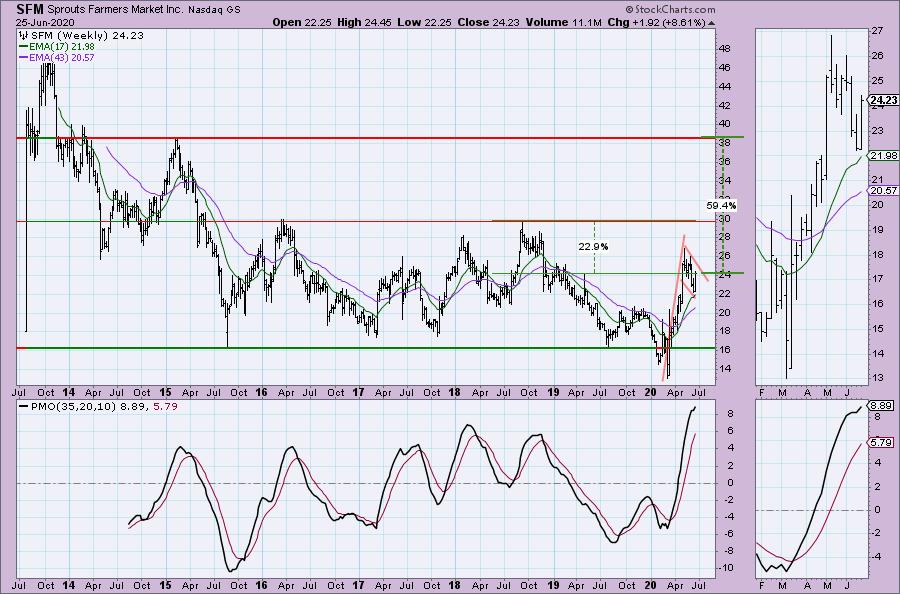
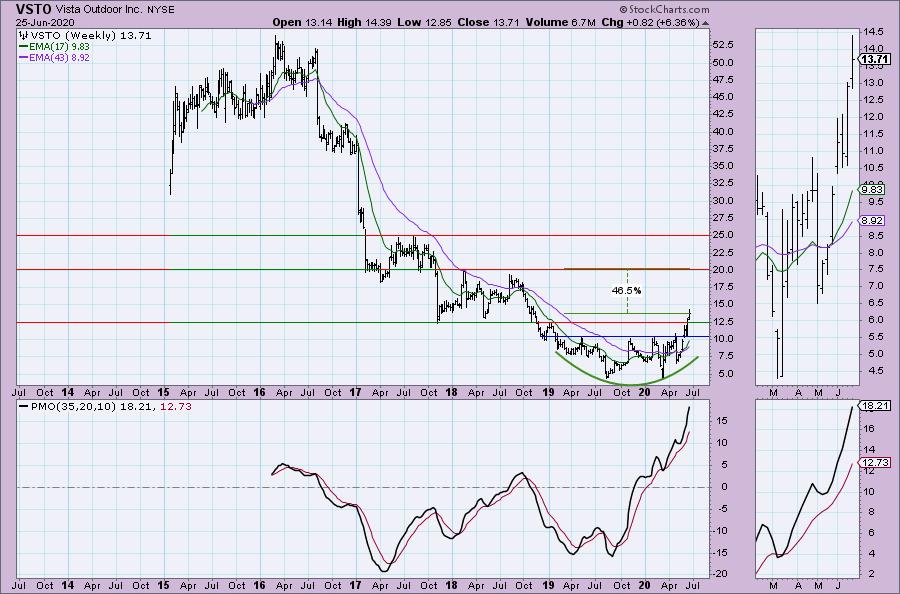
Of your requests, Olivia, this one was the best. It has run quite a bit, but it did pullback yesterday. The rising trend is intact. The RSI is somewhat overbought as is the PMO. I still like the PMO because it is rising and volume does seem to be coming in. My main concern would be the need for it to pullback or digest like it did off the May bottom.
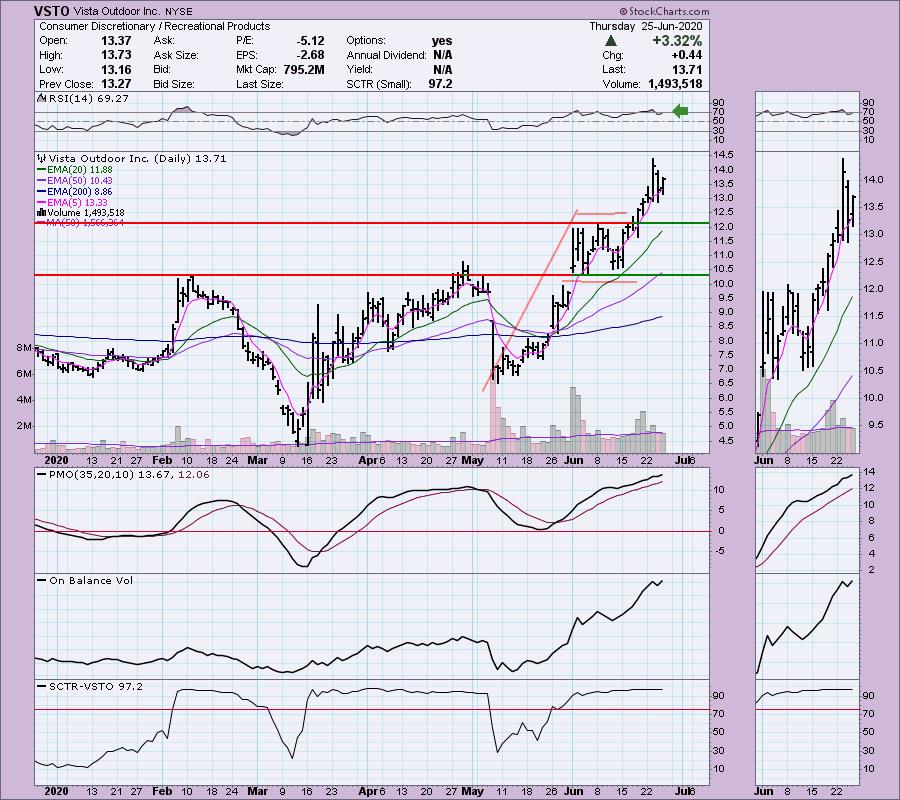
The weekly chart looks very good with a strongly rising PMO and a breakout from the basing pattern/rounded bottom. The breakout this week is particularly good as it puts it above resistance at the 2017/2018 lows. If price can continue to the next resistance level, that would be a 46% gain!
Carla (Hedge?): iPath SP500 VIX Short-Term Futures (VXX)
Managed by Barclays Bank Plc which provides commercial banking services. It offers personal, premier, business and corporate banking products and services to its customers. The banks services include current accounts, savings, investments, mortgages, loans, insurance, credit cards and online banking services.
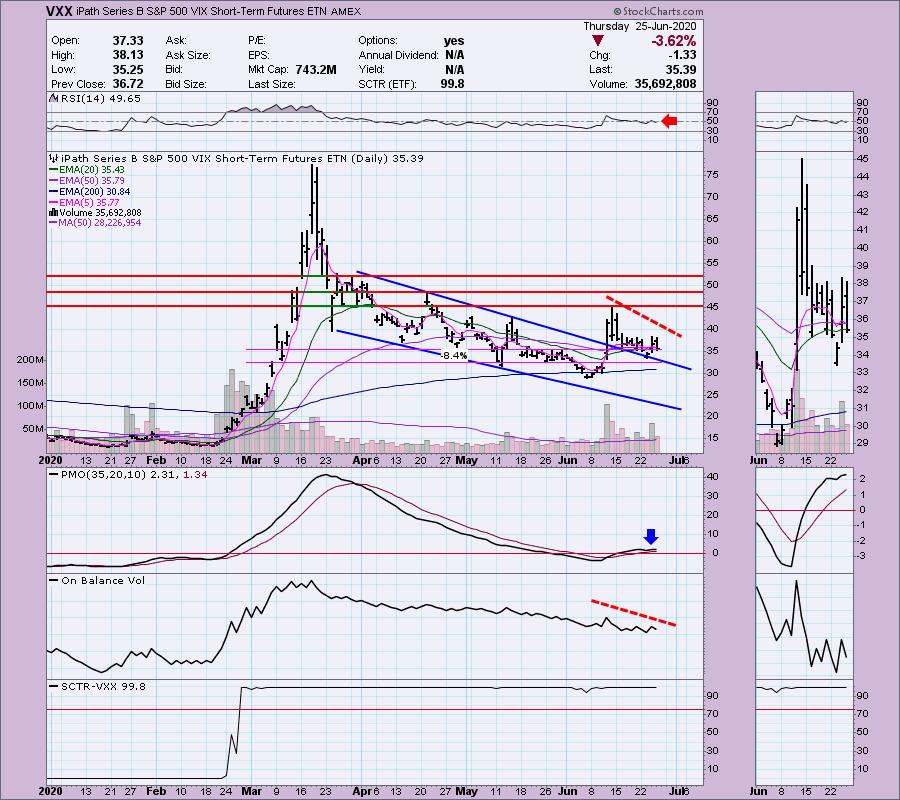
This is a common vehicle for hedging. It isn't looking that great technically which is probably a good thing for the market overall. Given the PMO BUY signal in oversold territory, I think it is a good hedge except that it is volatile. Kind of funny that a "volatility index" ETN would be described "volatile", but it definitely is. Just looking at the chart technically, there are problems. The OBV is confirming the declining trend. The RSI is neutral so it isn't telling us much. You can see how the falling wedge executed earlier this month. Notice how 'thin' the margin is between current price and a stop level of 8.4%. It's not bad as a hedge, but not good for a straight up investment.
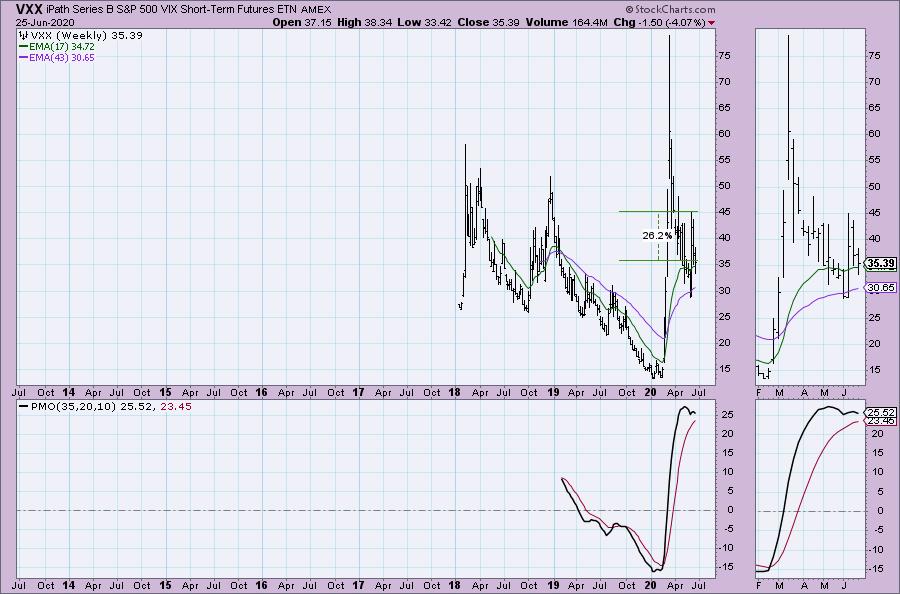
The weekly PMO has topped and the next resistance level would give an upside target around 26%.
Current Market Outlook:
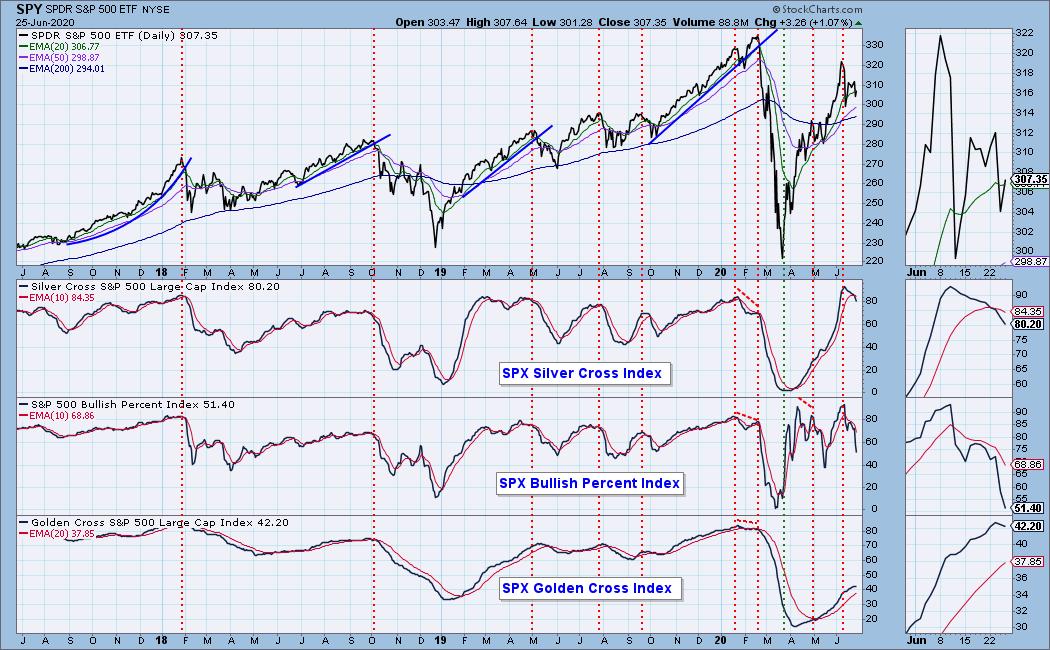
Market Environment: It is important to consider the odds for success. The Silver Cross Index measures the percentage of stocks on IT Trend Model BUY signals (20-EMA > 50-EMA), while the Golden Cross Index measures the percentage of stocks on LT Trend Model BUY signals (50-EMA > 200-EMA). Don't forget that as a "Diamonds" member, you have access to our GCI/SCI curated ChartList on DecisionPoint.com. You'll find it under "Members Only" links on the left side on the Blogs and Links Page. Here are the current percentages on the Silver and Golden Cross Indexes:
Diamond Index:
- Diamond Scan Results: 9
- Diamond Dog Scan Results: 7
- Diamond Bull/Bear Ratio: 1.29
For a more comprehensive review of current market conditions as well as analysis of Dollar, Gold, Oil and Bonds, subscribe to the DecisionPoint Alert! For a LIMITED TIME you can get a coupon code that will give you a discount for bundling your Diamonds subscription with the DecisionPoint Alert! Contact support@decisionpoint.com for more details.
Full Disclosure: I have been trading with tight stops so I have been pleasantly surprised by the upturn in the market. I'm probably going to move the hard stops to trailing stops to take advantage of any more upside while protecting myself from a swift market downturn. I am currently about 45% in cash.

Erin Swenlin will be presenting at the The MoneyShow Las Vegas August 16 - 20 at Bally's/Paris Resort! You'll have an opportunity to meet Erin and discuss the latest DecisionPoint news and Diamond Scans. Claim your FREE pass here! You can watch online with this pass too!! There will be online events held in May and when I have more information I'll let you know.
Watch the latest episode of DecisionPoint with Carl & Erin Swenlin on Thursdays 8:00a EST or on the DecisionPoint playlist on the StockCharts TV YouTube channel here!
Technical Analysis is a windsock, not a crystal ball.
Happy Charting!
- Erin
erin@decisionpoint.com
NOTE: The stocks reported herein are from mechanical trading model scans that are based upon moving average relationships, momentum and volume. DecisionPoint analysis is then applied to get five selections from the scans. The selections given should prompt readers to do a chart review using their own analysis process. This letter is not a call for a specific action to buy, sell or short any of the stocks provided. There are NO sure things or guaranteed returns on the daily selection of "diamonds in the rough."
Helpful DecisionPoint Links:
DecisionPoint Shared ChartList and DecisionPoint Chart Gallery
Price Momentum Oscillator (PMO)
Swenlin Trading Oscillators (STO-B and STO-V)
For more links, go to DecisionPoint.com!f