
Very busy morning with Mary Ellen McGonagle (MEMInvestmentResearch.com)! We started off with our Live Trading Room where we took a look at stocks that we found of interest as well as answering viewer questions and taking symbol requests. I almost always come away with a few great trading ideas. Then it was off to record WealthWise Women! During our WealthWise Women show on StockCharts TV today, we talked about "what's hot and what's not". This is near-term (based on weekly performance) and not intermediate to long-term. I decided I'd take a few reader/viewer requests that fit into the "what's hot" category. At first glance at the list, I will say that some of those hot areas are not necessarily my cup of tea (oil for one and airlines for another--great upside potential, but languishing with the promise of more languishing), but there are some names that you should look at. The names I chose weren't necessarily in a scan result since they are all reader/viewer requests. I picked the best of the bunch, but again some of these areas are so beat down they carry more risk given their very bearish biases; so keep that in mind. Some of these need time to marinate or time to prove themselves.
What's most interesting to me is that favor is shifting out of the defensive areas of the market (at least for the last week or so). Typically bear market rallies will come off the back of those defensive sectors and bull market rallies will come off aggressive sectors like Consumer Discretionary and Technology. Maybe this rotation is telling us something.
What's Hot?
- Oil
- Retail
- Banking
- FAANG (+MSFT)
- Gaming
- Airlines
- Leisure
What's Not?
- Health Care
- Utilities
- Staples
Live Trading Room - Tuesdays/Thursdays
I'm teaming up with Mary Ellen McGonagle (MEMInvestmentResearch.com) to do regular "LIVE Trading Room" sessions for FREE at 11:00a EST. We've had excellent reviews on our new LIVE Trading Rooms so far and plan on continuing them Tuesdays/Thursdays 11:00a EST. The link will be sent out the day before the event, so watch your email and tell your colleagues to sign up for our free email list on DecisionPoint.com to be notified!
** Here is the link to the recording of today's (4/28) live trading room.**
DexCom Inc (DXCM) - Earnings: 7/29/2020 (AMC)
DexCom, Inc. is a medical device manufacturing company. The firm engages in the design, development and commercialization of glucose monitoring systems for ambulatory use by people with diabetes. Its products include Dexcom G4 PLATINUM System, DexCom G5 Mobil, DexCom Share and Mobile apps.
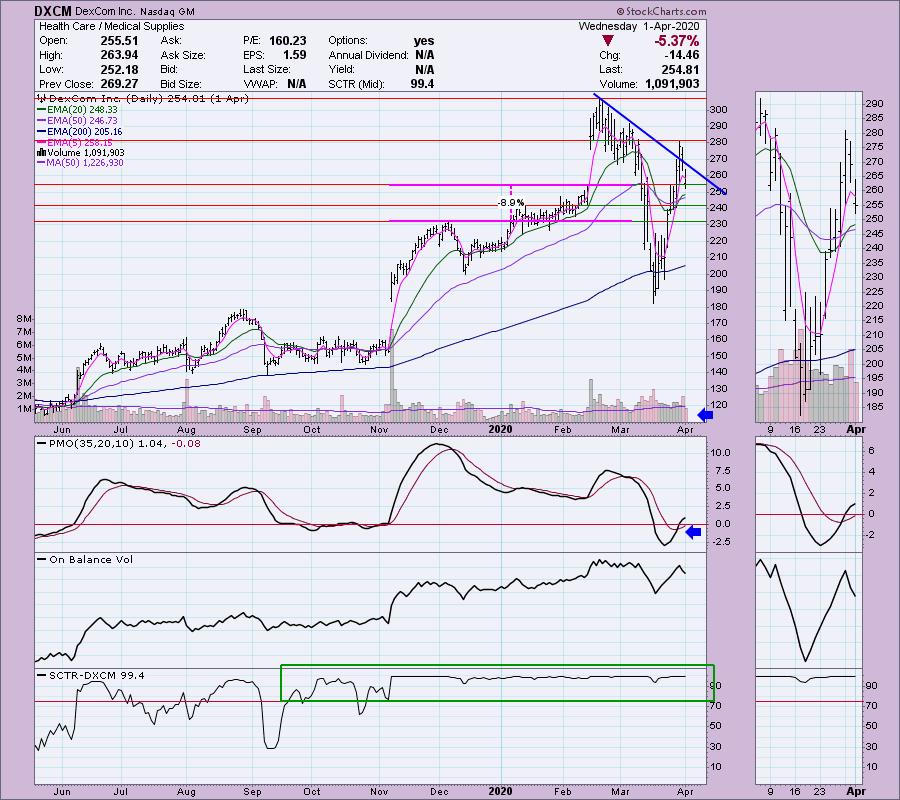
I covered DXCM back on April 1st. I'm including the chart below from that date so that you can where we would've picked it up. I liked the pullback. It had broken the declining tops trendline, but it was holding support at the February gap. The SCTR has been stellar.
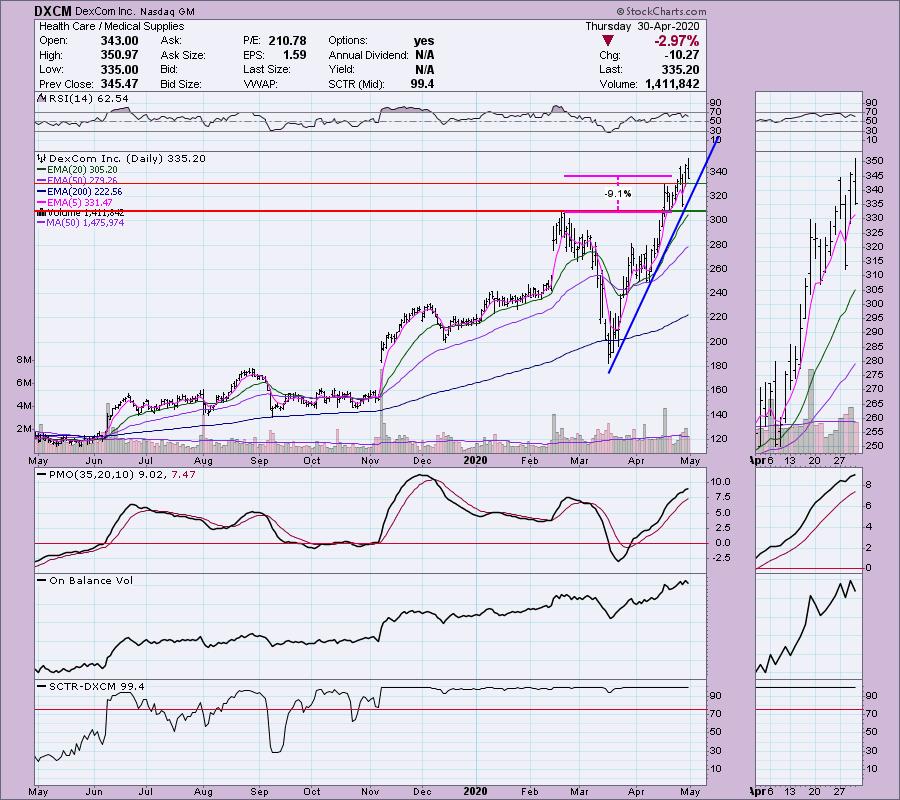
Even with this pullback, I calculated that it is up over 30% since it was listed as a Diamond. The stock remains healthy and this pullback could present an opportunity to get into a strong stock at a better price. The RSI has moved away from overbought territory and is still above 50 or "net neutral". The PMO is healthy, but for good reason, stumbled on today's drop and the drop from last week. The OBV still is confirming the rising trend. I would set a stop around the February top. FYI, it is trading down about 1% in after hours trading right now.
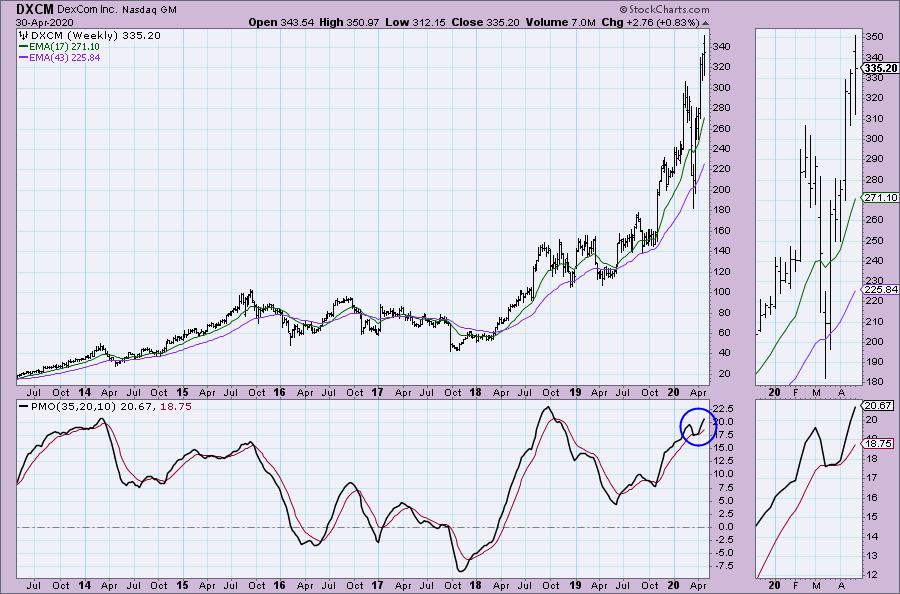
The weekly PMO switched directions, avoiding a lingering crossover SELL signal. We do have a parabolic 'look' to the weekly chart, but given the bullish daily chart and weekly PMO, I'll forgive that...just make sure you have a stop in play!
Welcome to DecisionPoint Daily Diamonds, wherein I highlight five "diamonds in the rough." These are selected from the results of my DecisionPoint scans, which search for stocks that could benefit from the trend and condition of the market. Remember, these are not recommendations to buy or sell, but are the most interesting of the stocks that surfaced in my scans. My objective is to save you the work of the initial, tedious culling process, but you need to apply your own analysis to see if these stocks pique your interest as well. There are no guaranteed winners here!
Hawaiian Holdings Inc (HA) - Earnings: 5/5/2020 (AMC)
Hawaiian Holdings, Inc. is a holding company, which engages in the provision of air transportation services. It offers cargo handling and passenger flights between the Hawaiian Islands and its neighbor island routes through its subsidiary, Hawaiian Airlines, Inc.
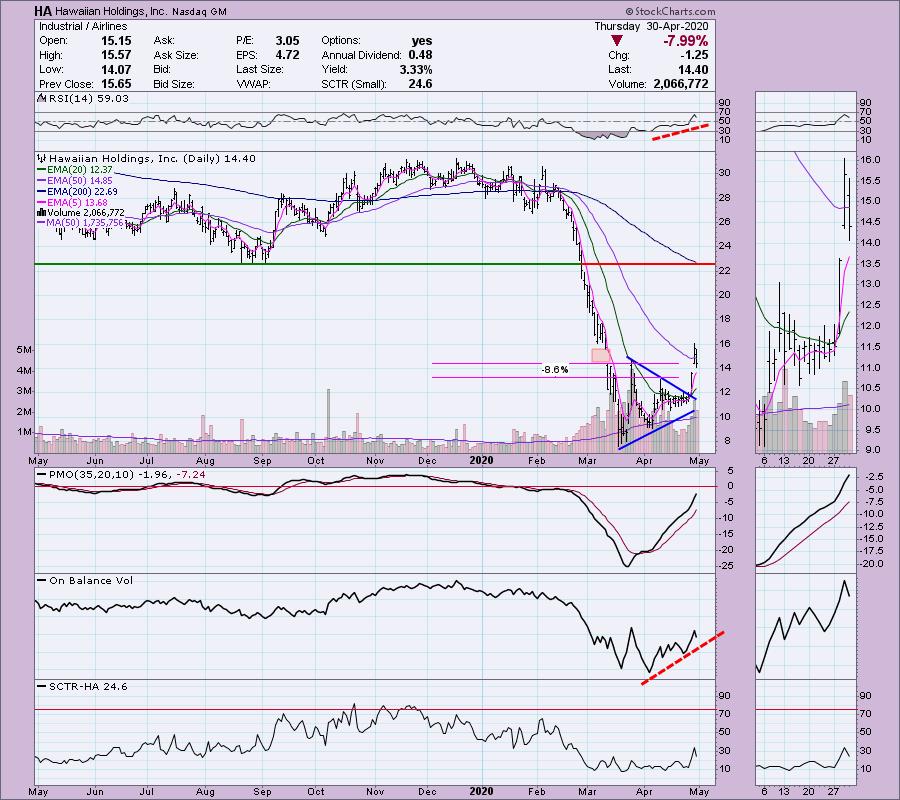
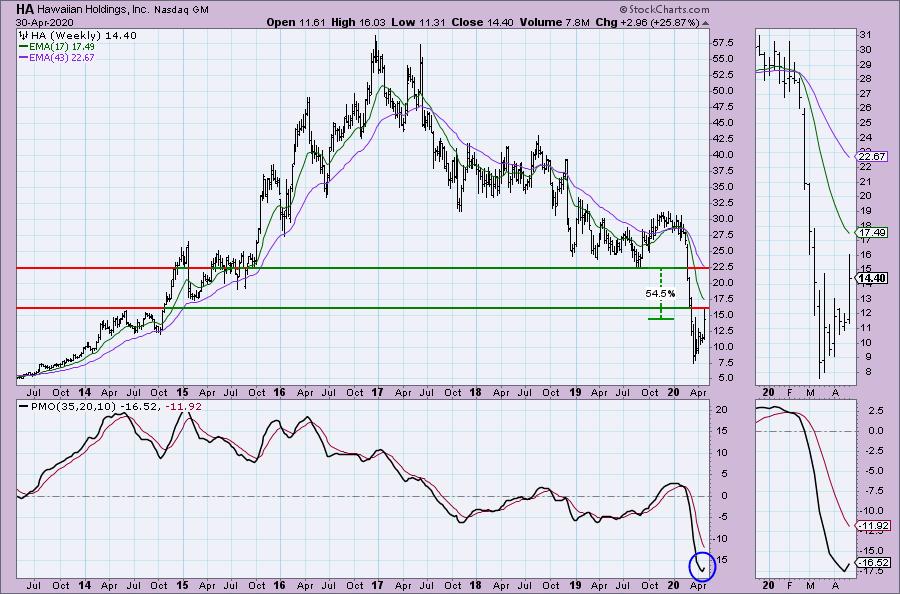
I've avoided the airlines but they are soooo beat down that any chance of a rally might be worth taking. I picked this airline for a few reasons. First, while it is beat down, it has shown signs of life; more so than its brethren. The gap up this week moved price out of the short-term declining trend. The RSI is perking up and the PMO is almost to positive territory. Today's nearly 8% drop didn't pose a problem for the PMO, it's still rising strongly. The gap from March was filled and typically I watch for follow-on or a continuation of the rally. Today's big pullback does make it a possible bottom fishing opportunity. It's currently trading slightly higher in after hours trading.
Like many beat down stocks, the upside potential is quite staggering. I can't say it will get there, especially given that it must overcome longer-term resistance at those 2014 tops and 2015 low. The PMO does give us optimism.
Don't forget, on Thursdays I look at reader-requested symbols, so shoot me an email at erin@decisionpoint.com. I read every email I receive and try to answer them all!
SPDR S&P Regional Banking ETF (KRE) - Earnings: N/A
The SPDR® S&P® Regional Banking ETF seeks to provide investment results that, before fees and expenses, correspond generally to the total return performance of the S&P® Regional Banks Select Industry Index.
Banks do seem to be returning to favor with regional banks performing better in most cases. Regional banks have actually managed to process small business loans for far more customers than the big banks. They are handling the strain of the loans for payroll protection. They are traveling in a rising trend channel. My main concern is that we could see price go back down and test the rising bottoms trendline. That would be a tough loss to endure. I also don't like that it failed to close that gap. The good news is that even with today's big pullback, support did hold at the previous price top. Momentum still looks great and the PMO is about to cross back into positive territory.

Upside potential on the weekly chart isn't all that fantastic as far as reaching the next level of strong overhead resistance. The PMO has turned up in very oversold territory, so a continuation of this week's rally is certainly attainable.

Macy's Inc (M) - Earnings: 5/13/2020
Macy's, Inc. engages in the retail of apparel, accessories, cosmetics, home furnishings, and other consumer goods. Its brands include Macy's, Bloomingdale's, and Bluemercury. It offers men's, women's, and children's apparel, women's accessories, intimate apparel, shoes, cosmetics, fragrances, as well as home and miscellaneous products.
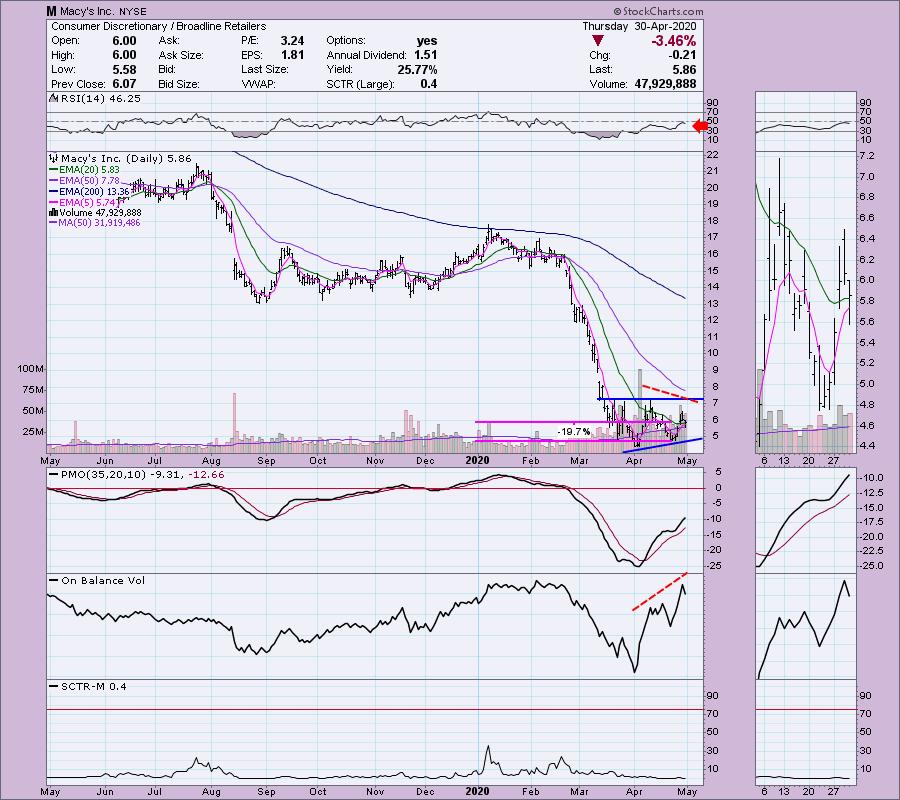
I do believe that Macy's has some potential, it just doesn't seem like the time to try it out. The RSI is in oversold territory and moving lower and there is a reverse divergence with the OBV. To explain, price tops are declining while OBV tops are rising. This means that despite heavy volume, price couldn't get going. Price should follow volume. Whenever there is a discrepancy, it requires close analysis. The PMO is healthy, but the RSI...not so much. We see a problem similar to KRE above. Setting a stop would be very tricky given there aren't any real support levels until you have lost 20%. And FYI, it is down 1.36% in after hours trading as of this writing.
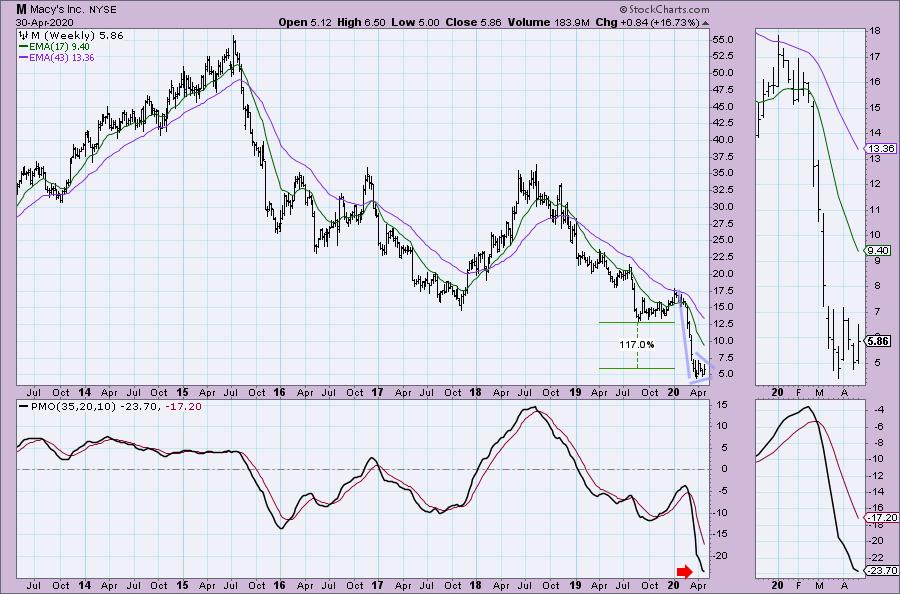
The upside potential looks enticing, but note that Macy's was already floundering in a strong bull market in 2019. We have a bearish reverse flag to deal with too. Maybe if we see the weekly PMO turn back up, it would be a better candidate. Personally I would avoid this one, dear reader who requested Macy's.
Penn National Gaming Inc (PENN) - Earnings: 5/7/2020 (BMO)
Penn National Gaming, Inc. owns and manages gaming and racing facilities and video gaming terminal operations with a focus on slot machine entertainment. It operates through the following business segments: Northeast, South, West and Midwest.. The Northeast segment consists of the following properties: Hollywood Casino at Charles Town Races, Hollywood Casino Bangor, Hollywood Casino at Penn National Race Course, Hollywood Casino Toledo, Hollywood Casino Columbus, Hollywood Gaming at Dayton Raceway, Hollywood Gaming at Mahoning Valley Race Course, and Plain ridge Park Casino. The South and West segment comprises of the following properties: Zia Park Casino, Hollywood Casino Tunica, Hollywood Casino Gulf Coast, Boomtown Biloxi, M Resort, Tropicana Las Vegas, 1st Jackpot and Resorts. The Midwest segment controls the following properties: Hollywood Casino Aurora, Hollywood Casino Joliet, Argosy Casino Alton, Argosy Casino Riverside, Hollywood Casino Lawrenceburg, Hollywood Casino St. Louis, and Prairie State Gaming.
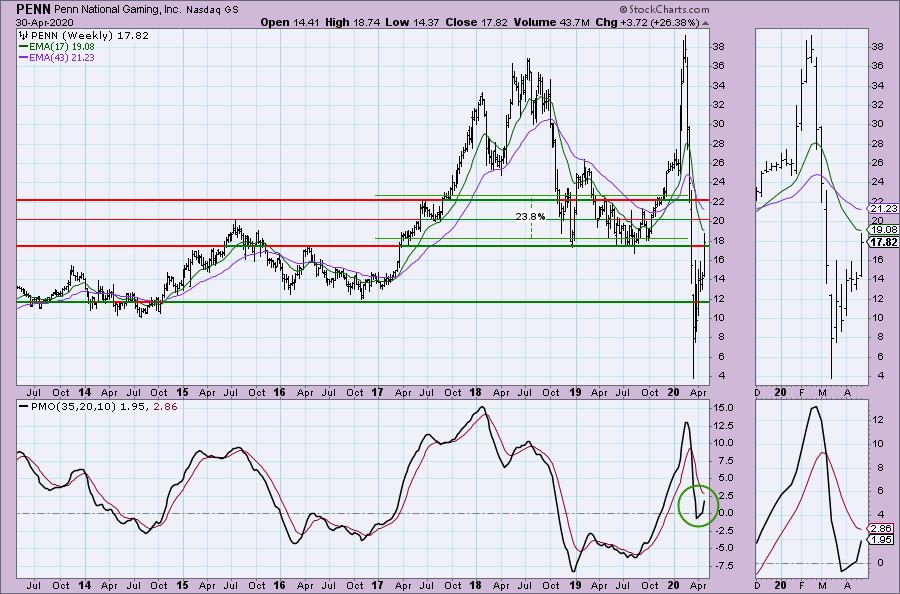
I have to say I was surprised by the bullish activity on all of the gaming company stocks. I liked this one best for a few reasons. First the SCTR improvement is promising better relative and internal strength. The OBV has been confirming the rally off the lows. Price broke out from a bullish ascending triangle and today pulled back to the breakout point. I am concerned that it wasn't able to close the gap on this breakout, but there is still time. Just FYI it is currently down 3.2% in after hours trading.
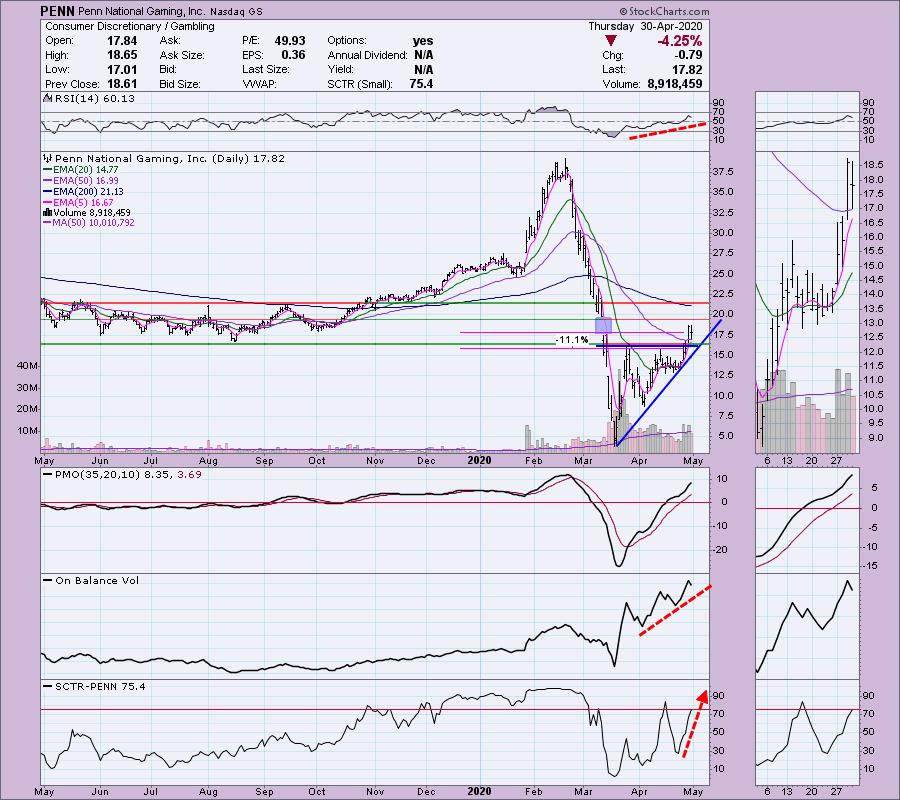
Turns out when we look at the weekly chart that this week's breakout did more than just trigger an ascending triangle. It broke above strong overhead resistance. The weekly PMO is happy and rising. This week so far it has gained over 25% so it is due for a pullback, but if it can hold that $17.50 level, this dog could become a diamond.
Current Market Outlook:
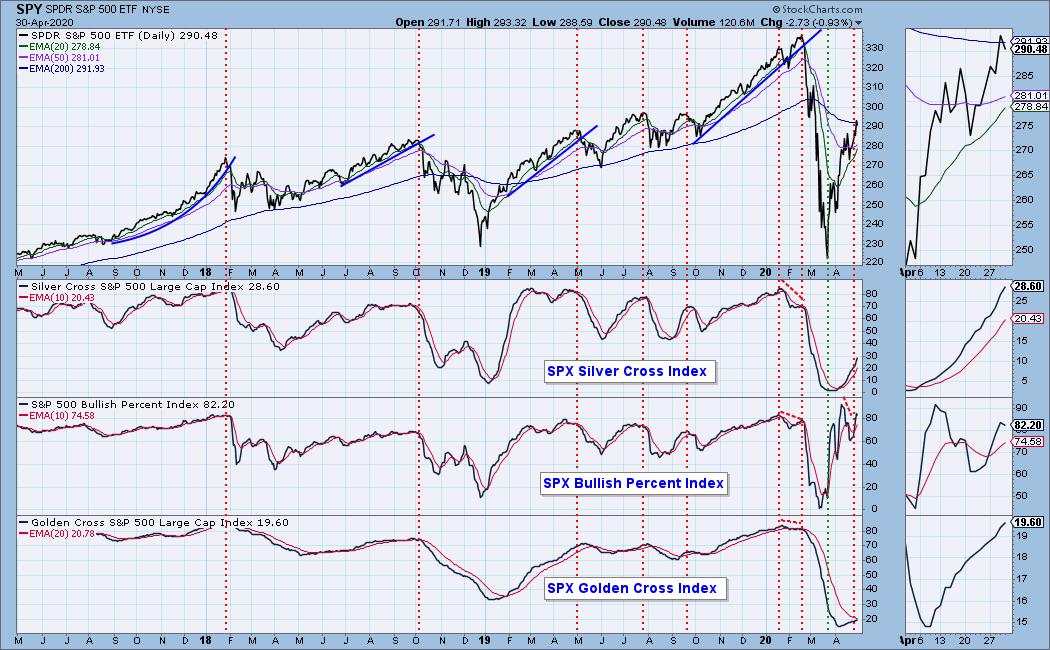
Market Environment: It is important to consider the odds for success. The Silver Cross Index measures the percentage of stocks on IT Trend Model BUY signals (20-EMA > 50-EMA), while the Golden Cross Index measures the percentage of stocks on LT Trend Model BUY signals (50-EMA > 200-EMA). Don't forget that as a "Diamonds" member, you have access to our GCI/SCI curated ChartList on DecisionPoint.com. You'll find it under "Members Only" links on the left side on the Blogs and Links Page. Here are the current percentages on the Silver and Golden Cross Indexes:
Diamond Index:
- Diamond Scan Results: 0
- Diamond Dog Scan Results: 13
- Diamond Bull/Bear Ratio: 0.00
For a more comprehensive review of current market conditions as well as analysis of Dollar, Gold, Oil and Bonds, subscribe to the DecisionPoint Alert! For a LIMITED TIME you can get a coupon code that will give you a discount for bundling your Diamonds subscription with the DecisionPoint Alert! Contact support@decisionpoint.com for more details.
Full Disclosure: I don't own any of the stocks above. I'm currently 20% in cash. My trading timeframe has moved from intermediate-term to short-term and therefore I'm investing more.

Erin Swenlin will be presenting at the The MoneyShow Las Vegas August 16 - 20 at Bally's/Paris Resort! You'll have an opportunity to meet Erin and discuss the latest DecisionPoint news and Diamond Scans. Claim your FREE pass here! You can watch online with this pass too!! There will be online events held in May and when I have more information I'll let you know.
Watch the latest episode of DecisionPoint with Carl & Erin Swenlin LIVE on Wednesdays 5:00p EST or on the StockCharts TV YouTube channel here!
Technical Analysis is a windsock, not a crystal ball.
Happy Charting!
- Erin
erinh@stockcharts.com
NOTE: The stocks reported herein are from mechanical trading model scans that are based upon moving average relationships, momentum and volume. DecisionPoint analysis is then applied to get five selections from the scans. The selections given should prompt readers to do a chart review using their own analysis process. This letter is not a call for a specific action to buy, sell or short any of the stocks provided. There are NO sure things or guaranteed returns on the daily selection of "diamonds in the rough."
Helpful DecisionPoint Links:
DecisionPoint Shared ChartList and DecisionPoint Chart Gallery
Price Momentum Oscillator (PMO)
Swenlin Trading Oscillators (STO-B and STO-V)
For more links, go to DecisionPoint.com!