
I live in Southern California where marijuana is legal. Apparently, April 20th has significance to those who partake. The story behind 4-20 is that a group of high school teens would meet at 4:20p after school to go find abandoned cannabis crops. They eventually named themselves 4-20 and since then the slang has been adopted. As a follow-on, 4:20p also became the designated time to smoke cannabis so the name stuck.
This area of the market isn't benefiting from the coronavirus pandemic. The ETF for the marijuana industry is Alternative Harvest with the tongue in cheek symbol "MJ". It might appear that MJ broke out from a declining trend, but it merely drifted out of it sideways. The PMO is rising and still has plenty of room to move higher and the RSI is trending upward along with the OBV. I'm not a fan of this ETF. I found a cannabis stock that looks better than this ETF that I thought I'd include it in recognition of April 20th.

fQuick announcement: DP Diamonds will now be published Mondays, Tuesdays and Thursdays (reader request day). We have moved the DecisionPoint Show to Wednesdays from Mondays so my time constraints have caused me to move publishing of DP Diamonds. From here on out the DP Show is being recorded and played later Wednesday evenings. You'll find the SCTV programming schedule here. Our YouTube channel can be reached here.
Live Trading Room - Tuesdays/Thursdays
I'm teaming up with Mary Ellen McGonagle (MEMInvestmentResearch.com) to do regular "LIVE Trading Room" sessions for FREE at 11:00a EST. We've had excellent reviews on our new LIVE Trading Rooms so far and plan on continuing them Tuesdays/Thursdays 11:00a EST. The link will be sent out the day before the event, so watch your email and tell your colleagues to sign up for our free email list on DecisionPoint.com to be notified!
Here is the link for tomorrow's live trading room with Mary Ellen McGonagle.
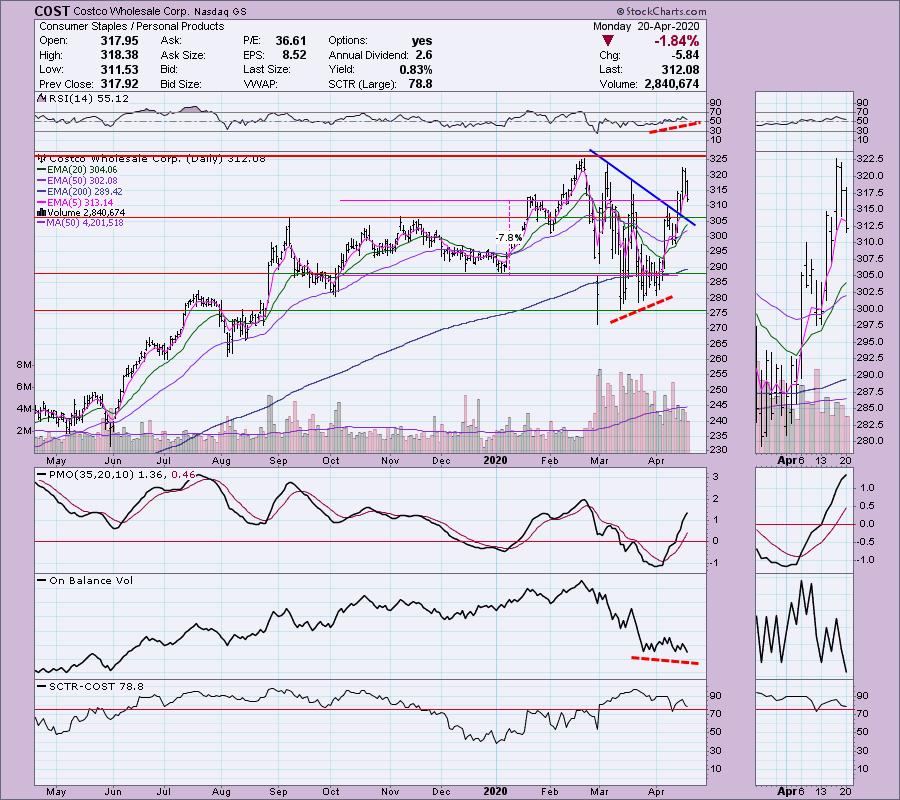
Costco Wholesale Corp (COST) - Earnings: 5/28/2020 (AMC)
I've written about Costco twice before today (3/6, 3/19). The stock arrived once again in my scan results. With today's 1.84% decline, this might be an opportunity to take advantage. The PMO is rising and is not overbought. We have a "Silver Cross" of the 20/50-EMAs which triggered an IT Trend Model BUY signal. The RSI is not overbought at all and is still trending higher. Don't be alarmed by the divergence between the OBV and price. This is a "reverse" divergence. It shows us that price was able to establish a rising trend despite flat volume.
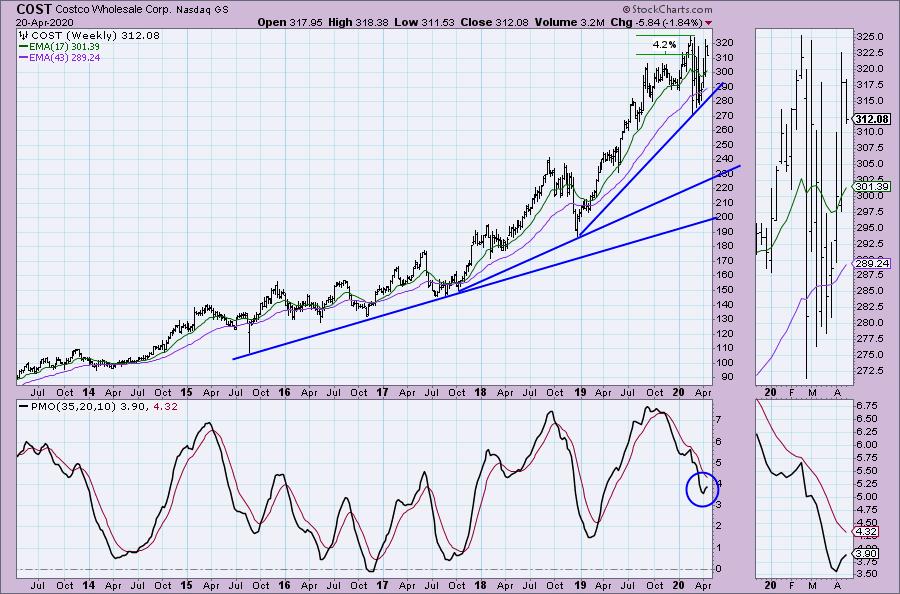
COST is still in a rising trend, a steeper one in fact. I like the PMO turning up. Overhead resistance is at all-time highs and is only 4.2% away right now.
Welcome to DecisionPoint Daily Diamonds, wherein I highlight five "diamonds in the rough." These are selected from the results of my DecisionPoint scans, which search for stocks that could benefit from the trend and condition of the market. Remember, these are not recommendations to buy or sell, but are the most interesting of the stocks that surfaced in my scans. My objective is to save you the work of the initial, tedious culling process, but you need to apply your own analysis to see if these stocks pique your interest as well. There are no guaranteed winners here!
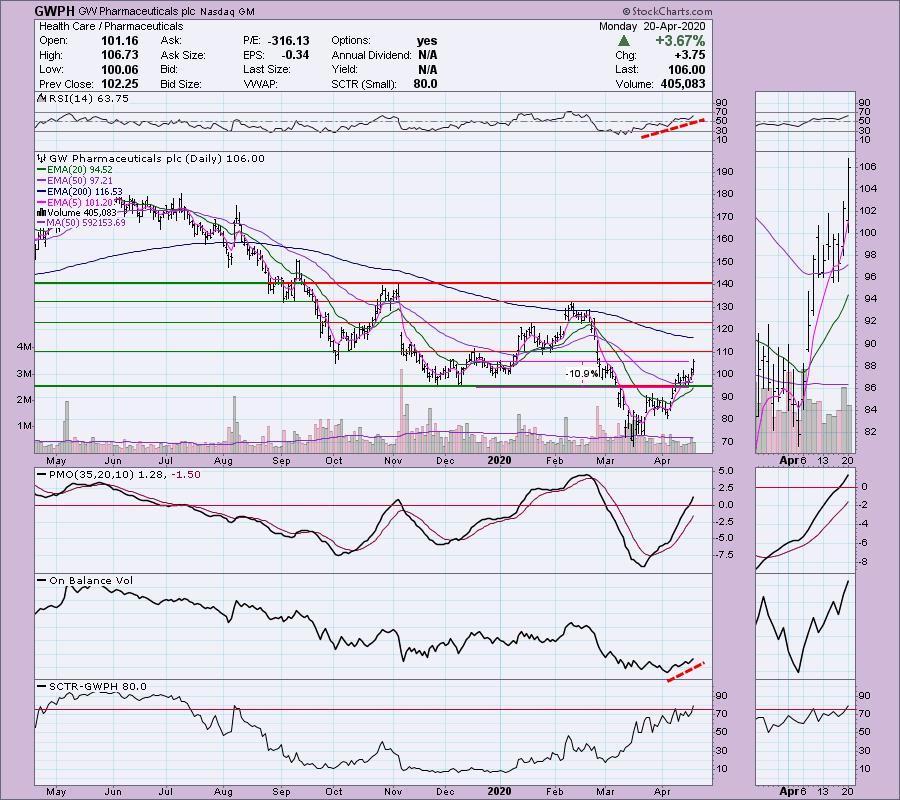
GW Pharmaceuticals plc (GWPH) - Earnings: 5/5/2020 (AMC)
This was the only big name cannabis company that had a decent looking chart. In fact, this chart looks quite good. $95 was an important area of overhead resistance. It was beaten this month and then price held onto it. Now it is making another run toward the next overhead resistance level at $110. The RSI is rising nicely and the PMO has now reached positive territory. The OBV is confirming. I would like to see a pullback given today's big upside move.
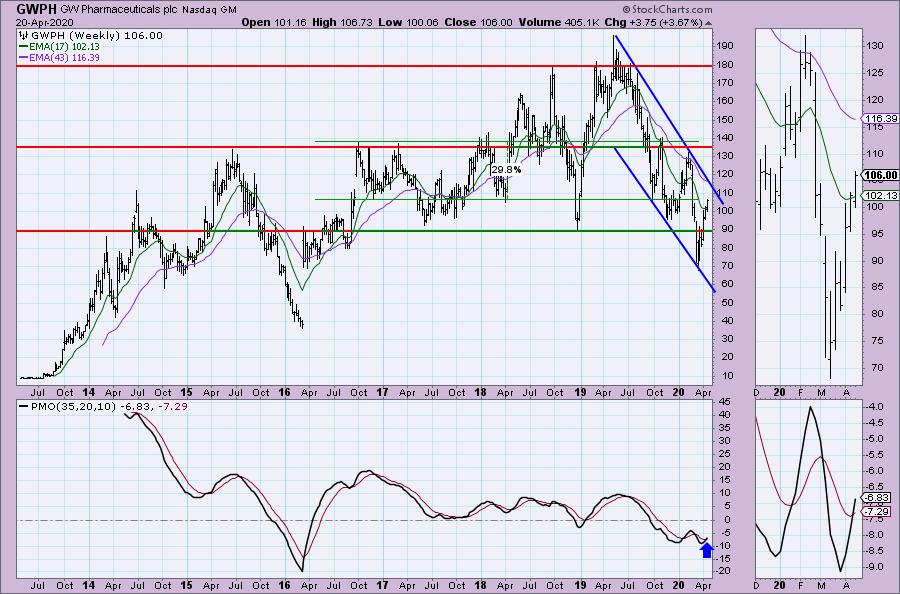
The weekly PMO has just triggered a BUY signal. I thought we might be looking at a declining trend channel. Instead it actually is a falling wedge which is bullish. My upside target would be around $135-$140.
Don't forget, on Thursdays I look at reader-requested symbols, so shoot me an email at erin@decisionpoint.com. I read every email I receive and try to answer them all!
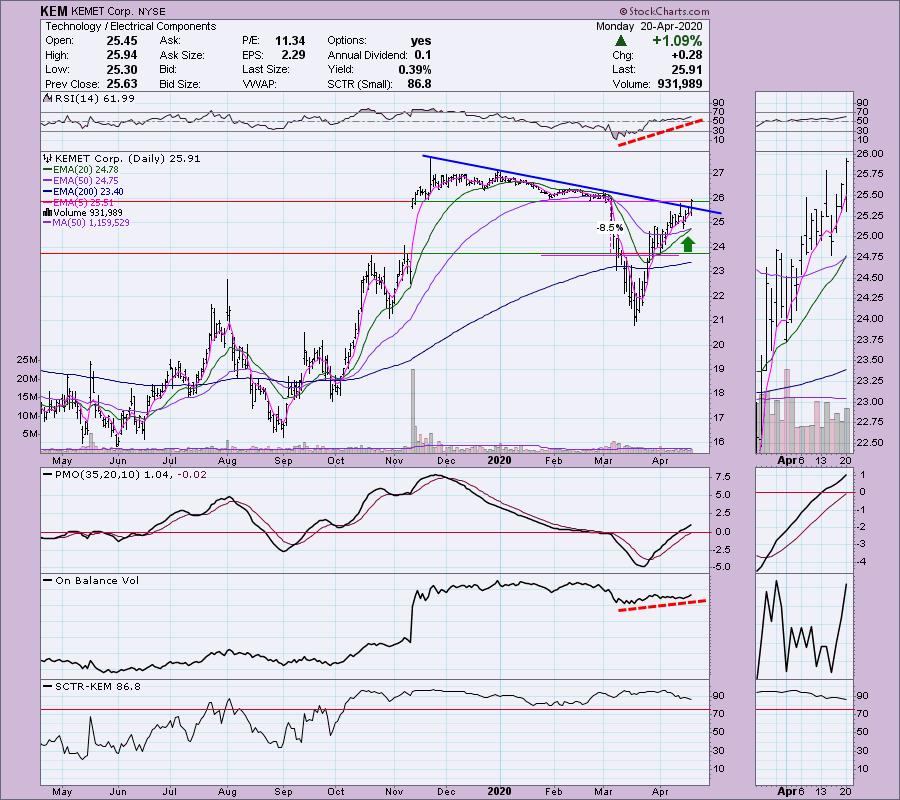
KEMET Corp (KEM) - Earnings: 5/14/2020 (BMO)
Today KEM had a nice breakout from a declining trend. It just had a Silver Cross IT Trend Model BUY signal. The RSI and OBV are trending higher. The PMO is rising and like the RSI, it isn't overbought. You can set a reasonable stop on this on just below $24 or even higher if you prefer.
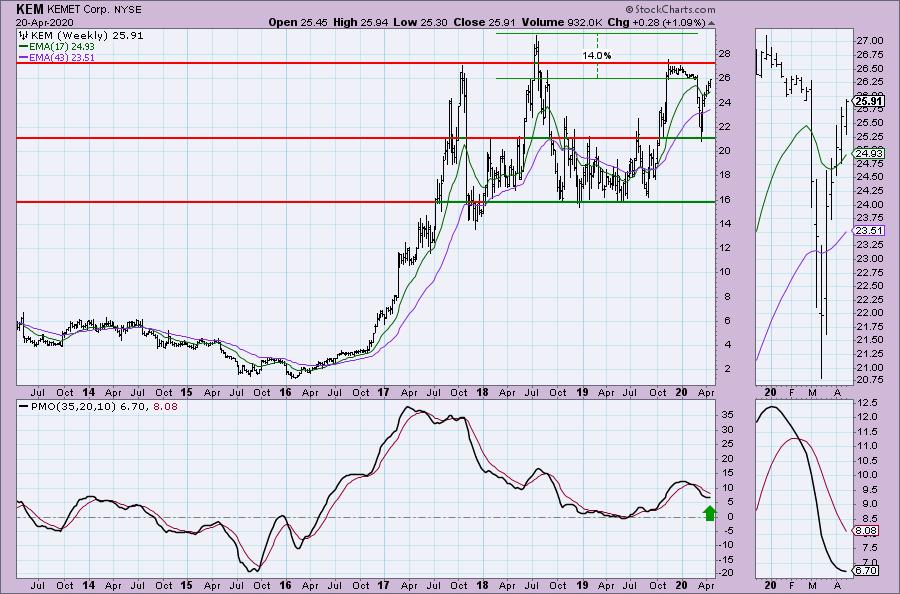
On the weekly chart, we can see that $27 could pose strong resistance as it matches up with not only the 2019 top, but additionally, the 2017 top. If it can bust through, right now upside potential is 14%.
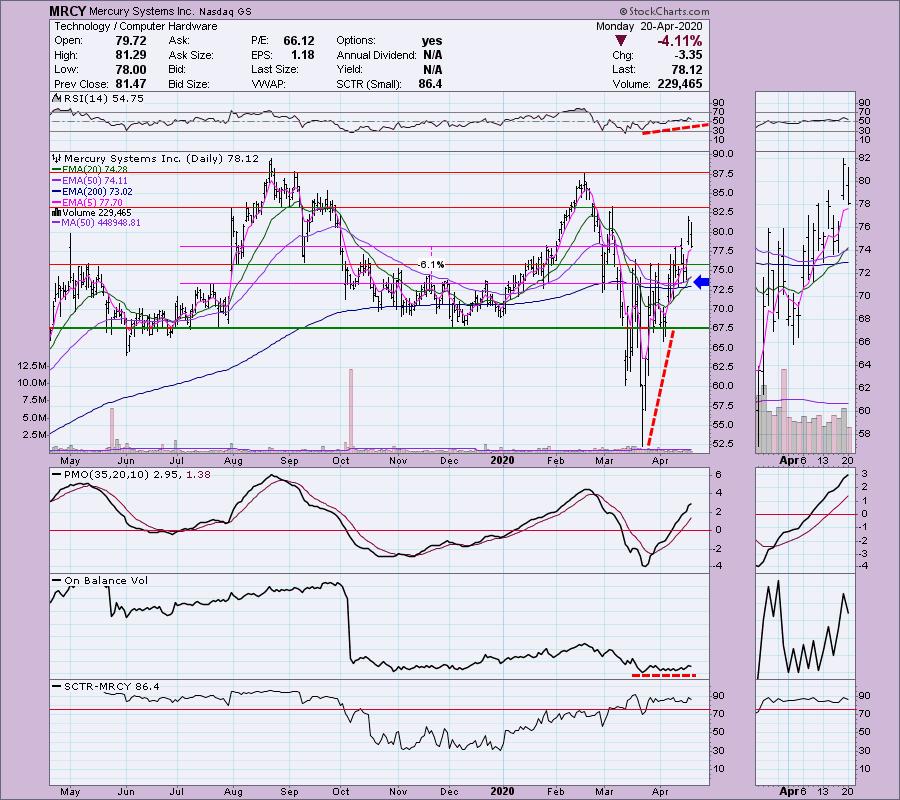
Mercury Systems Inc (MRCY) - Earnings: 4/28/2020 (AMC)
Today we saw a big pullback on MRCY which could make this one great for an entry if you like it. The OBV has a reverse divergence, flat lows on OBV matched to steep rising bottoms on price. Despite not having volume, price has pushed forward nonetheless. The PMO and RSI are both rising and not overbought. To top it off, we just had a Silver Cross IT Trend Model BUY signal. This is another that has a reasonable stop level.
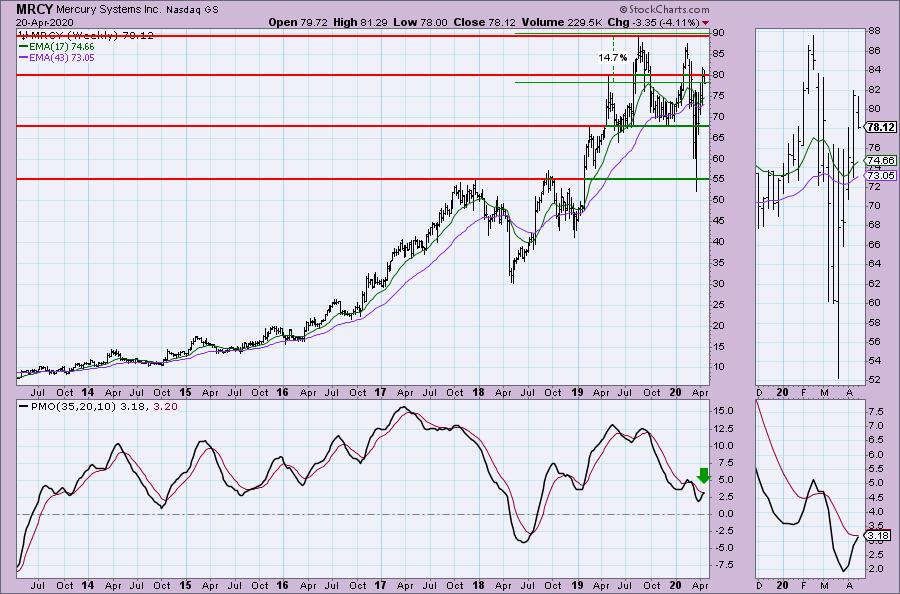
MRCY has been trading in a wide trading channel throughout 2019-2020. Price is right in the center of the range. The weekly PMO is near a BUY signal. It would be around 14.7% rise should price challenge all-time highs again.
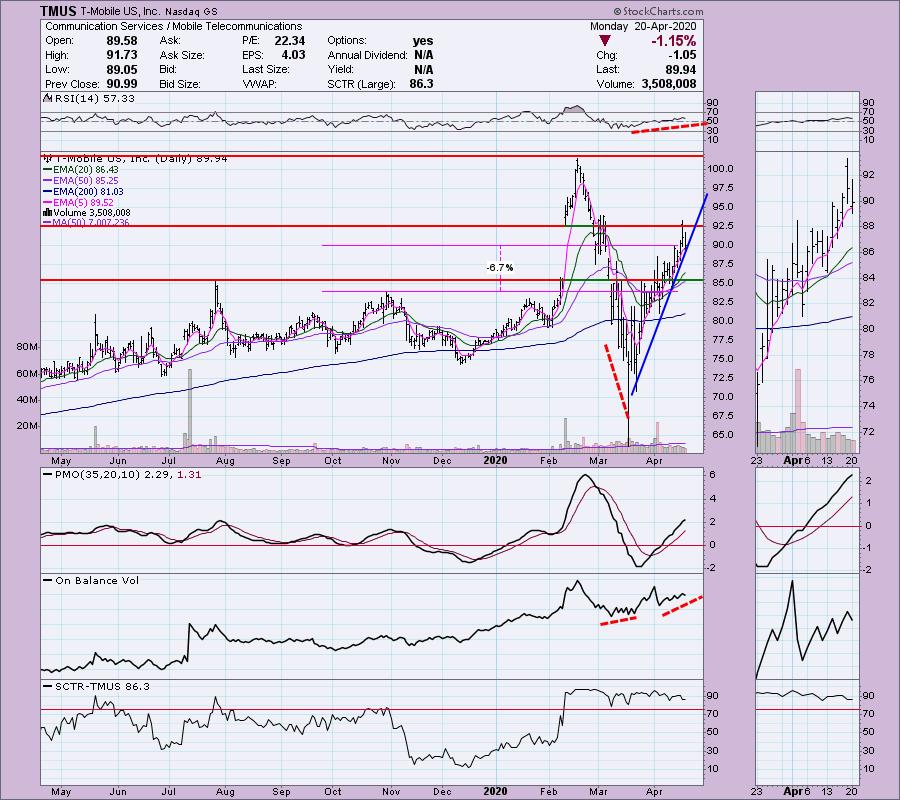
T-Mobile US Inc (TMUS) - Earnings: 5/4/2020 (AMC)
I wish I'd seen this chart sooner. It had a great positive divergence between the OBV rising bottoms and price declining lows that set up the "V" bottom beautifully. The pattern resolved to the upside once it hit the 38.2% retracement. It has now retraced over 50%. The expectation is a breakout above the left side of the V. The RSI and PMO are rising and are not overbought. You can set a reasonable stop at the October top or lower.
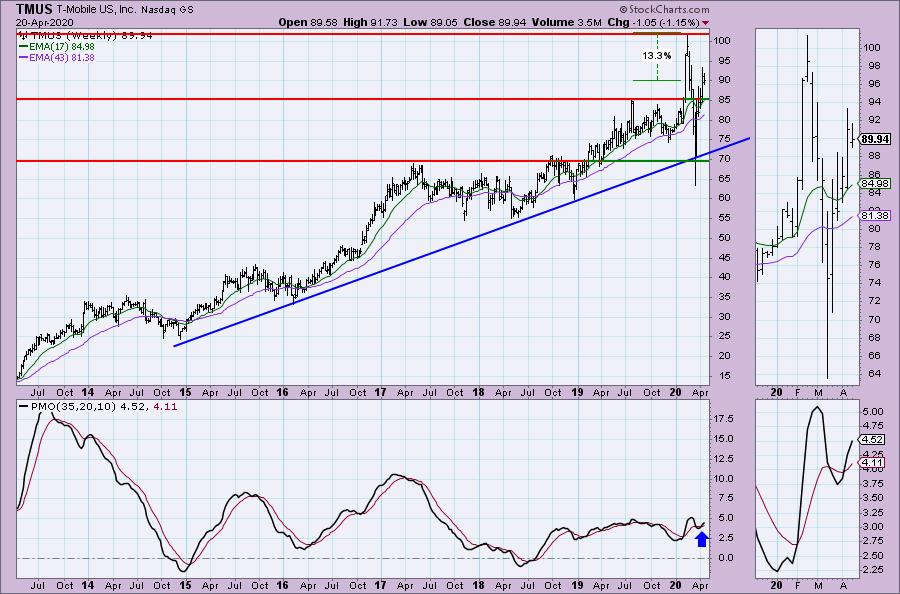
Upside target is the all-time high which is about 13.3% away from current price levels. Notice that TMUS never really lost its rising trend, even with the virus shocking the system. The PMO triggered a BUY signal last week.
Current Market Outlook:
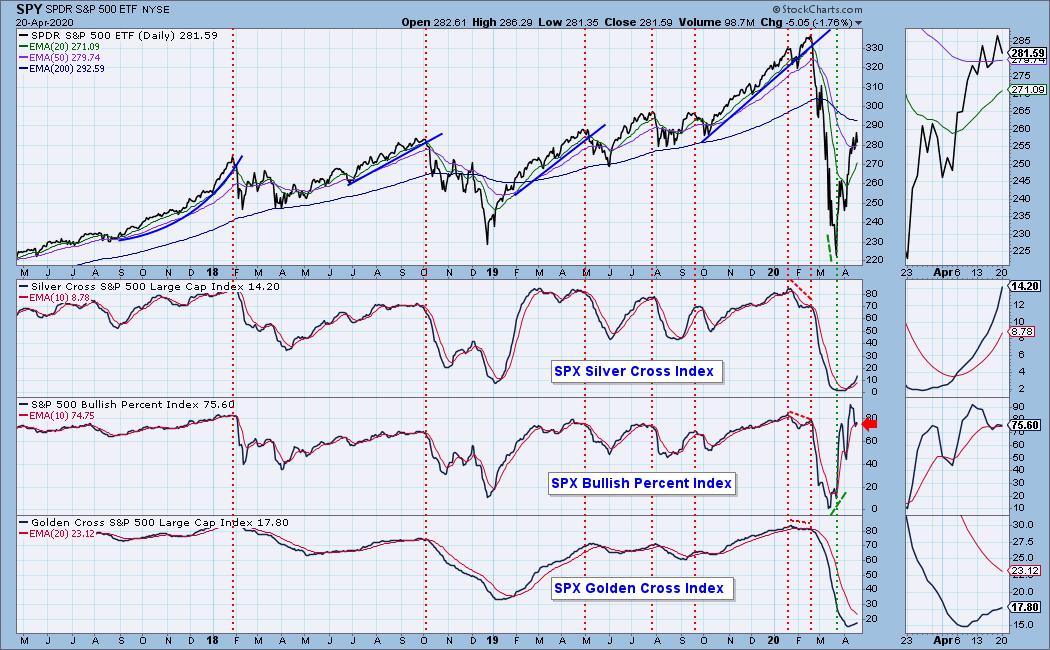
Market Environment: It is important to consider the odds for success. The Silver Cross Index measures the percentage of stocks on IT Trend Model BUY signals (20-EMA > 50-EMA), while the Golden Cross Index measures the percentage of stocks on LT Trend Model BUY signals (50-EMA > 200-EMA). Don't forget that as a "Diamonds" member, you have access to our GCI/SCI curated ChartList on DecisionPoint.com. You'll find it under "Members Only" links on the left side on the Blogs and Links Page. Here are the current percentages on the Silver and Golden Cross Indexes:
Diamond Index:
- Diamond Scan Results: 1
- Diamond Dog Scan Results: 15
- Diamond Bull/Bear Ratio: 0.07
For a more comprehensive review of current market conditions as well as analysis of Dollar, Gold, Oil and Bonds, subscribe to the DecisionPoint Alert! For a LIMITED TIME you can get a coupon code that will give you a discount for bundling your Diamonds subscription with the DecisionPoint Alert! Contact support@decisionpoint.com for more details.
Full Disclosure: I do not own any of the stocks above and I'm currently 20% in cash. My trading timeframe has moved from intermediate-term to short-term and therefore I'm investing more. It is strange to be this invested in a bear market, but the indicators and scans have so far protected me from peril.

Erin Swenlin will be presenting at the The MoneyShow Las Vegas August 16 - 20 at Bally's/Paris Resort! You'll have an opportunity to meet Erin and discuss the latest DecisionPoint news and Diamond Scans. Claim your FREE pass here! You can watch online with this pass too!! There will be online events held in May and when I have more information I'll let you know.
Watch the latest episode of DecisionPoint with Carl & Erin Swenlin LIVE on Wednesdays 5:00p EST or on the StockCharts TV YouTube channel here!
Technical Analysis is a windsock, not a crystal ball.
Happy Charting!
- Erin
erinh@stockcharts.com
NOTE: The stocks reported herein are from mechanical trading model scans that are based upon moving average relationships, momentum and volume. DecisionPoint analysis is then applied to get five selections from the scans. The selections given should prompt readers to do a chart review using their own analysis process. This letter is not a call for a specific action to buy, sell or short any of the stocks provided. There are NO sure things or guaranteed returns on the daily selection of "diamonds in the rough."
Helpful DecisionPoint Links:
DecisionPoint Shared ChartList and DecisionPoint Chart Gallery
Price Momentum Oscillator (PMO)
Swenlin Trading Oscillators (STO-B and STO-V)
For more links, go to DecisionPoint.com!