
The market has been punched in the gut and it has taken with it some stocks in defensive groups. I still am a fan of Health Care space and Utilities (you'll see a few below), but I did find some interesting plays within Software and Discretionary. Should the coronavirus become a major problem, defensive industries should hold up for the most part, but prepare yourself for more volatility. I covered Costco (COST) last Thursday and, today, I'm checking in on Microsoft. Some of these charts were surprising as the companies haven't been hit quite as hard and are maintaining rather than deflating in some cases. I'm still not looking to add any positions and Carl made a great point in last Friday's Weekly Wrap:
While bear market rallies present great profit opportunities, long positions should be managed in the short-term. - Carl Swenlin
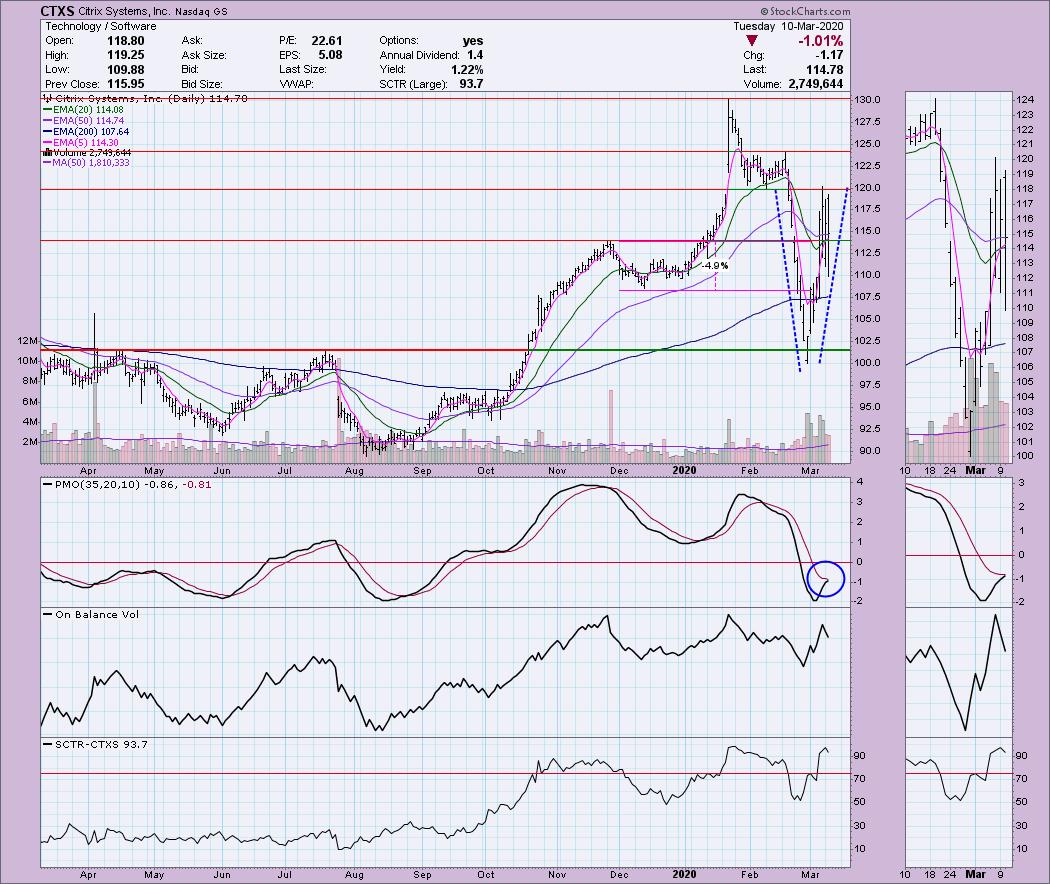
Citrix Systems Inc (CTXS) - Earnings: 4/22/2020 (AMC)
This one came up on Carl's Scan today. It is the company that brings you "GoToMeeting" so some say it is poised to do well during coronavirus quarantines. Of course there are also Zoom (ZM) and Slack (WORK) which work in a similar way. I found that the PMOs on both of those other companies just slipped into SELL signals in overbought territory, so I liked this one as it is showing increased momentum and a possible BUY signal soon. I'm not thrilled that on a big day in the market, it slipped. However we are looking at a bullish "V" bottom and a SCTR in the "hot zone" above 75.
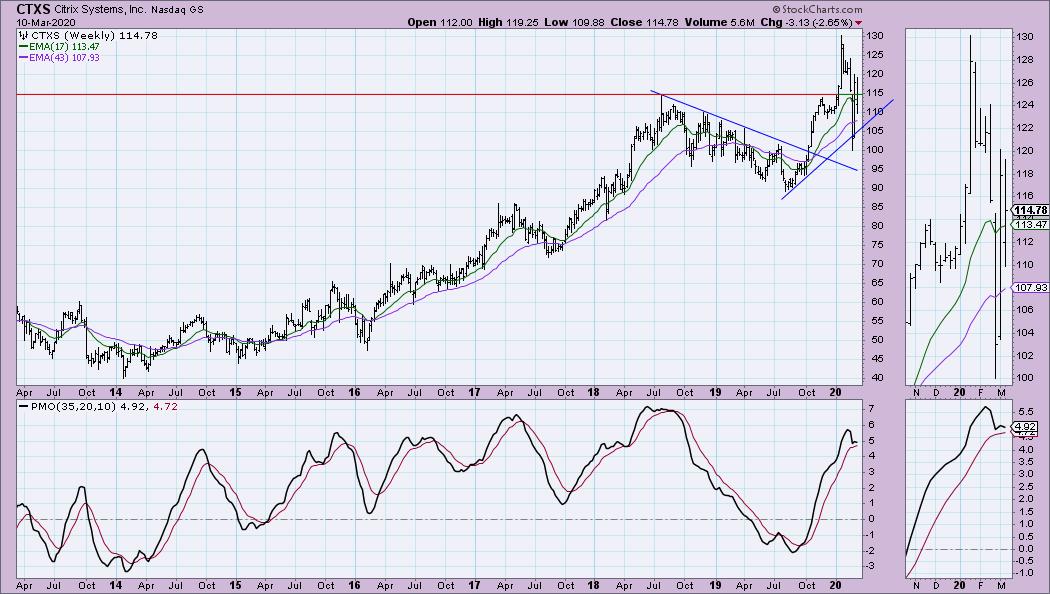
The weekly PMO did top. With all of the volatility, it is nice to see that it is still on a BUY signal and making an attempt to recover. The $115 level is very important and price is sitting on it right now. A close to the upside tomorrow would be a great sign, otherwise it may require a little more waiting and a test of the 43-week EMA.
Welcome to DecisionPoint Daily Diamonds, wherein I highlight five "diamonds in the rough." These are selected from the results of my DecisionPoint scans, which search for stocks that could benefit from the trend and condition of the market. Remember, these are not recommendations to buy or sell, but are the most interesting of the stocks that surfaced in my scans. My objective is to save you the work of the initial, tedious culling process, but you need to apply your own analysis to see if these stocks pique your interest as well. There are no guaranteed winners here!
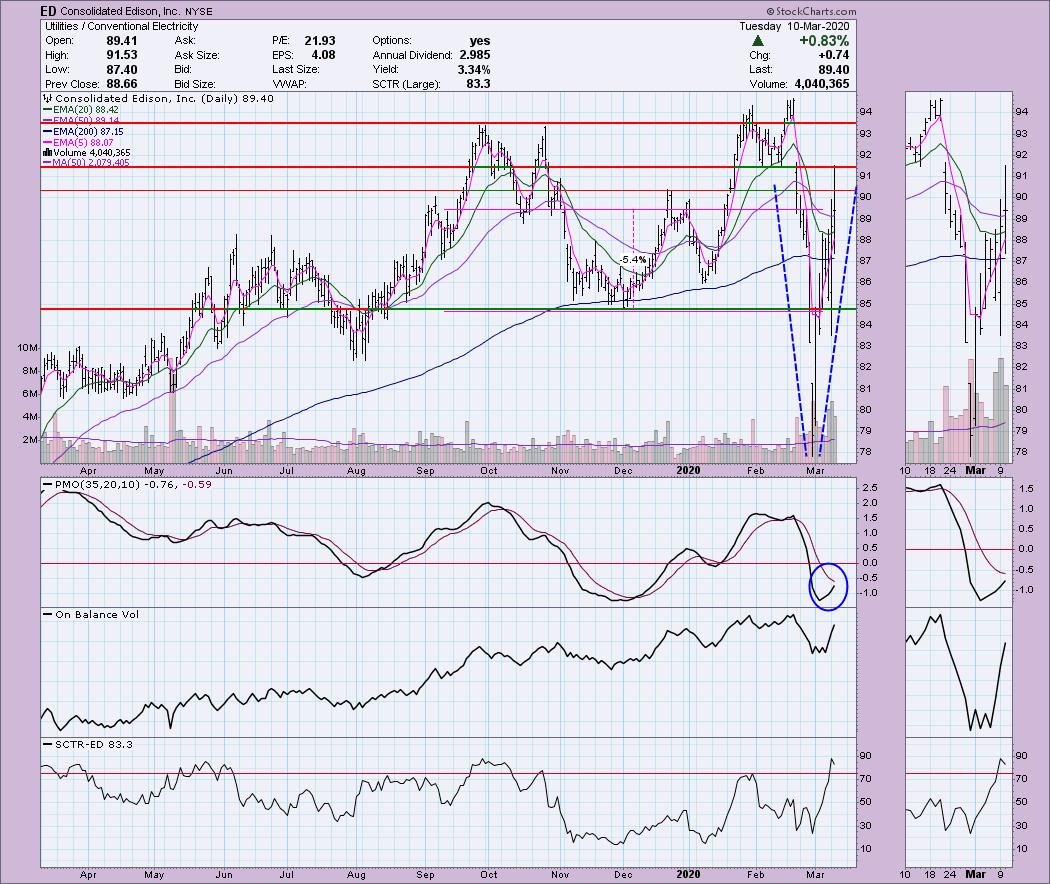
Consolidated Edison Inc (ED) - Earnings: 4/30/2020 (AMC)
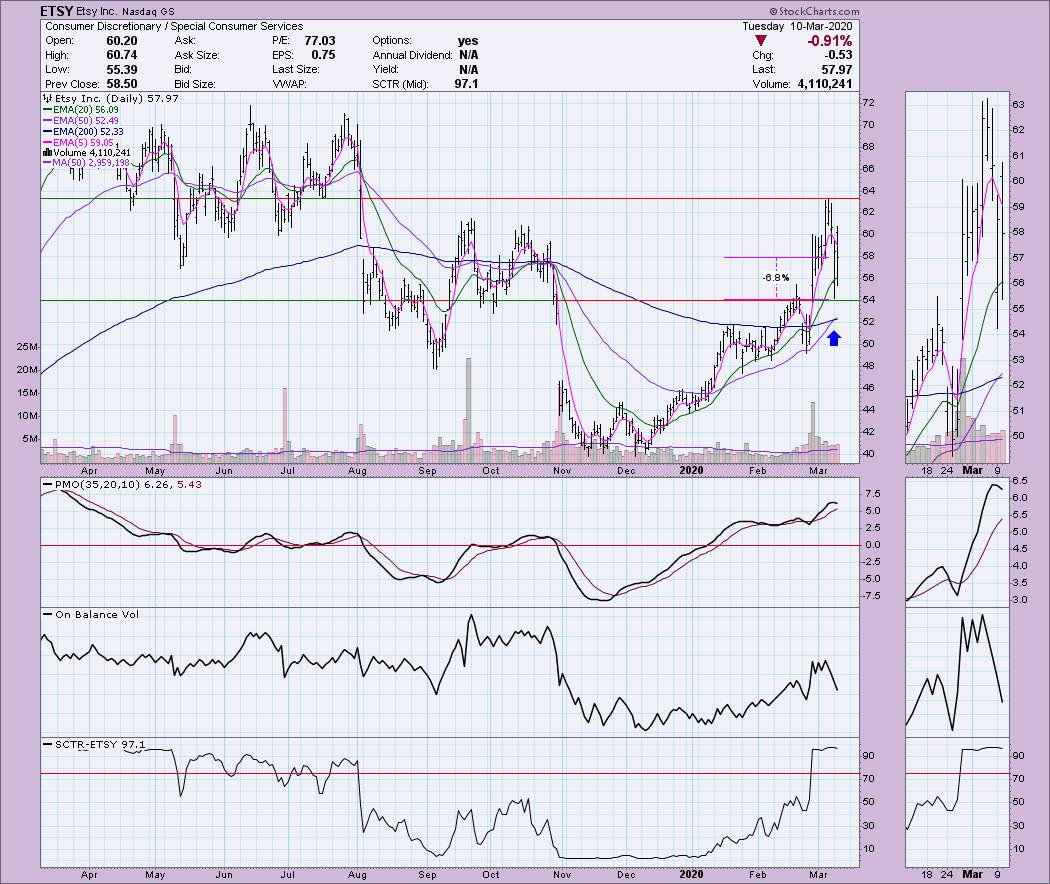
The volatility right now is crazy which is why I am on the sidelines except for a few defensive positions. Overall, despite the volatility, we have a PMO rising and almost on a BUY signal. There is a bullish "V" bottom and volume is coming in. The SCTR reached the "hot zone". Remember that I use a pink percentage line to give you thoughts on where I would be looking to set a stop.
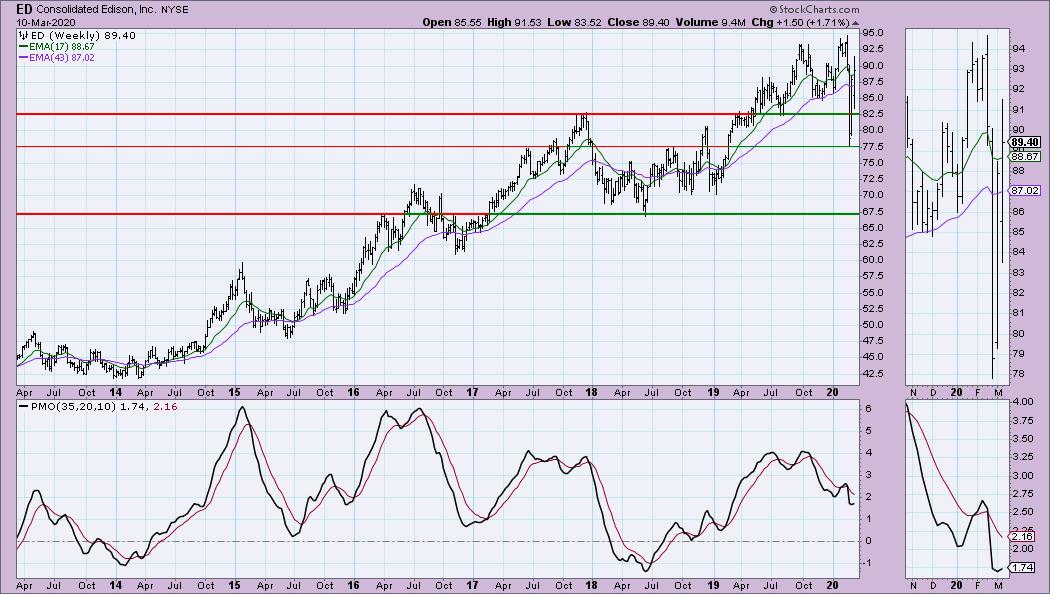
The weekly PMO has turned up and price is back above the 2017 high.
Don't forget, on Thursdays I look at reader-requested symbols, so shoot me an email at erin@decisionpoint.com. I read every email I receive and try to answer them all!
Etsy Inc (ETSY) - Earnings: 5/7/2020 (AMC)
Many of you may remember my recommendation of ETSY on MarketWatchers LIVE a looooong time ago. At the time it was in the low 20s. It's probably one of my most famous picks as I still hear from viewers of the now defunct show thanking me so much for pointing it out. Today it came up on my 50/200-EMA crossover scan. We are seeing ETSY move out of a bear market configuration into a bull market. This is a shop at home business that provides small companies or even individuals a marketplace to sell their crafts, etc. I think a stop on this one just under $54 should protect you from a volatile move, but you could move to $52 (200-EMA) or even $48 depending on your risk profile.
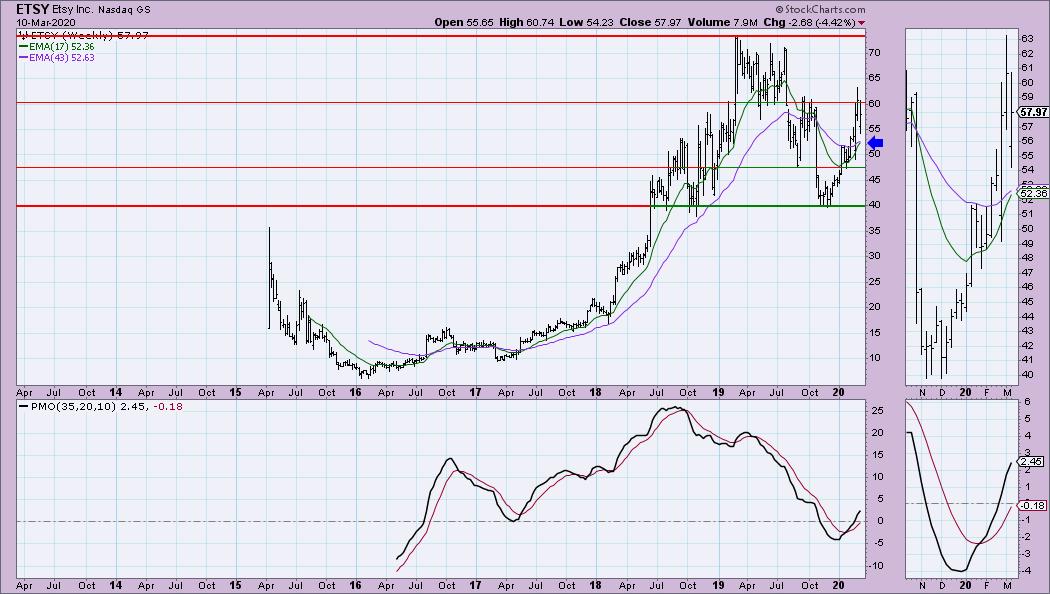
I really like this weekly chart given the PMO BUY signal in oversold territory and the steady rise. The 17/43-week EMAs are also nearing a positive crossover.
Milestone Pharmaceuticals Inc (MIST) - Earnings: 5/1/2020 (BMO)
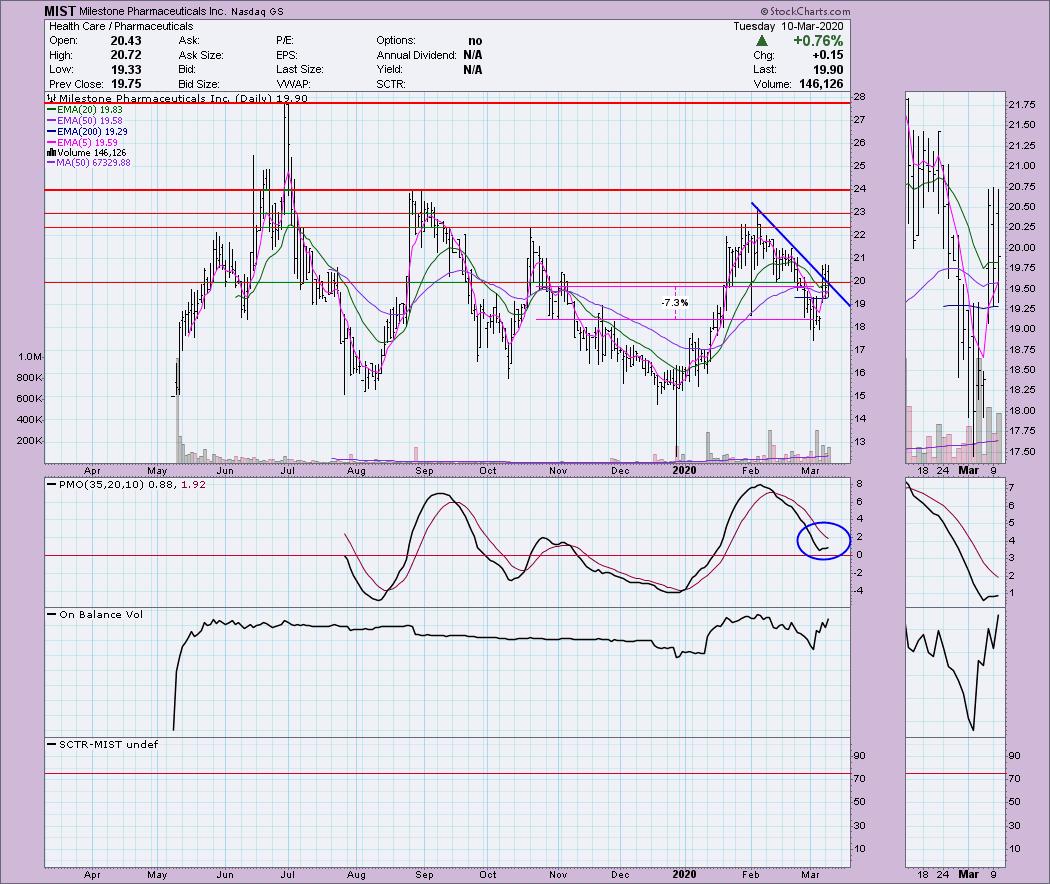
Price has been attempting to breakout in a meaningful way from the declining trend. Currently price is sitting on the trendline. It closed above the 20-EMA which is positive and the last three days of trading have been most above the 200-EMA. It's certainly in an interesting industry group right now. The PMO is rising and turned up above the zero line which implies internal strength. The OBV is confirming the upside move.
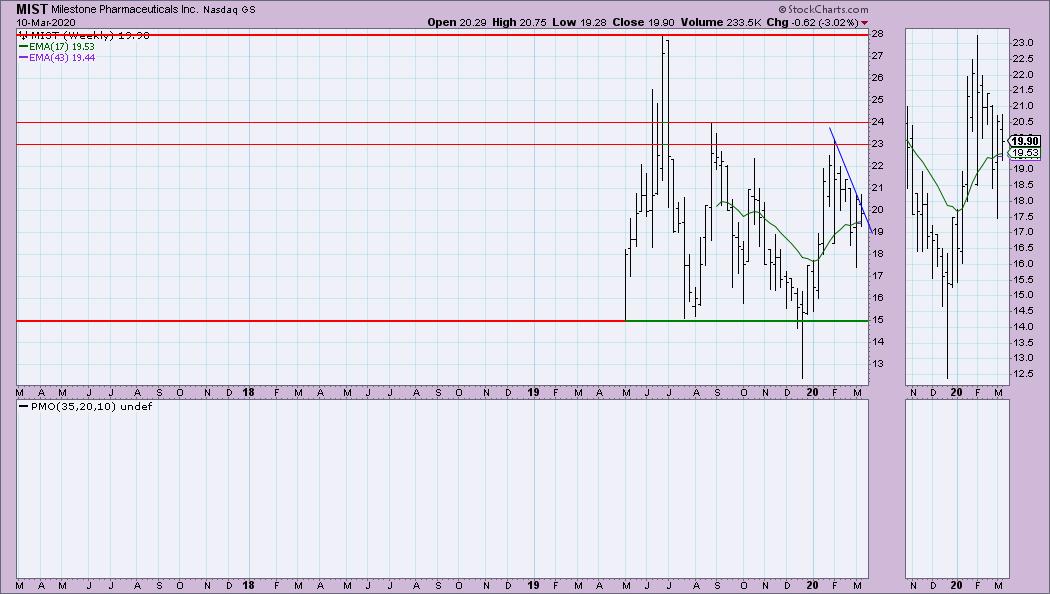
We don't have enough data on this one for a good weekly chart, but I think it does highlight the attempt to break from the declining trend.
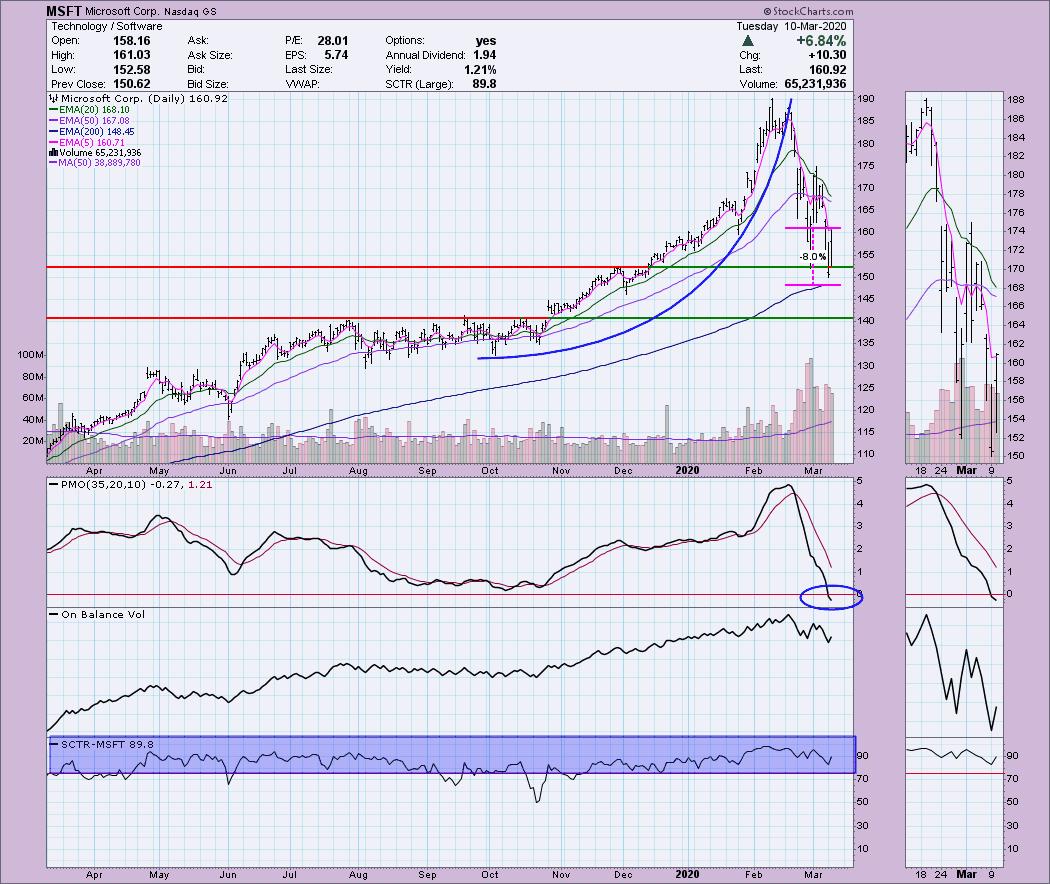
Microsoft Corp (MSFT) - Earnings: 4/22/2020 (AMC)
This one has been a topic of conversation on the business channels the past few days. It revolves around taking advantage of bargain basement prices. Well, I think we may be on the first floor, not quite in the basement. I do think this chart is interesting though. We had basically a parabolic move and swift breakdown. It broke down nearly to the 'basing' pattern between $135 and $140. It could move lower and test the $140 level, but if you wanted to get in, you'd want to set a stop certainly just below $140 if not higher, again depending on your risk tolerance. The PMO hasn't responded and is continuing lower. I'm watching this one for a PMO bottom first.
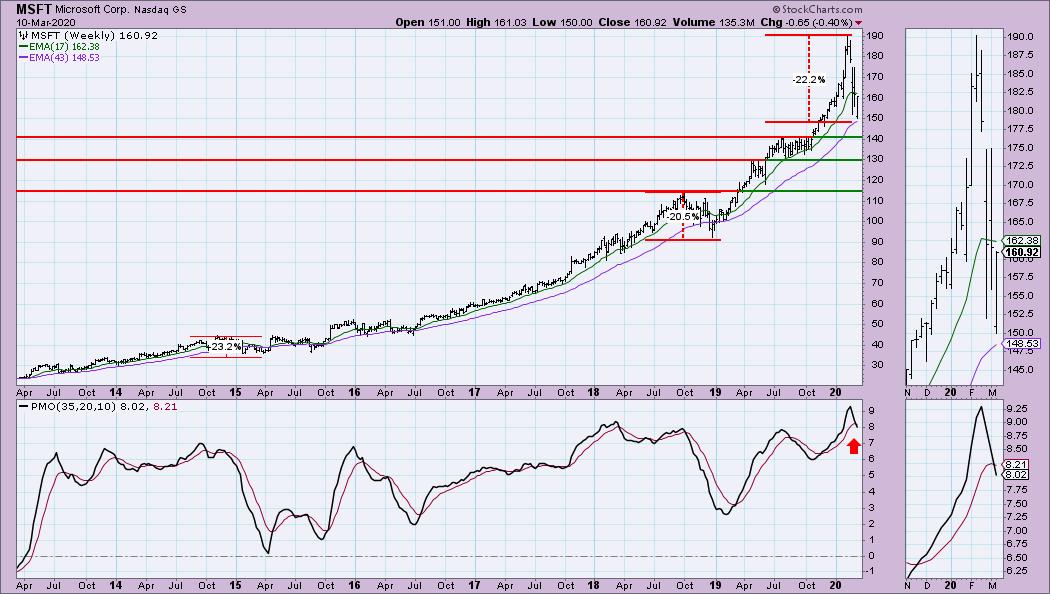
As far as being a "bargain", you could certainly make a case for it. The last two big corrections put price down 20-23% and that is where we are now. The weekly PMO is awful though. The $140 level looks especially enticing to me rather than where price is at now.
Current Market Outlook:
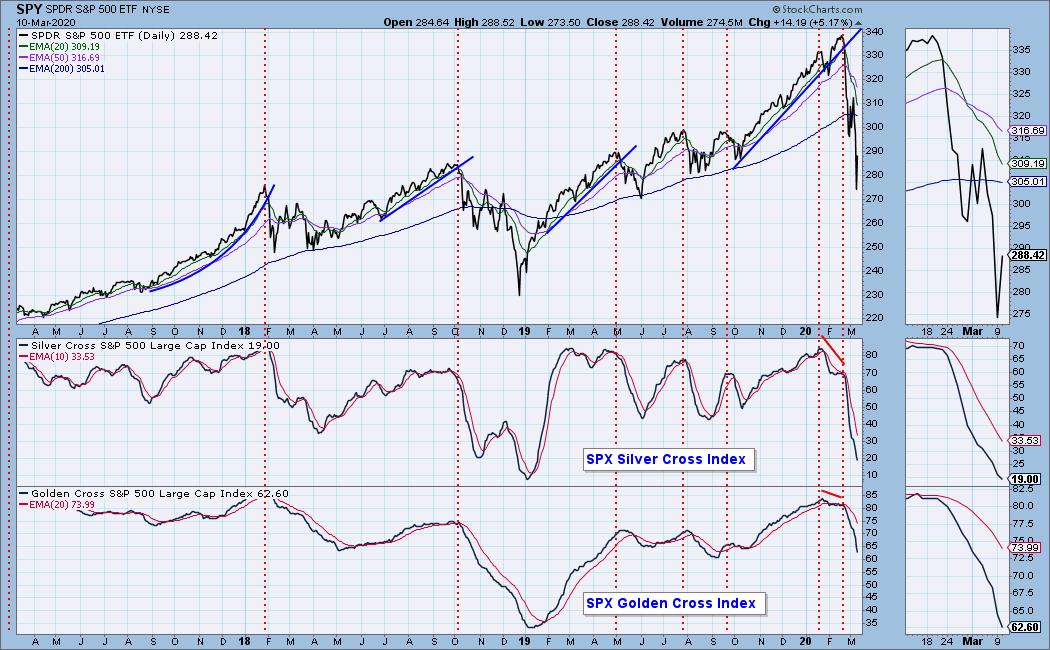
Market Environment: It is important to consider the odds for success. The Silver Cross Index measures the percentage of stocks on IT Trend Model BUY signals (20-EMA > 50-EMA), while the Golden Cross Index measures the percentage of stocks on LT Trend Model BUY signals (50-EMA > 200-EMA). Don't forget that as a "Diamonds" member, you have access to our GCI/SCI curated ChartList on DecisionPoint.com. You'll find it under "Members Only" links on the left side on the Blogs and Links Page. Here are the current percentages on the Silver and Golden Cross Indexes:
Diamond Index:
- Diamond Scan Results: 0
- Diamond Dog Scan Results: 4
- Diamond Bull/Bear Ratio: 0.00
For a more comprehensive review of current market conditions as well as analysis of Dollar, Gold, Oil and Bonds, subscribe to the DecisionPoint Alert! For a LIMITED TIME you can get a coupon code that will give you a discount for bundling your Diamonds subscription with the DecisionPoint Alert! Contact support@decisionpoint.com for more details.
Full Disclosure: I do not own any of the stocks above, but am considering a few small positions. I'm currently 60% in cash.

Erin Swenlin will be presenting at the The MoneyShow Las Vegas May 11-13, 2020! You'll have an opportunity to meet Erin and discuss the latest DecisionPoint news and Diamond Scans. Claim your FREE pass here! You can watch online with this pass too!!
Watch the latest episode of DecisionPoint with Carl & Erin Swenlin LIVE on Mondays 5:00p EST or on the StockCharts TV YouTube channel here!
Technical Analysis is a windsock, not a crystal ball.
Happy Charting!
- Erin
erinh@stockcharts.com
NOTE: The stocks reported herein are from mechanical trading model scans that are based upon moving average relationships, momentum and volume. DecisionPoint analysis is then applied to get five selections from the scans. The selections given should prompt readers to do a chart review using their own analysis process. This letter is not a call for a specific action to buy, sell or short any of the stocks provided. There are NO sure things or guaranteed returns on the daily selection of "diamonds in the rough."
Helpful DecisionPoint Links:
DecisionPoint Shared ChartList and DecisionPoint Chart Gallery
Price Momentum Oscillator (PMO)
Swenlin Trading Oscillators (STO-B and STO-V)
For more links, go to DecisionPoint.com!