
Today Carl's Scan turned out 46 scan results. I decided to look specifically for On-Balance Volume positive divergences. This means that upside volume is holding up despite record declines. Many times these divergences will appear at a price low and signal that the stock is ripe for a rally. In this market environment, seeing stocks that haven't seen huge panic volume or at least aren't seeing volume deteriorate on declines is encouraging. I am still not adding new positions. I suspect we will see another rally if and when the stimulus bill is passed, but if we continue to see record new unemployment, among other negative economic factors, I would consider it temporary.
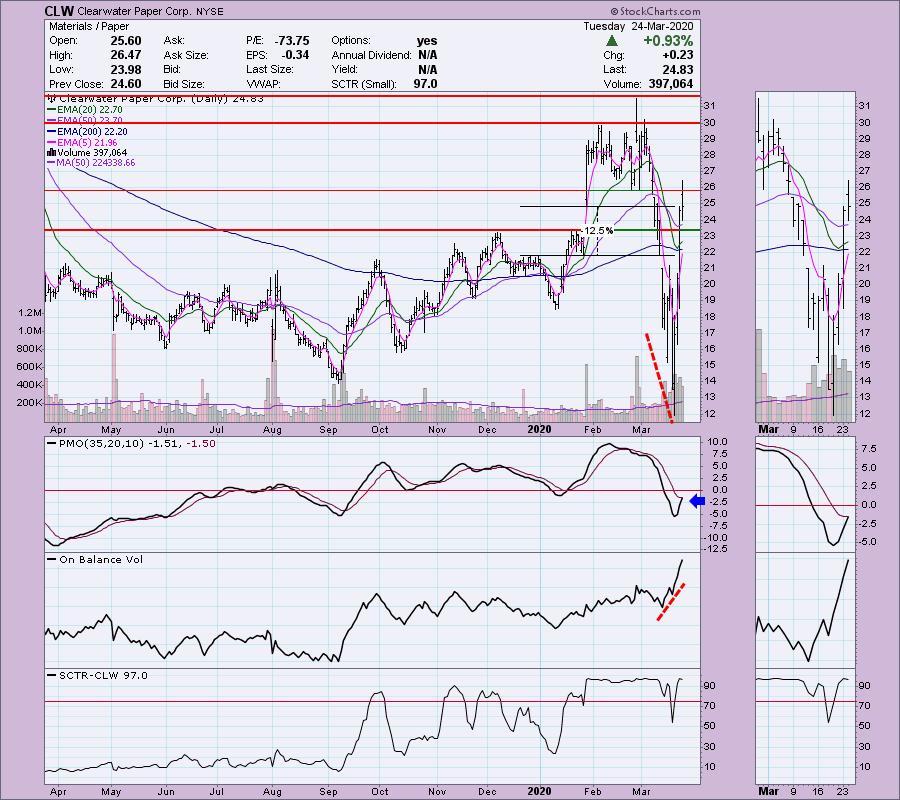
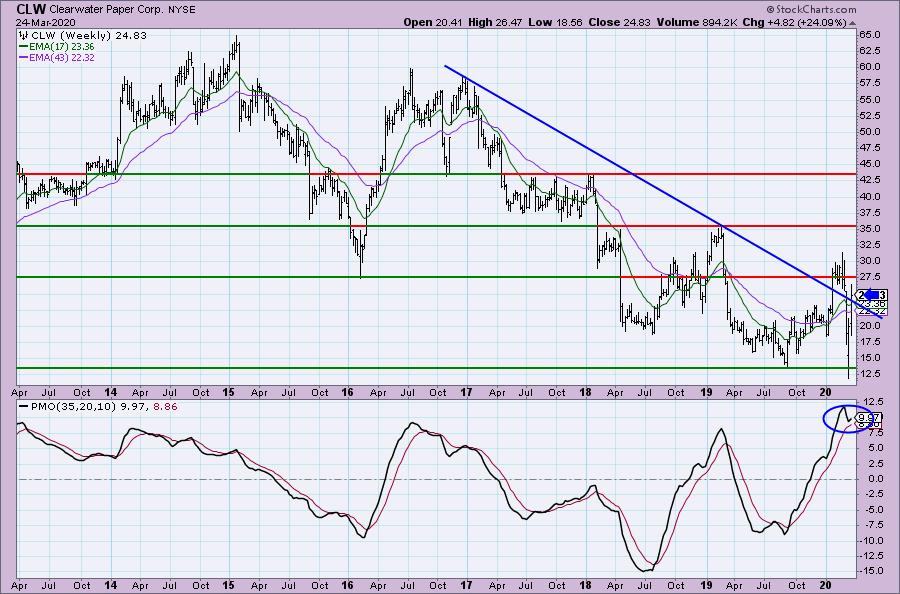
Clearwater Paper Corp (CLW) - Earnings: 4/29/2020 (AMC)
The OBV positive divergence is excellent. I am a little concerned we may've gotten the rally off that low. However, the soaring volume the last 4 days of trading is encouraging. The PMO has just about triggered a BUY signal and the SCTR is excellent with a reading in the high 90's.
This giant rally off the low has managed to turn the weekly PMO back up. It is on the overbought side. We have another breakout from the long-term declining trend. Looking at the numbers though, this stock is up over 24% so far this week. That's some serious volatility and a possible drag on the continuation of this current rally.
Welcome to DecisionPoint Daily Diamonds, wherein I highlight five "diamonds in the rough." These are selected from the results of my DecisionPoint scans, which search for stocks that could benefit from the trend and condition of the market. Remember, these are not recommendations to buy or sell, but are the most interesting of the stocks that surfaced in my scans. My objective is to save you the work of the initial, tedious culling process, but you need to apply your own analysis to see if these stocks pique your interest as well. There are no guaranteed winners here!
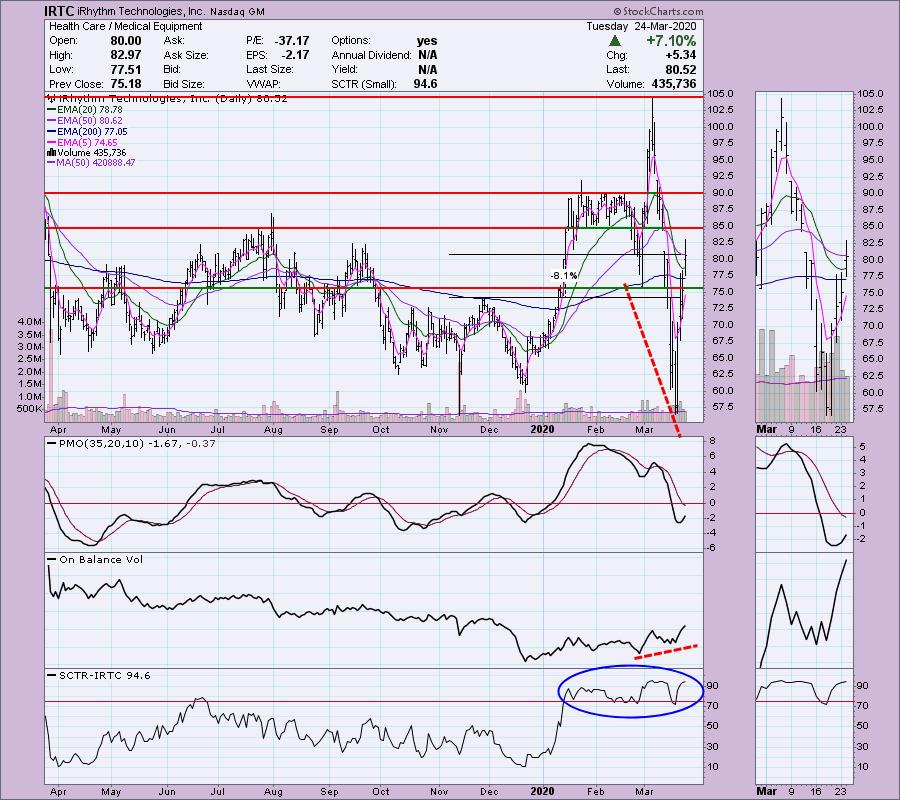
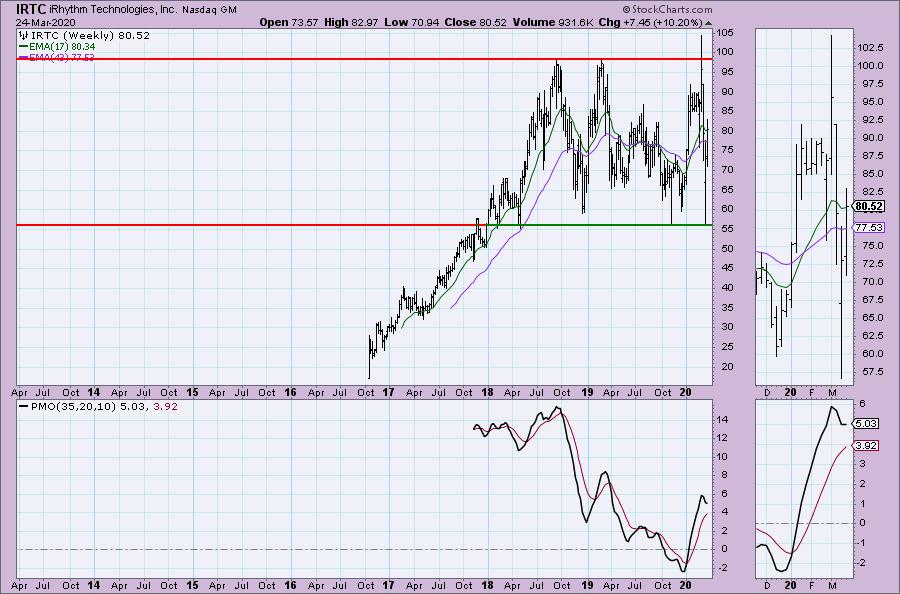
iRythm Technologies Inc (IRTC) - Earnings: 5/5/2020 (AMC)
A PMO bottoming in oversold territory is always encouraging. Note the significant OBV positive divergence. I think you could also look at this as a bullish "V" bottom pattern. Unfortunately, I play by 'bear market rules' and that does tell us to expect bearish conclusions to chart patterns. At least one could set a fairly tight stop. With the volatility setting stops on any stock is tricky which is why I'm not comfortable getting back in just yet.
The PMO has stalled its decline and it is not at all overbought. We are in the smack dab in the middle of a wide trading range, so the risk of decline is still very high.
Don't forget, on Thursdays I look at reader-requested symbols, so shoot me an email at erin@decisionpoint.com. I read every email I receive and try to answer them all!
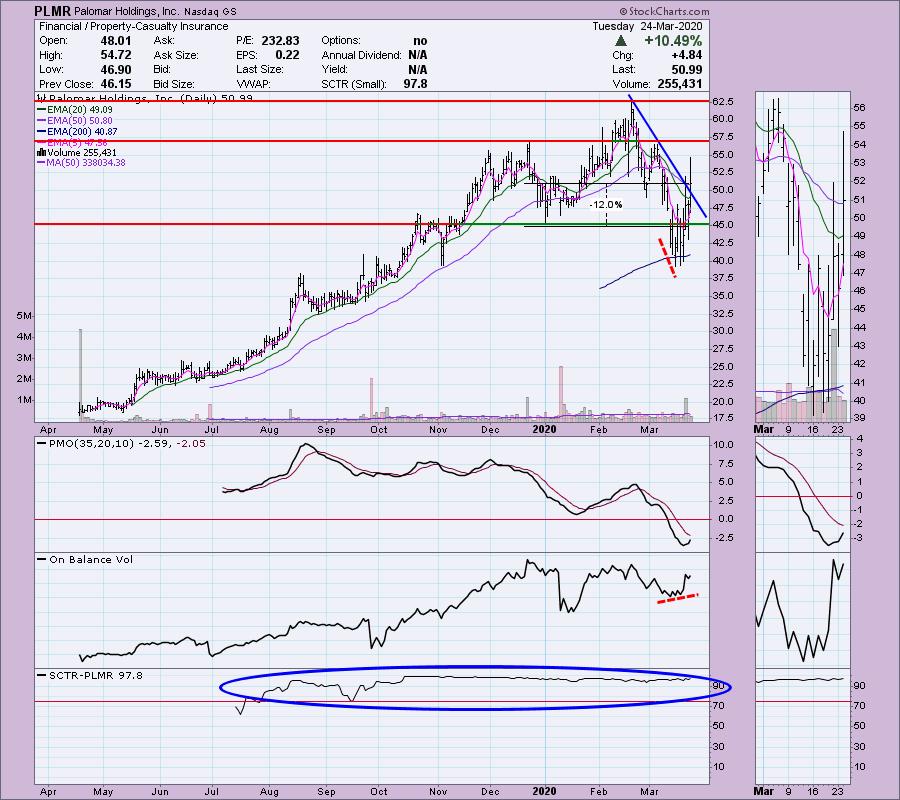
Palomar Holdings Inc (PLMR) - Earnings: 5/14/2020 (AMC)
I'm not a fan of this area of the market (insurance), but this stock has held up very well. A stop at 12% is doable. The OBV shows a nice positive divergence and the PMO is rising out of oversold territory.
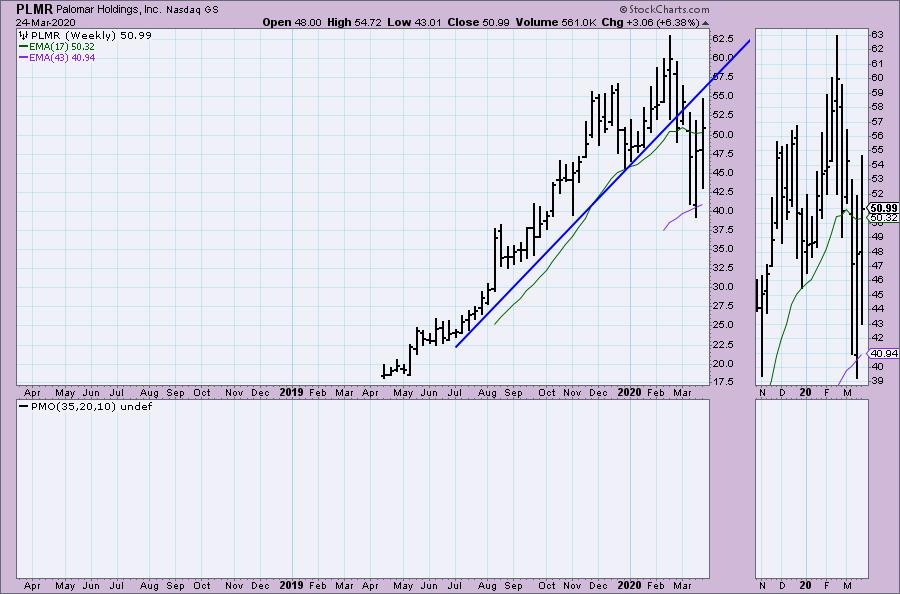
Not much data on the weekly chart since it doesn't have the historic data to calculate the PMO. I do note that price closed up above the 17-week EMA and seems to have successfully tested the 43-week EMA.
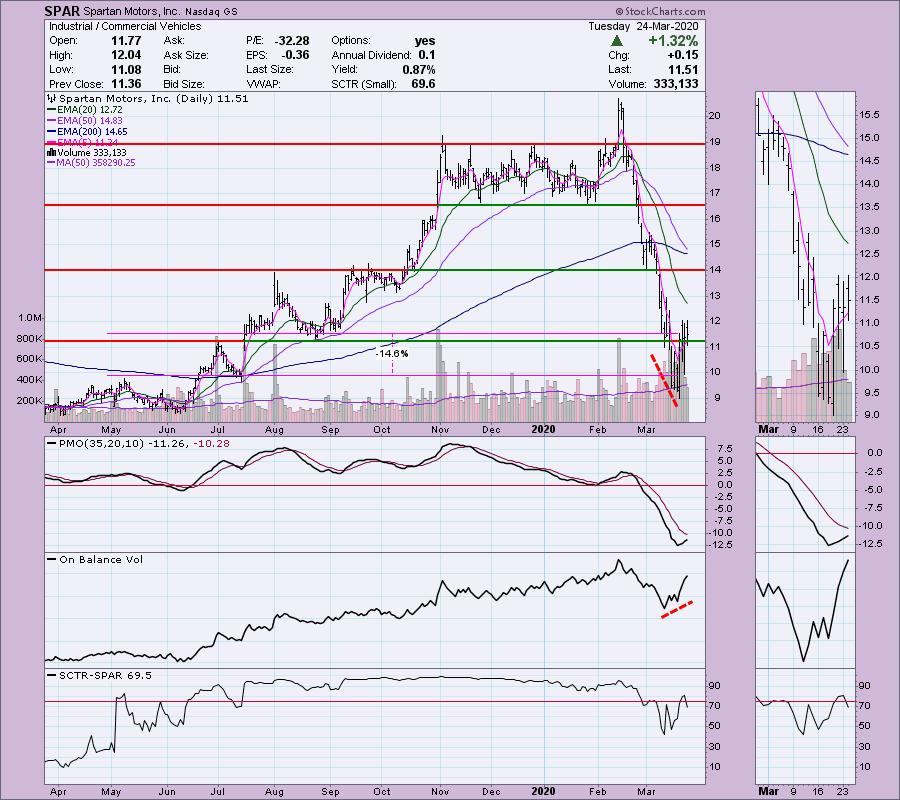
Spartan Motors Inc (SPAR) - Earnings: 4/30/2020 (BMO)
I'm a fan of the commercial transportation industry group right now. I pointed out Truckers last week and they have seen quite a bit of success since then. This will be a robust area of the market even in virus times given the need to move goods quickly and efficiently across the country to keep shelves stocked, etc. The positive OBV is nice and notice we still have plenty of upside potential as it hasn't exploded to the upside as some of the others.
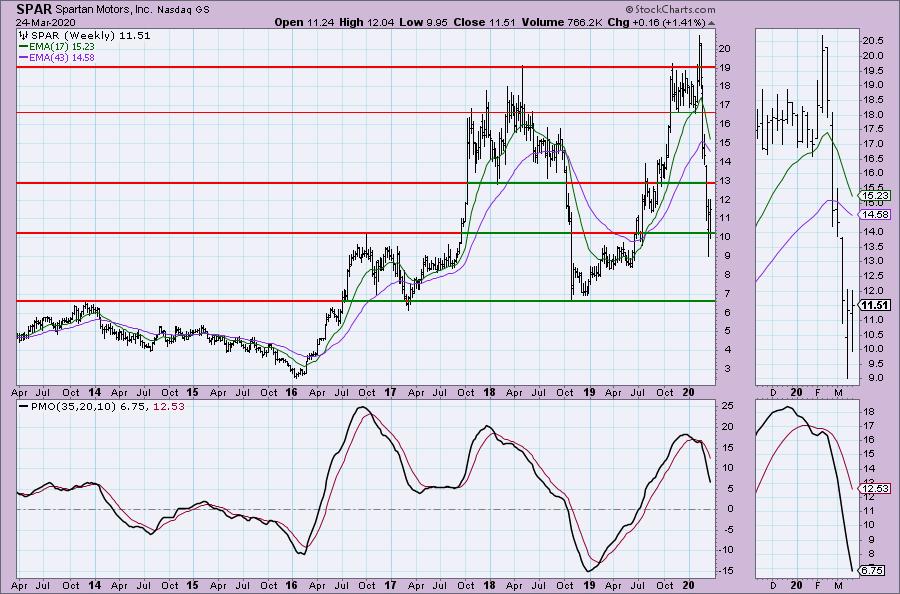
The weekly chart isn't that favorable. The weekly PMO is in free fall, but that could improve if price can continue to rise off the $10 support area. However, very strong support at $6.50 could end up being tested. I wouldn't want it if it goes lower than $9, but not sure I want to get in right now and get stopped out too soon.
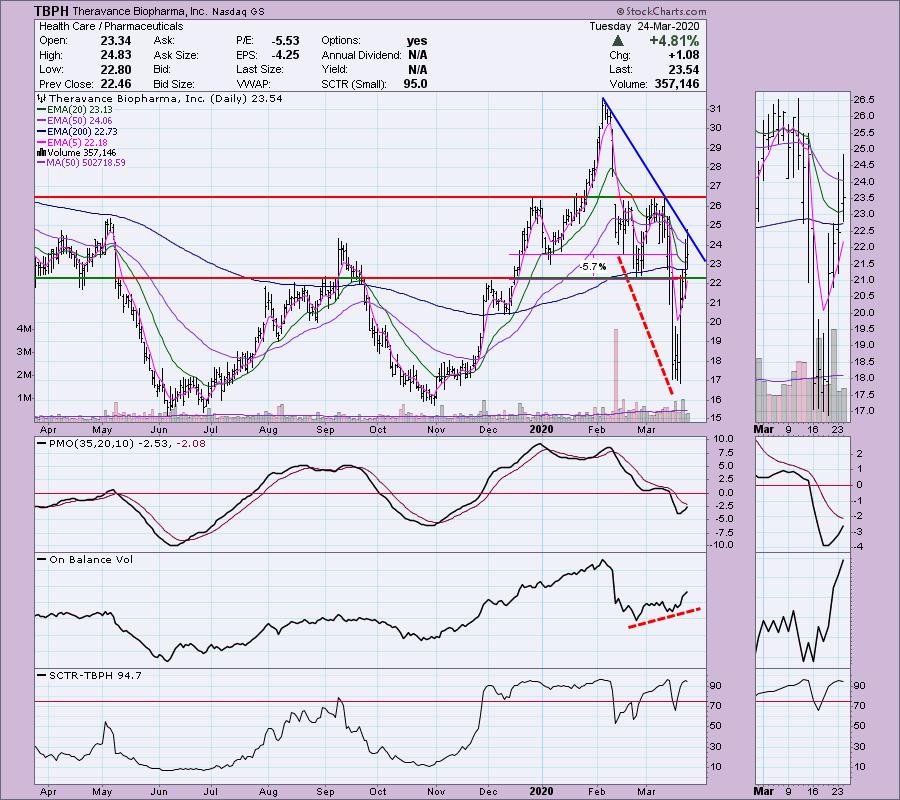
Theravance Biopharma Inc (TBPH) - Earnings: 5/5/2020 (AMC)
Pharma has actually been very hit and miss throughout this crisis. This one has the power of a strong positive divergence with the OBV. The SCTR is incredibly high and the PMO has turned up before reaching oversold extremes. I believe this speaks to relative strength.
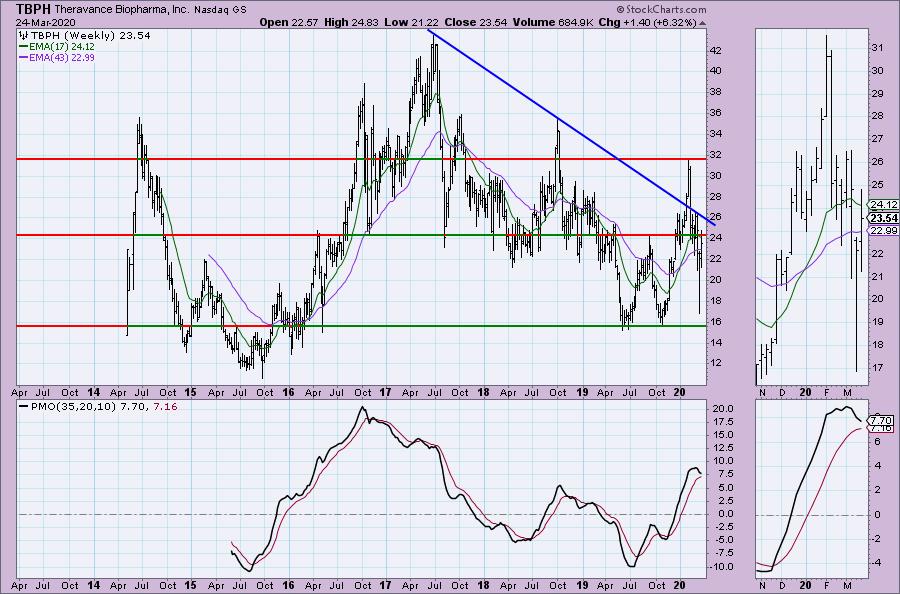
Another meh weekly chart. We need to see the $24 level broken and held. Currently price is back into a declining trend. The weekly PMO may be decelerating, but the configuration is negative.
Current Market Outlook:
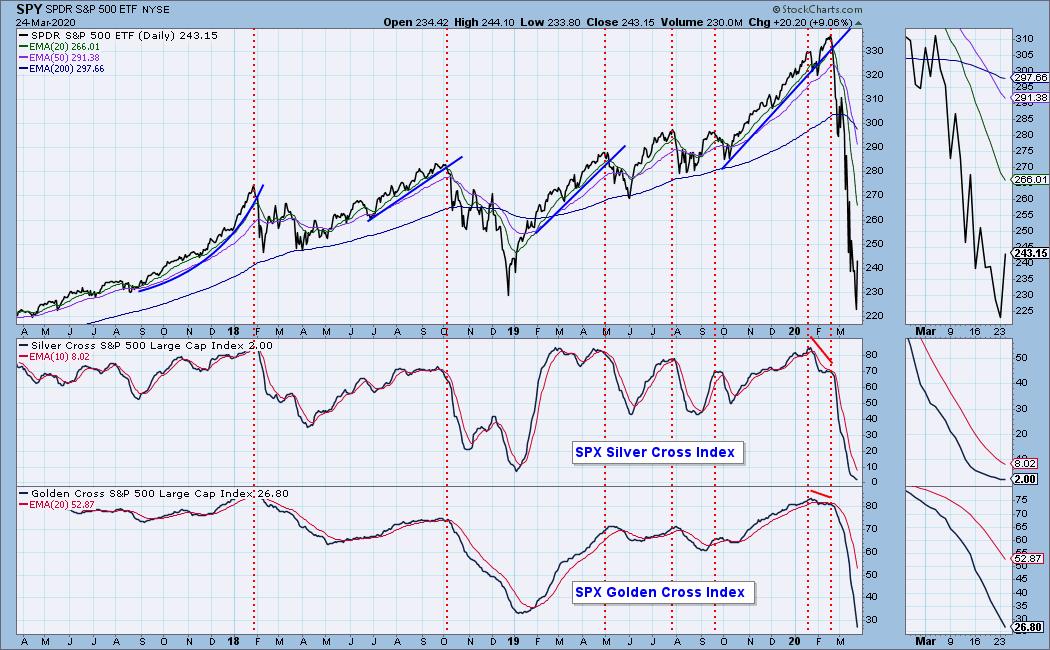
Market Environment: It is important to consider the odds for success. The Silver Cross Index measures the percentage of stocks on IT Trend Model BUY signals (20-EMA > 50-EMA), while the Golden Cross Index measures the percentage of stocks on LT Trend Model BUY signals (50-EMA > 200-EMA). Don't forget that as a "Diamonds" member, you have access to our GCI/SCI curated ChartList on DecisionPoint.com. You'll find it under "Members Only" links on the left side on the Blogs and Links Page. Here are the current percentages on the Silver and Golden Cross Indexes:
Diamond Index:
- Diamond Scan Results: 5
- Diamond Dog Scan Results: 0
- Diamond Bull/Bear Ratio: 5.00
For a more comprehensive review of current market conditions as well as analysis of Dollar, Gold, Oil and Bonds, subscribe to the DecisionPoint Alert! For a LIMITED TIME you can get a coupon code that will give you a discount for bundling your Diamonds subscription with the DecisionPoint Alert! Contact support@decisionpoint.com for more details.
Full Disclosure: I do not own any of the stocks above. I'm currently 85% in cash.

If the show isn't called off and the virus is under control, Erin Swenlin will be presenting at the The MoneyShow Las Vegas May 11-13, 2020! You'll have an opportunity to meet Erin and discuss the latest DecisionPoint news and Diamond Scans. Claim your FREE pass here! You can watch online with this pass too!!
Watch the latest episode of DecisionPoint with Carl & Erin Swenlin LIVE on Mondays 5:00p EST or on the StockCharts TV YouTube channel here!
Technical Analysis is a windsock, not a crystal ball.
Happy Charting!
- Erin
erinh@stockcharts.com
NOTE: The stocks reported herein are from mechanical trading model scans that are based upon moving average relationships, momentum and volume. DecisionPoint analysis is then applied to get five selections from the scans. The selections given should prompt readers to do a chart review using their own analysis process. This letter is not a call for a specific action to buy, sell or short any of the stocks provided. There are NO sure things or guaranteed returns on the daily selection of "diamonds in the rough."
Helpful DecisionPoint Links:
DecisionPoint Shared ChartList and DecisionPoint Chart Gallery
Price Momentum Oscillator (PMO)
Swenlin Trading Oscillators (STO-B and STO-V)
For more links, go to DecisionPoint.com!