
I have been asked over and over about whether now is the time to take advantage of bargains or to continue to "dollar-cost average". No one wants to hear what I have to say. They are looking for comfort and validation that they are doing the right thing. My advice to even the most beginner of investors is to move to cash (at this point, sell into strength). "But, but, but...", they say, "I'm getting more shares every time it moves lower" OR "I'll ride it out, it will eventually turn back up" OR "I haven't lost until I sell". Think of it this way. Sure you are getting more shares for your money on the way down, but the money you invest today could easily be gone tomorrow given market volatility. Would it be better to sell now, preserve capital and cash, and then have more money than your neighbor who dollar-cost averaged and worst case, rode it out? By waiting, you get the very best deal without the hurt on the way down. "But, but, but....I'll miss out on the bottom!", they say. When the market has dropped more than 30%, you'll have time to get back in and still make a tidy profit. Maybe you miss 15% on the way back up, you still have 15+% more to gain. That's an investment return I'm happy with. Your cash will be king when the bottom arrives. I'm not interested in being greedy despite many traders saying it is best to be greedy when everyone is selling. Under normal market conditions, I totally agree. We are not experiencing normal market conditions. Don't be sucked in on a relief rally only to be hammered the next two days when the market drops another 10+%. Patience truly is a virtue.
Today's Diamonds are suggested for a watch list. I'm not buying and it would disingenuous to suggest doing something I won't do. All of these stocks came from my Momentum Sleepers scan and are now in my watch list.
American Outdoor Brands Corp (AOBC) - Earnings: 6/18/2020 (AMC)
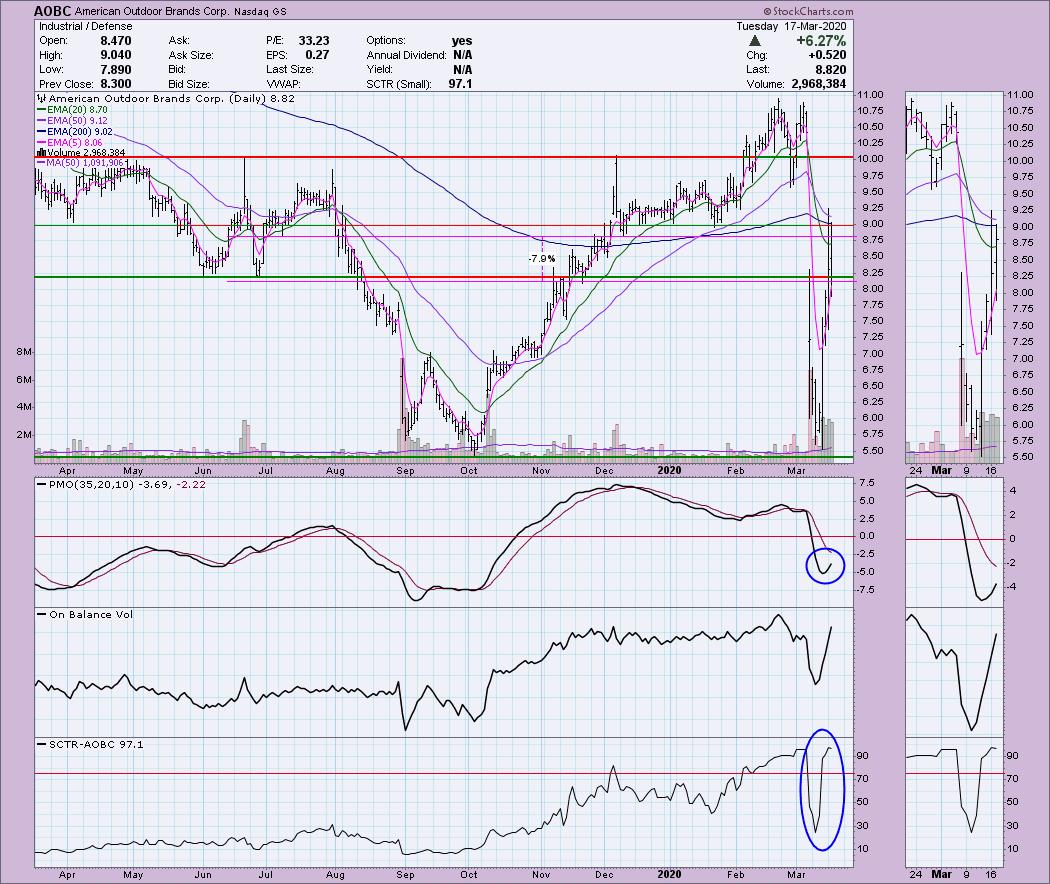
AOBC experienced a gap down breakdown that took price to 2019 support. We are now seeing a rebound off that support. The PMO has turned up and despite a market that has taken a big hit the past few days, it has held up. Volume is coming in nicely and the SCTR has recaptured the "hot zone" above 75. Overhead resistance at the January low is very near, but I do like the break above the 20-EMA and an avoidance of a LT Trend Model SELL signal (so far) which would be a negative 50/200-EMA crossover.
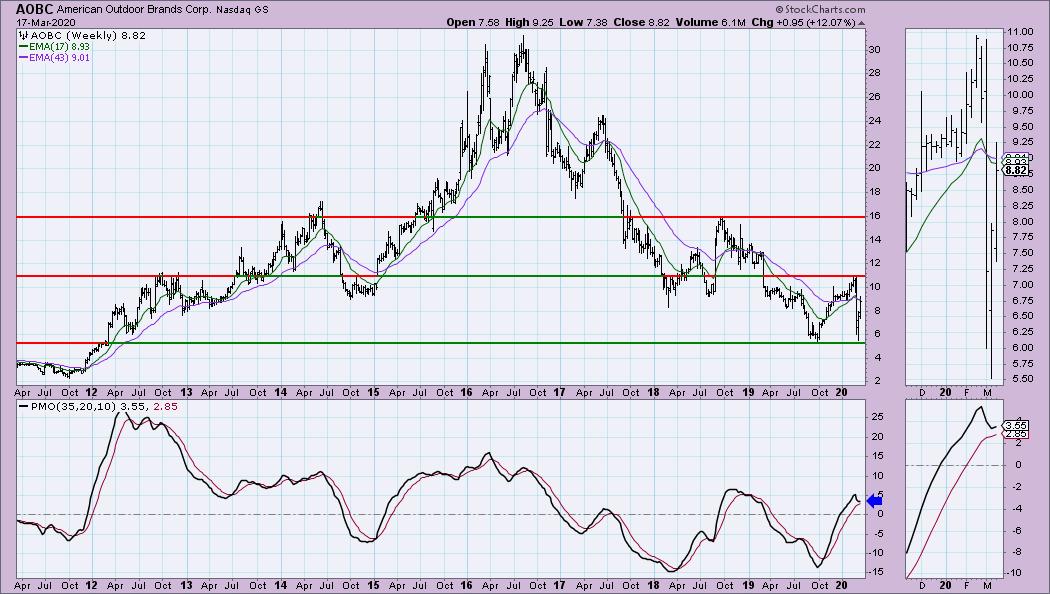
Support was held and it is a multi-year low. I had to open up the range on my weekly chart because I wanted you to see that it isn't really the "floor". I looked at a monthly chart and this was selling under a dollar in 2002. The weekly PMO has turned back up which is positive.
Welcome to DecisionPoint Daily Diamonds, wherein I highlight five "diamonds in the rough." These are selected from the results of my DecisionPoint scans, which search for stocks that could benefit from the trend and condition of the market. Remember, these are not recommendations to buy or sell, but are the most interesting of the stocks that surfaced in my scans. My objective is to save you the work of the initial, tedious culling process, but you need to apply your own analysis to see if these stocks pique your interest as well. There are no guaranteed winners here!
Kimberly Clark Corp (KMB) - Earnings: 4/22/2020 (BMO)
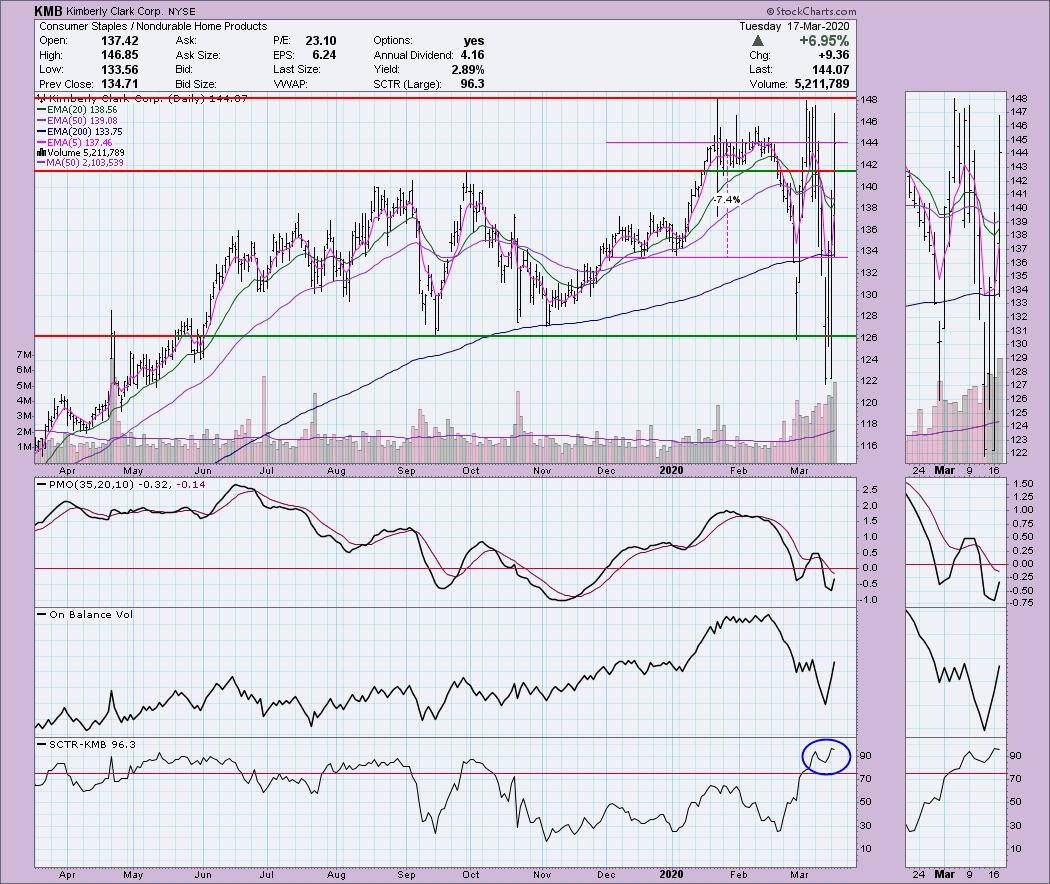
Full disclosure, I do own this one. It is one of the few holdings I have kept as my original stop hasn't been challenged yet. I rode it down, but fortunately it has held up fairly well. The volatility is what I hate about being in the market right now. I suspect it will continue to be volatile, but technically sound given the industry and sector.
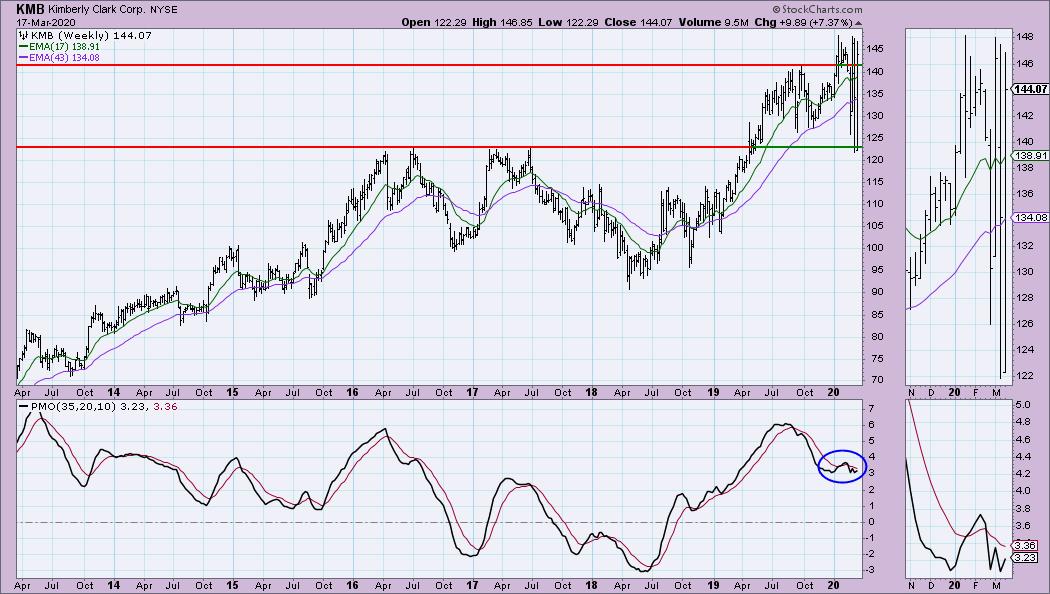
It was very important that support held here. If we do see a breakdown at that support level, I'd look at $115 next. The PMO is indecisive with the volatility, but currently it is rising.
Don't forget, on Thursdays I look at reader-requested symbols, so shoot me an email at erin@decisionpoint.com. I read every email I receive and try to answer them all!
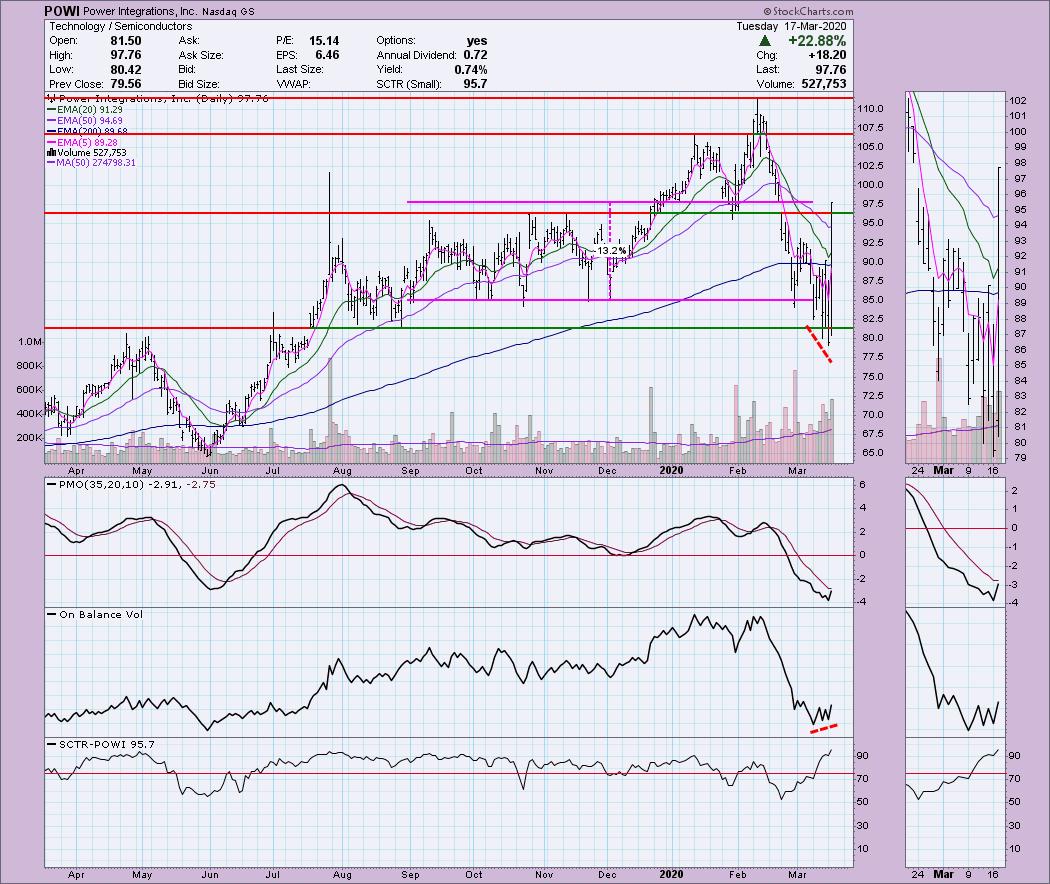
Power Integrations Inc (POWI) - Earnings: 4/23/2020 (AMC)
This one had a 22+% move to the upside today. It may not be the best time to enter here. The good news is that it broke above overhead resistance and closed higher as well. I like the positive divergence with the OBV and the PMO is nearing an oversold BUY signal.
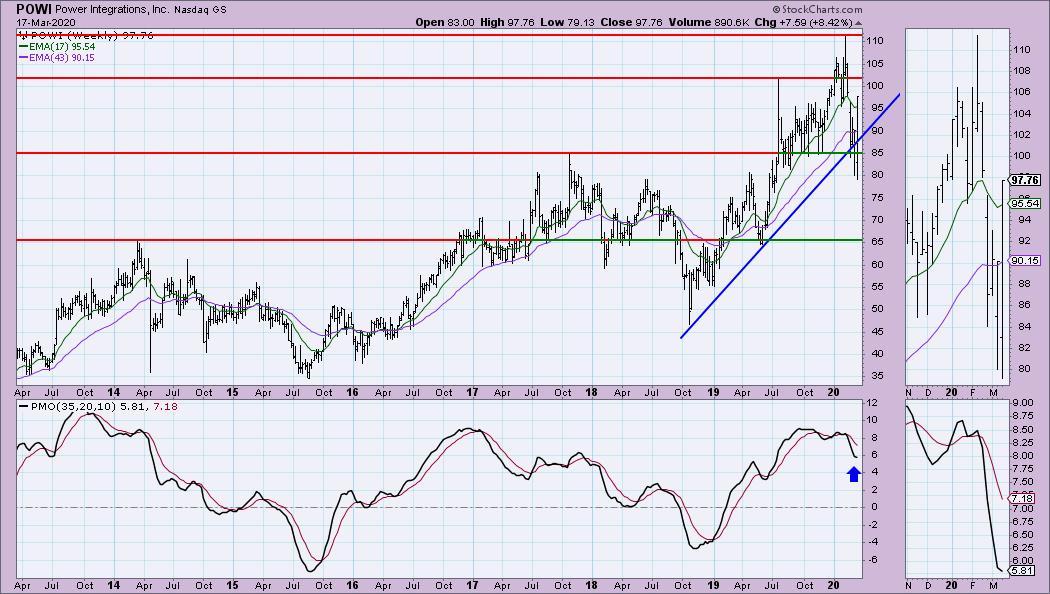
$85 was the golden area of support. It matched up with the rising trend and the 2017 top. It has been flirting with a close below that rising bottoms trendline, but ultimately rebounded off $80. The PMO is decelerating, but not rising yet.
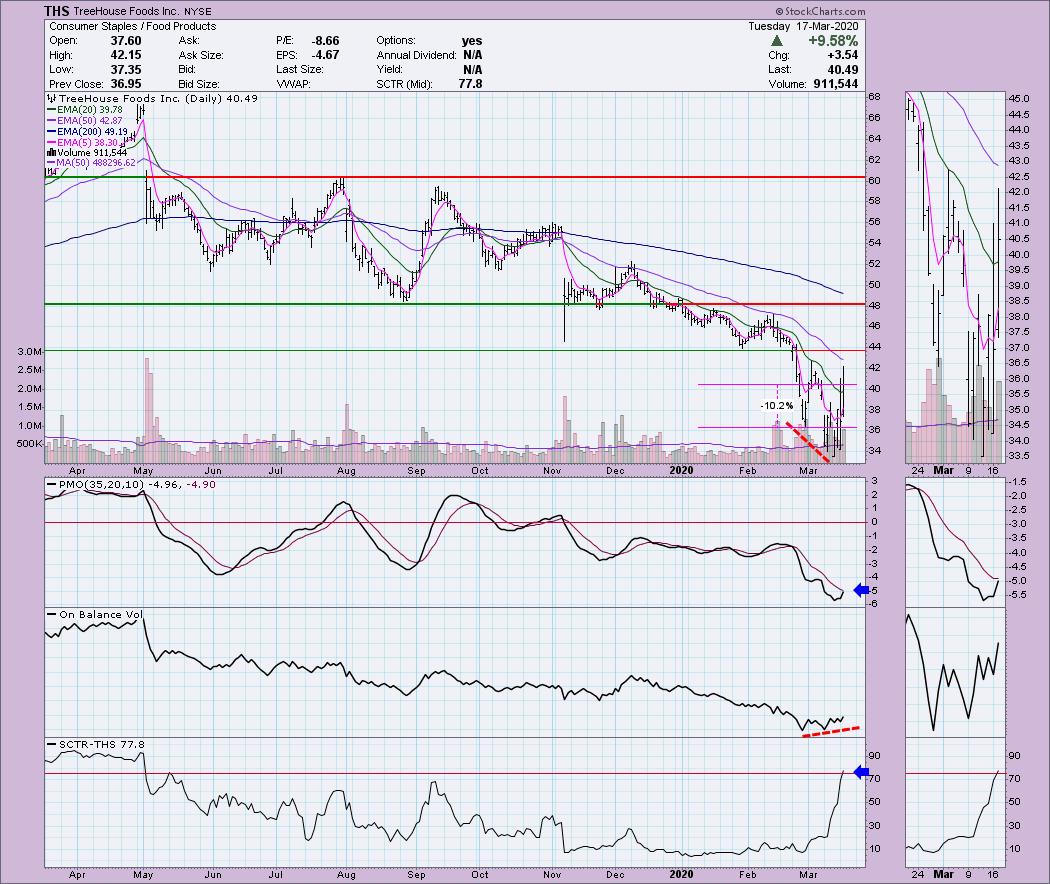
TreeHouse Foods Inc (THS) - Earnings: 4/30/2020 (BMO)
THS has a very nice positive divergence on the OBV. These usually signal significant bottoms or precede strong rallies. We got a strong rally already, the question remains if this is a bottom for the stock. The PMO is nearing a BUY signal and the SCTR just landed above 75. Overhead resistance at $44 is the next hurdle.
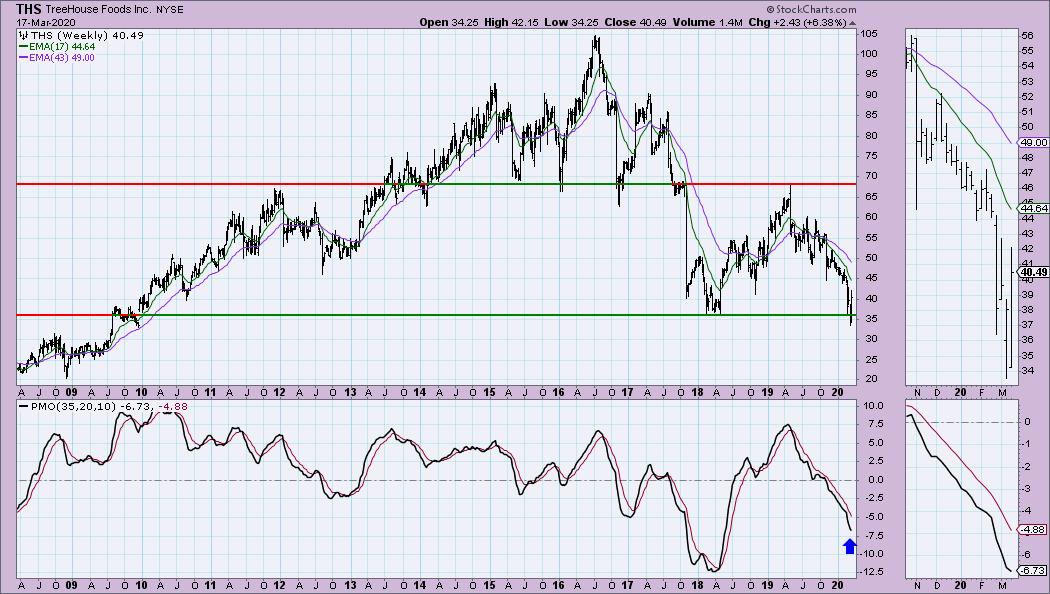
I made this a longer-term weekly chart to show you when and where price was at this level or lower. I want to make sure that you see that even though price looks like it is at an important bottom (which it certainly could be), you need to know it has been much lower and therefore, could travel lower from here.
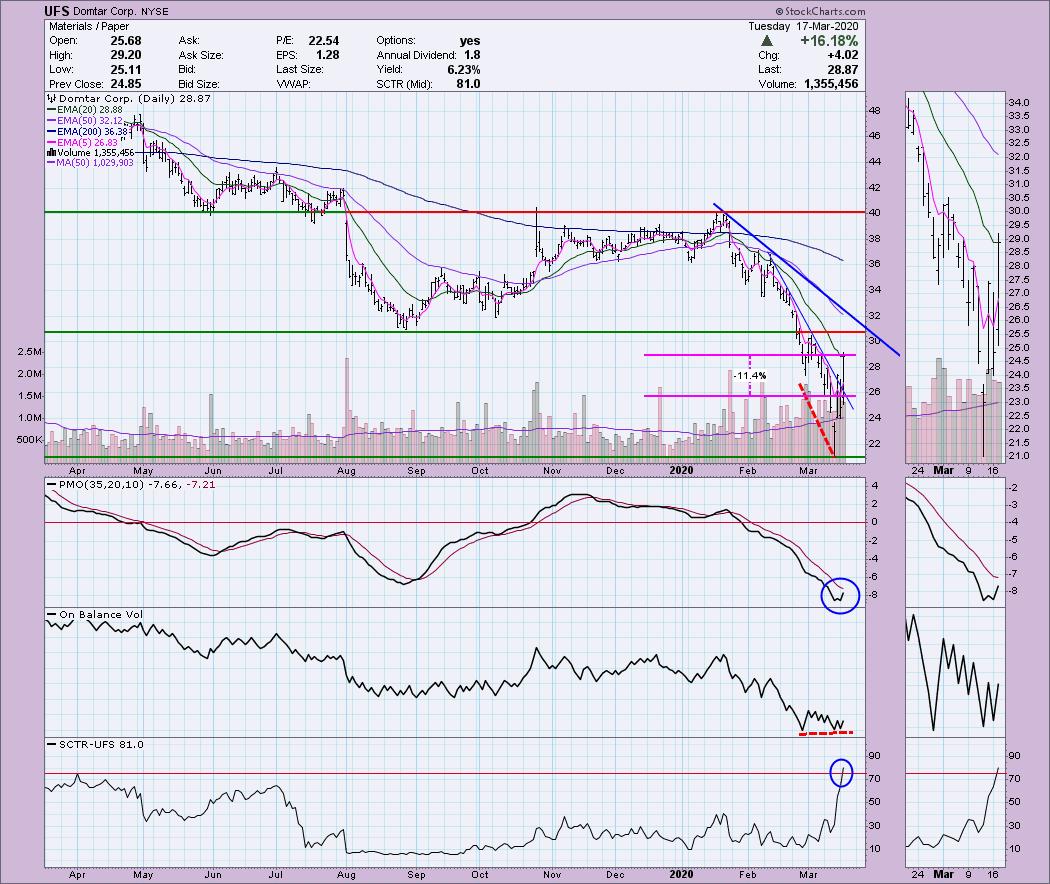
Domtar Corp (UFS) - Earnings: 4/30/2020 (BMO)
The short-term declining trend was broken, but we haven't quite managed to tackle the longer-term declining tops trendline. Price did close on the 20-EMA which is positive. The PMO is turning up. There is another beautiful OBV positive divergence. The SCTR is back in the hot zone.
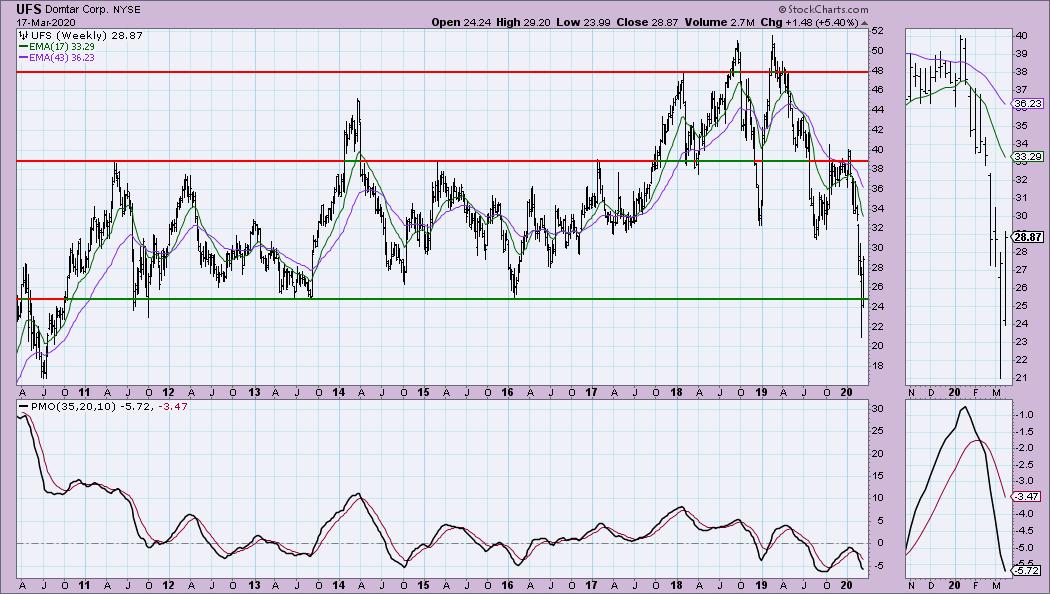
The recent price lows broke long-term support. We do see a rebound now, but note that price has been much lower than this.
Current Market Outlook:
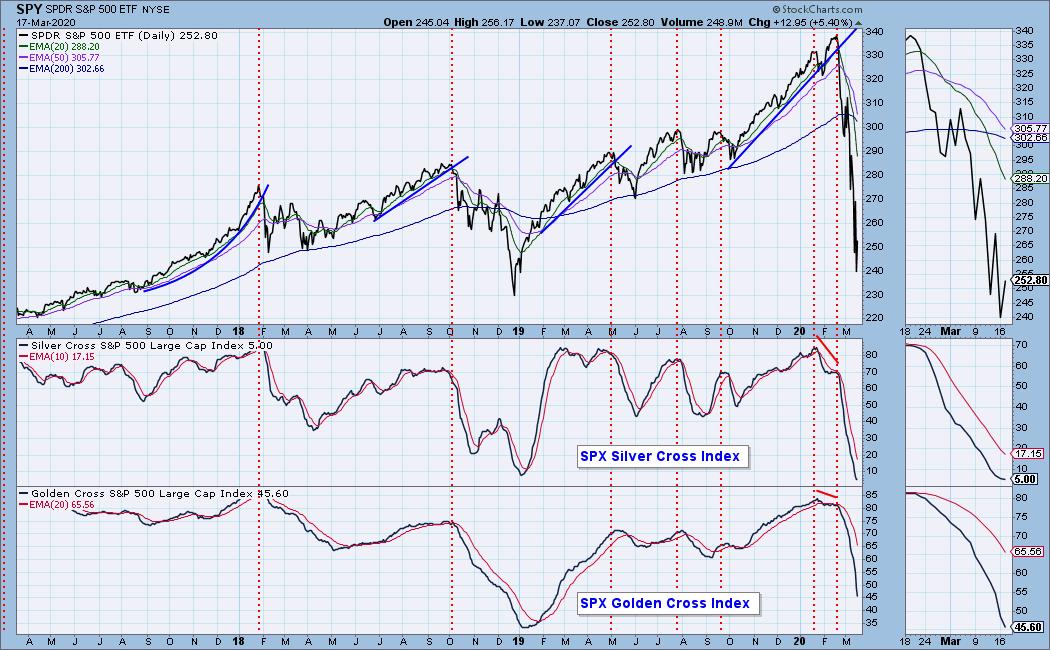
Market Environment: It is important to consider the odds for success. The Silver Cross Index measures the percentage of stocks on IT Trend Model BUY signals (20-EMA > 50-EMA), while the Golden Cross Index measures the percentage of stocks on LT Trend Model BUY signals (50-EMA > 200-EMA). Don't forget that as a "Diamonds" member, you have access to our GCI/SCI curated ChartList on DecisionPoint.com. You'll find it under "Members Only" links on the left side on the Blogs and Links Page. Here are the current percentages on the Silver and Golden Cross Indexes:
Diamond Index:
- Diamond Scan Results: 0
- Diamond Dog Scan Results: 0
- Diamond Bull/Bear Ratio: 0.00
For a more comprehensive review of current market conditions as well as analysis of Dollar, Gold, Oil and Bonds, subscribe to the DecisionPoint Alert! For a LIMITED TIME you can get a coupon code that will give you a discount for bundling your Diamonds subscription with the DecisionPoint Alert! Contact support@decisionpoint.com for more details.
Full Disclosure: I do not own any of the stocks above. I'm currently 80% in cash.

Erin Swenlin will be presenting at the The MoneyShow Las Vegas May 11-13, 2020! You'll have an opportunity to meet Erin and discuss the latest DecisionPoint news and Diamond Scans. Claim your FREE pass here! You can watch online with this pass too!!
Watch the latest episode of DecisionPoint with Carl & Erin Swenlin LIVE on Mondays 5:00p EST or on the StockCharts TV YouTube channel here!
Technical Analysis is a windsock, not a crystal ball.
Happy Charting!
- Erin
erinh@stockcharts.com
NOTE: The stocks reported herein are from mechanical trading model scans that are based upon moving average relationships, momentum and volume. DecisionPoint analysis is then applied to get five selections from the scans. The selections given should prompt readers to do a chart review using their own analysis process. This letter is not a call for a specific action to buy, sell or short any of the stocks provided. There are NO sure things or guaranteed returns on the daily selection of "diamonds in the rough."
Helpful DecisionPoint Links:
DecisionPoint Shared ChartList and DecisionPoint Chart Gallery
Price Momentum Oscillator (PMO)
Swenlin Trading Oscillators (STO-B and STO-V)
For more links, go to DecisionPoint.com!