
Today's "diamonds in the rough" come from the Momentum Sleepers scan. I had quite a few results to wade through but found some very interesting candidates that include two biotechs, a Financial sector stock, an Industrial sector stock and a Cyclicals sector stock. There are two On-Balance Volume (OBV) positive divergences on these charts that are exciting and given the other technicals, these diamonds in the rough may shine sooner rather than later.
Don't forget I'm taking your symbol requests for Thursday's Diamond Report! There are some interesting ones so far. Just send them to erin@decisionpoint.com.
Welcome to DecisionPoint Daily Diamonds, wherein I highlight five "diamonds in the rough." These are selected from the results of my DecisionPoint scans, which search for stocks that could benefit from the trend and condition of the market. Remember, these are not recommendations to buy or sell, but are the most interesting of the stocks that surfaced in my scans. My objective is to save you the work of the initial, tedious culling process, but you need to apply your own analysis to see if these stocks pique your interest as well. There are no guaranteed winners here!
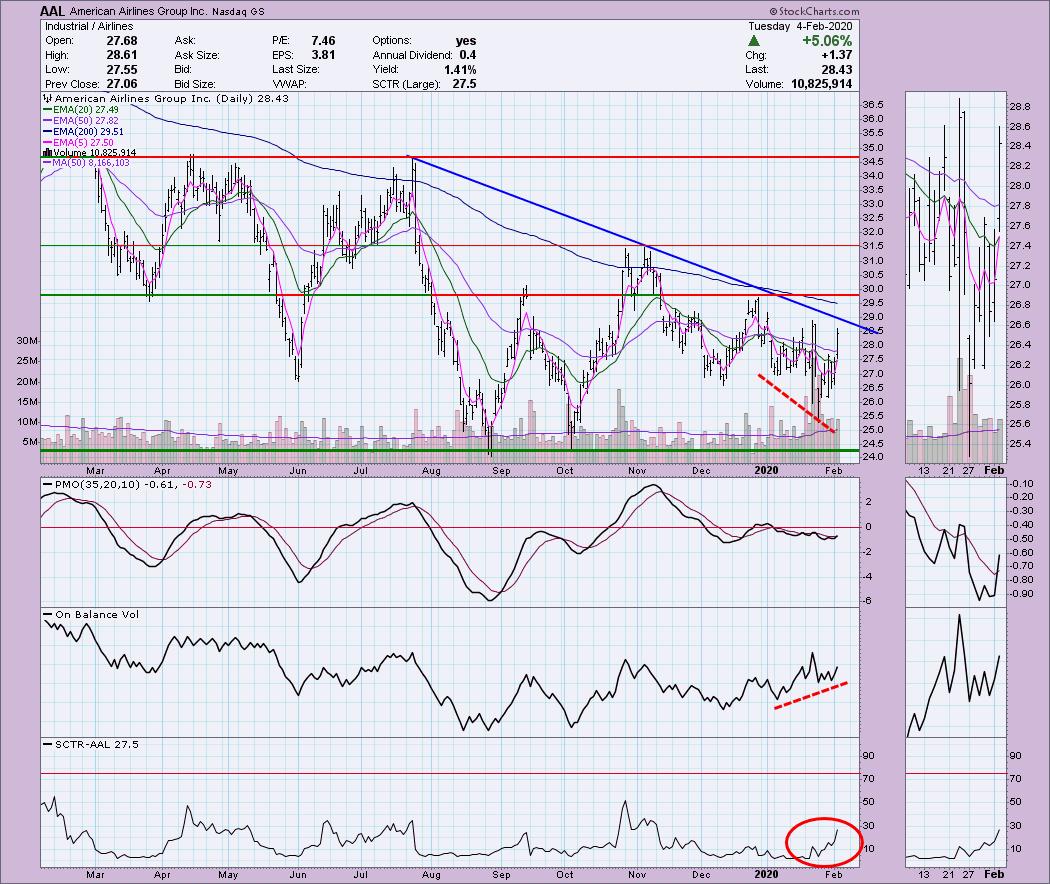
American Airlines Group Inc (AAL) - Earnings: 4/24/2020
I'm not a huge fan of airlines and American has certainly had its share of hard times. Today AAL rallied in a major way. The declining trend isn't broken just yet, but it looks ready to break. This is one of the OBV positive divergences. It couldn't be any better with the very steep and very clear divergence. I like that we can also couple it with a new PMO BUY signal and rising SCTR. AAL may require a pullback from this 5% move to the upside.
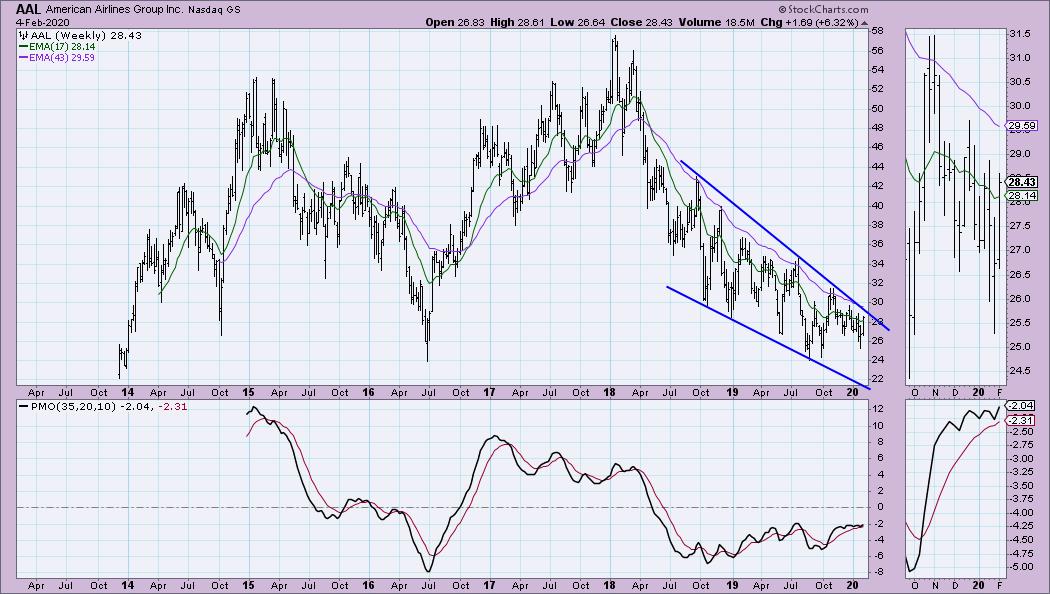
Check out the longer-term falling wedge. This is a bullish pattern. The PMO is trying to bottom above the signal line again. All positives.
Don't forget, on Thursdays I look at reader-requested symbols, so shoot me an email at erin@decisionpoint.com. I read every email I receive and try to answer them all!
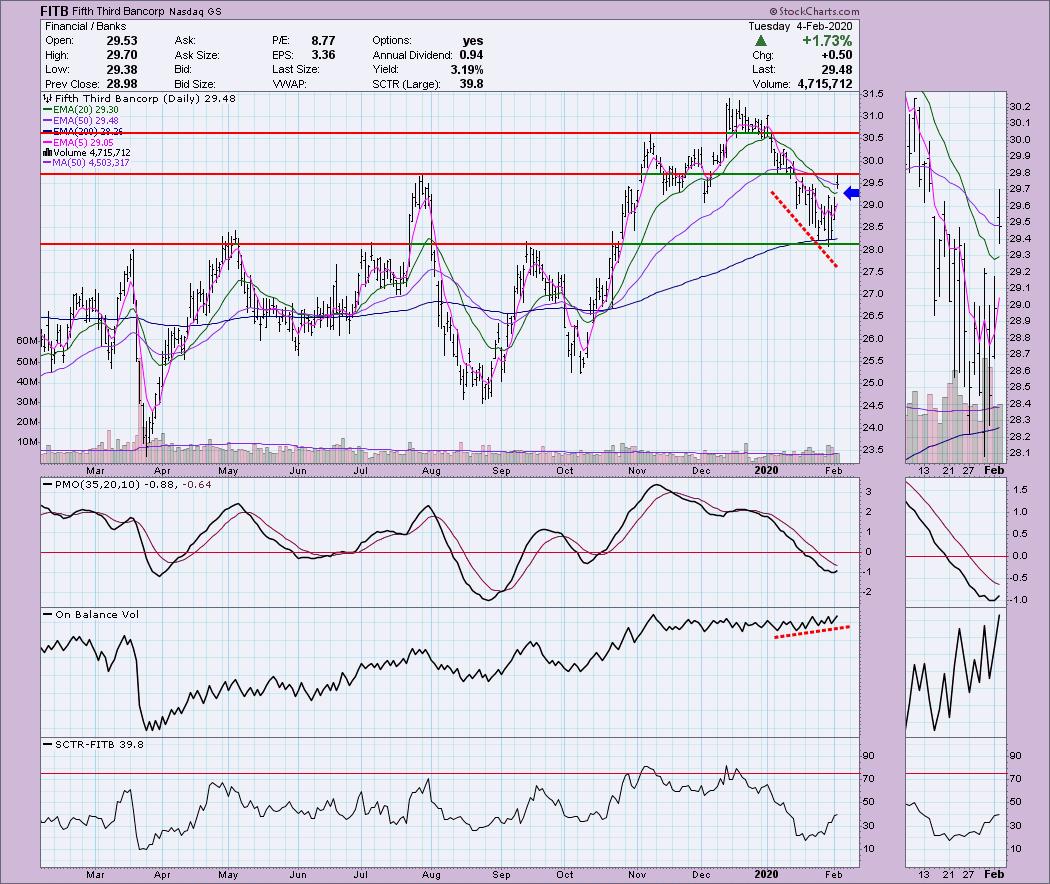
Fifth Third Bancorp (FITB) - Earnings: 2/4/2020
FITB reported earnings today and gapped up nicely above the 20-EMA. This one also has a great OBV positive divergence that tells me we should see follow-through on this earnings jump. The PMO is bottoming in oversold territory and the SCTR is also rising.
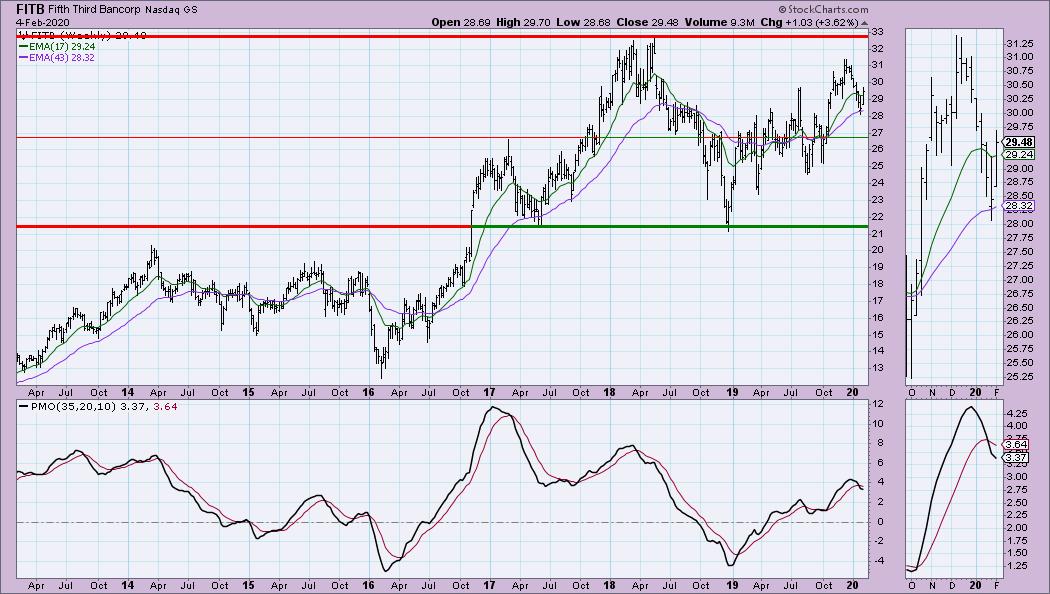
The PMO did just trigger a SELL signal on the weekly chart, but it is decelerating on this 3.62% pop for the week so far. $27 looks like solid support if we do see it pullback again, but I suspect this one will be heading up to test $31 - $33 territory.
Homology Medicines Inc (FIXX) - Earnings: 3/12/2020
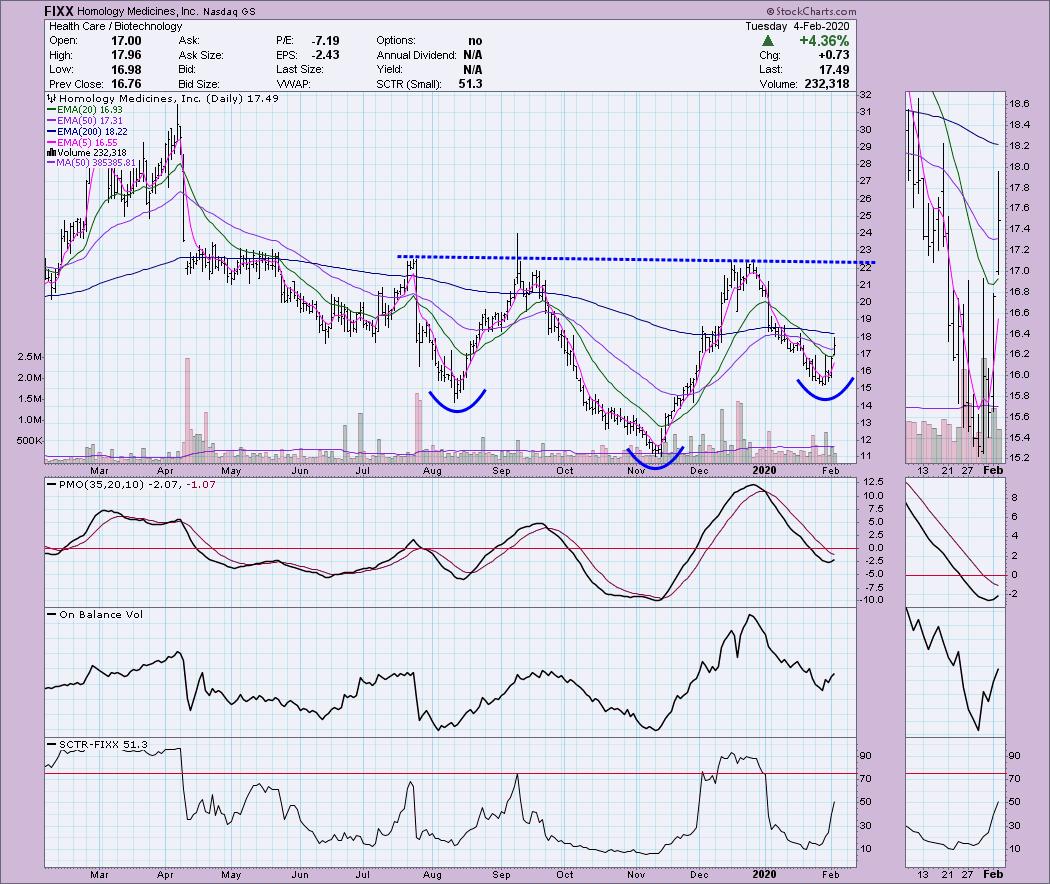
I generally don't like to point out chart patterns until they technically "are" chart patterns, but this one is shaping up nicely. Chart patterns aren't technically a pattern until they execute. In the case of a reverse head and shoulders like we see here, price would need to breakout above the neckline. A lot can happen here, but it sure does look like the right time to get in. The PMO is turning up. Looking at the PMO historically, it has had very clean crossovers and not a lot of twitch. The OBV has turned direction. If I had to point out a problem, price jumped 4.36% today and yet volume fell quite a bit. I would expect a pullback before it resumes its move to complete a bullish reverse head and shoulders.
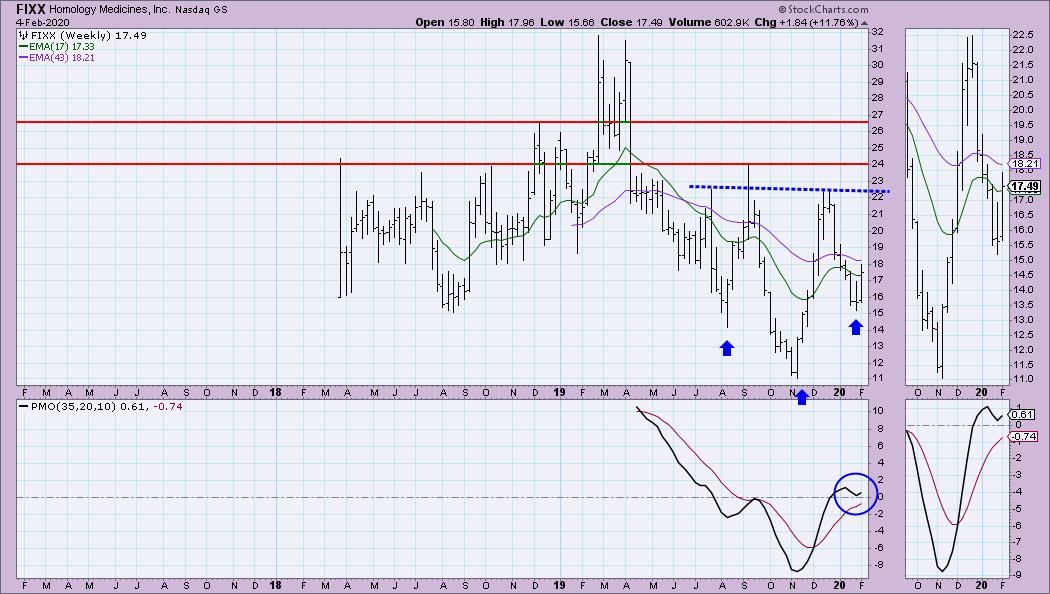
The reverse head and shoulders is also visible on a weekly chart. The weekly PMO has bottomed above its signal line and the zero line.
Immunomedics Inc (IMMU) - Earnings: 2/19/2020
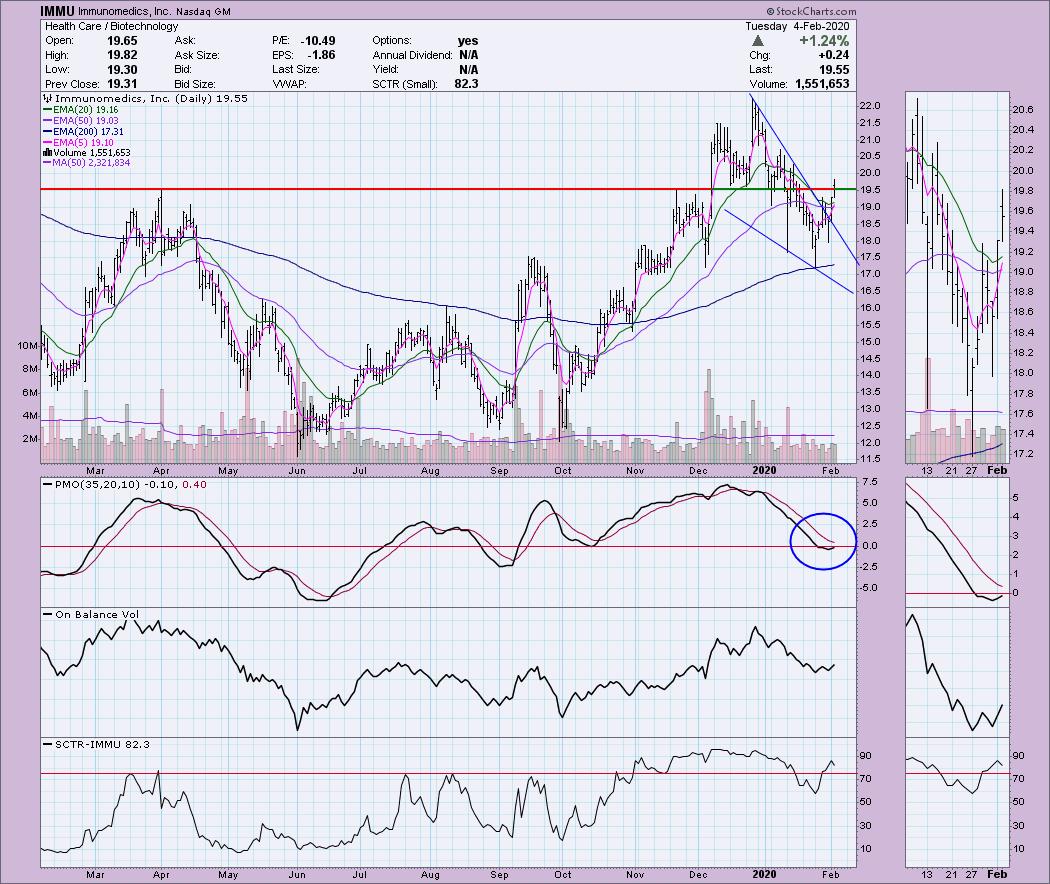
Here's another biotech. Remember these stocks can be very volatile, so keep an eye on your position sizing. The PMO has turned up and we can see that a bullish falling wedge pattern has executed. Price finally pushed past the April 2019 top, but didn't quite close above it. The OBV is confirming the rally and the SCTR is in the "hot zone" above 75. I would set a price target at $21.50 - $22.50.
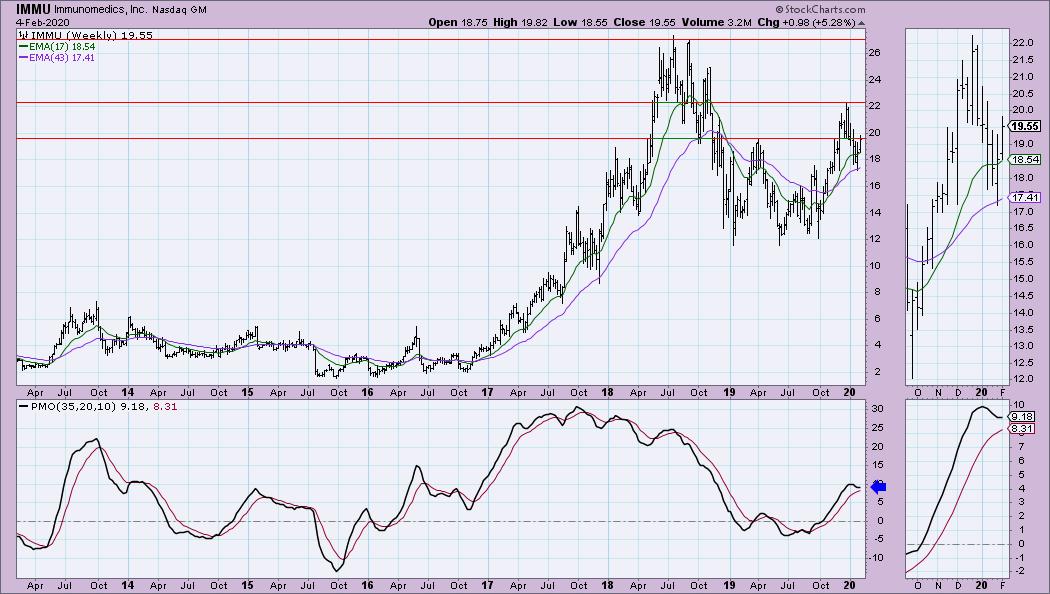
The weekly chart shows the importance of overcoming that April top. Of course there is overhead resistance lying in wait at $22, but after that, there is upside potential up to the all-time high.
Planet Fitness Inc (PLNT) - Earnings: 2/25/2020
PLNT has been on a roll since last October. Today price broke out and made new all-time highs. The PMO is somewhat overbought, but a new BUY signal has appeared on the breakout. OBV is clearly confirming and we now have a SCTR in the hot zone.
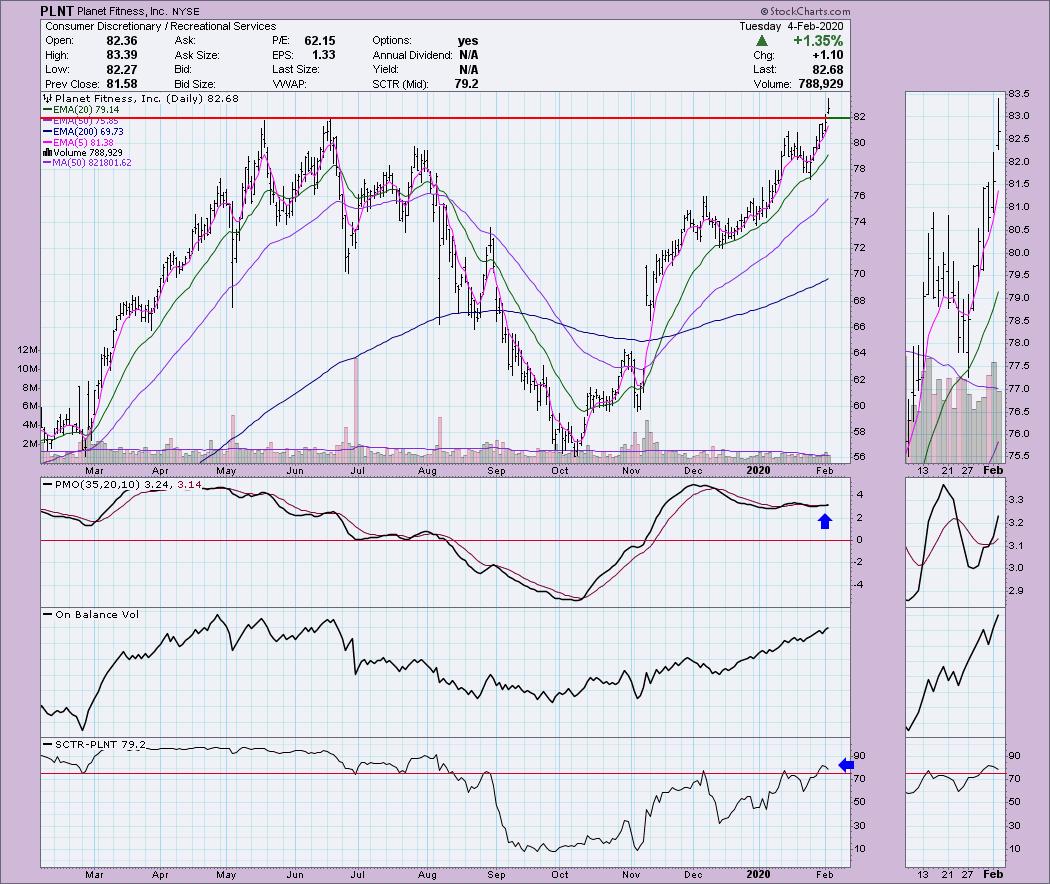
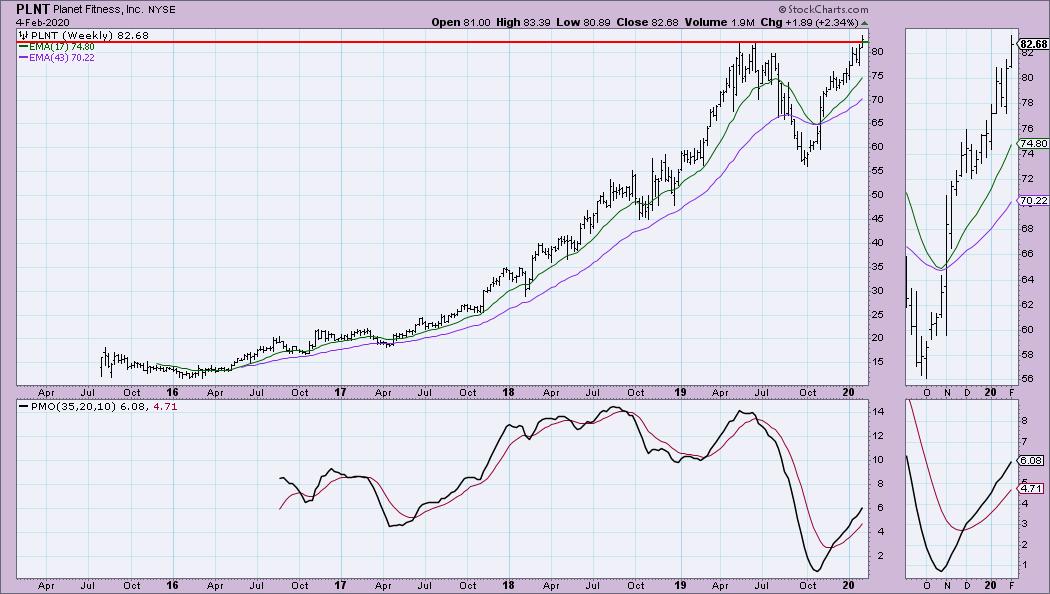
The original parabolic move broke down last summer and took price down to $55. The weekly PMO looks healthy as it rises from a late 2019 BUY signal.
Again, don't forget to send me your symbol requests for Thursday!
Current Market Outlook:
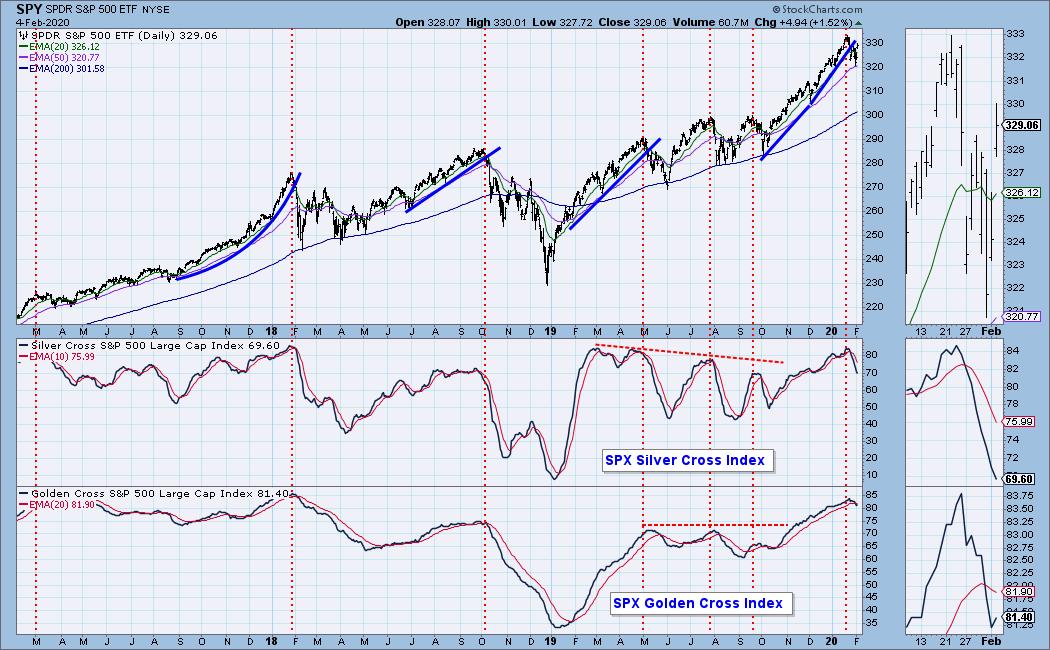
Market Environment: It is important to consider the odds for success. The Silver Cross Index measures the percentage of stocks on IT Trend Model BUY signals (20-EMA > 50-EMA), while the Golden Cross Index measures the percentage of stocks on LT Trend Model BUY signals (50-EMA > 200-EMA). Don't forget that as a "Diamonds" member, you have access to our GCI/SCI curated ChartList on DecisionPoint.com. You'll find it under "Members Only" links on the left side on the Blogs and Links Page. Here are the current percentages on the Silver and Golden Cross Indexes:
Diamond Index:
- Diamond Scan Results: 1
- Diamond Dog Scan Results: 4
- Diamond Bull/Bear Ratio: 0.25
For a more comprehensive review of current market conditions as well as analysis of Dollar, Gold, Oil and Bonds, subscribe to the DecisionPoint Alert! For a LIMITED TIME you can get a coupon code that will give you a discount for bundling your Diamonds subscription with the DecisionPoint Alert! Contact support@decisionpoint.com for more details.
Full Disclosure: I do not own any of the stocks above. I'm currently 35% in cash.

Erin Swenlin will be presenting at the The MoneyShow Las Vegas on May 11-13, 2020! You'll have an opportunity to meet Erin and discuss the latest DecisionPoint news and Diamond Scans. The conference is free to attend or view online!
Watch the latest episode of DecisionPoint with Carl & Erin Swenlin LIVE on Mondays 5:00p EST or on the StockCharts TV YouTube channel here!
Technical Analysis is a windsock, not a crystal ball.
Happy Charting!
- Erin
erinh@stockcharts.com
NOTE: The stocks reported herein are from mechanical trading model scans that are based upon moving average relationships, momentum and volume. DecisionPoint analysis is then applied to get five selections from the scans. The selections given should prompt readers to do a chart review using their own analysis process. This letter is not a call for a specific action to buy, sell or short any of the stocks provided. There are NO sure things or guaranteed returns on the daily selection of "diamonds in the rough."
Helpful DecisionPoint Links:
DecisionPoint Shared ChartList and DecisionPoint Chart Gallery
Price Momentum Oscillator (PMO)
Swenlin Trading Oscillators (STO-B and STO-V)
For more links, go to DecisionPoint.com!