
I have so much fun on Reader Request Thursdays! Your requests have been coming in all week and I have selected four requests and popped a stock in from my Diamond Scan that has me very interested. Again, I do remind you that these requests came in before today, so you'll see some great rallies and upward movement after they were given to me. My goal on Reader Request Thursday is to look at your stocks and find instructive material for you and for everyone else. I look at these requests dispassionately and will give you my thoughts at the end of each (buy, hold, sell, short?). Feel free to send in your requests up until Thursday at 11:00a PST.
Agios Pharmaceuticals Inc (AGIO) - Earnings: 4/30/2020 (BMO)
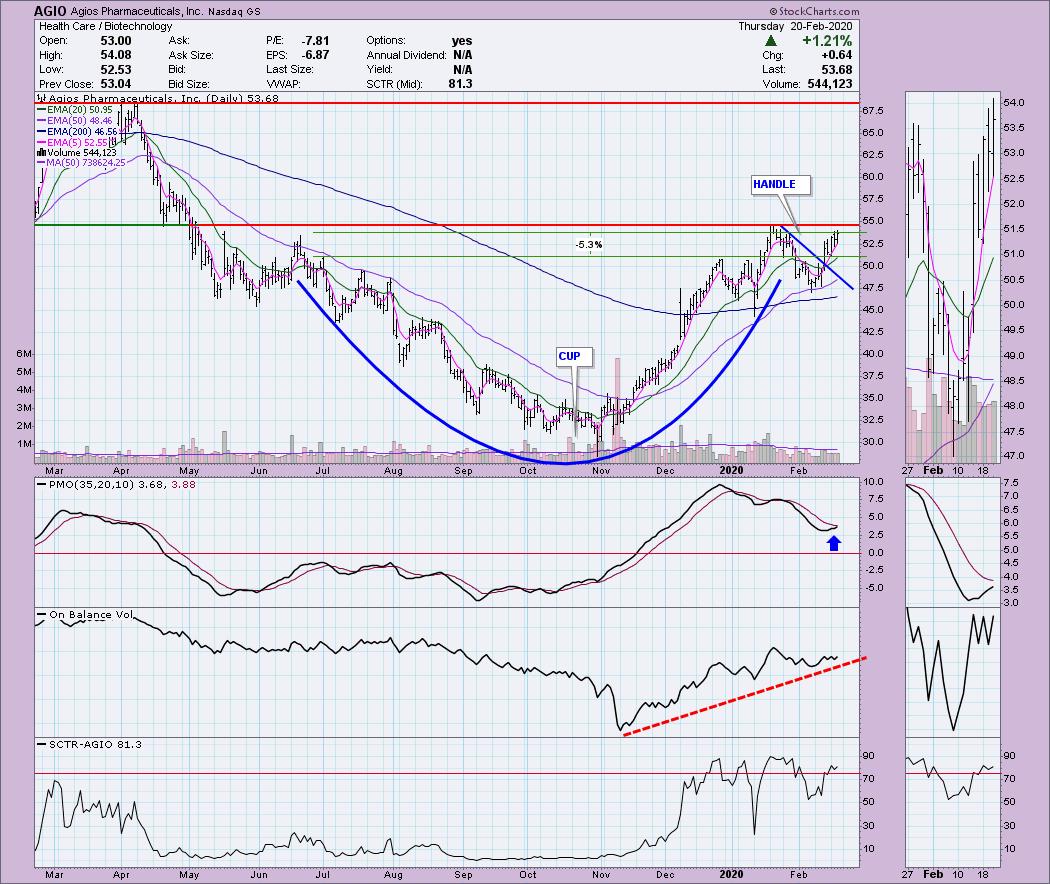
This is my Diamond for the day. It is a Biotech and they can be rather volatile. I spotted a cup and handle pattern that is executing. The OBV overall is supporting the rising trend started after the October low. The PMO is zeroing in on a new BUY signal and the SCTR has shown vast improvement this month. The stop is tricky on this one. If you want a tight one, you could go where I have marked, but biotechs are volatile as I said and there's a good chance you could be stopped out. To go to February low is over 10% for a stop so you'll have to figure out your risk appetite. Personally, I'm looking at it for my own portfolio as an intermediate-term investment and therefore, I would probably use the 10% + stop at around $47.
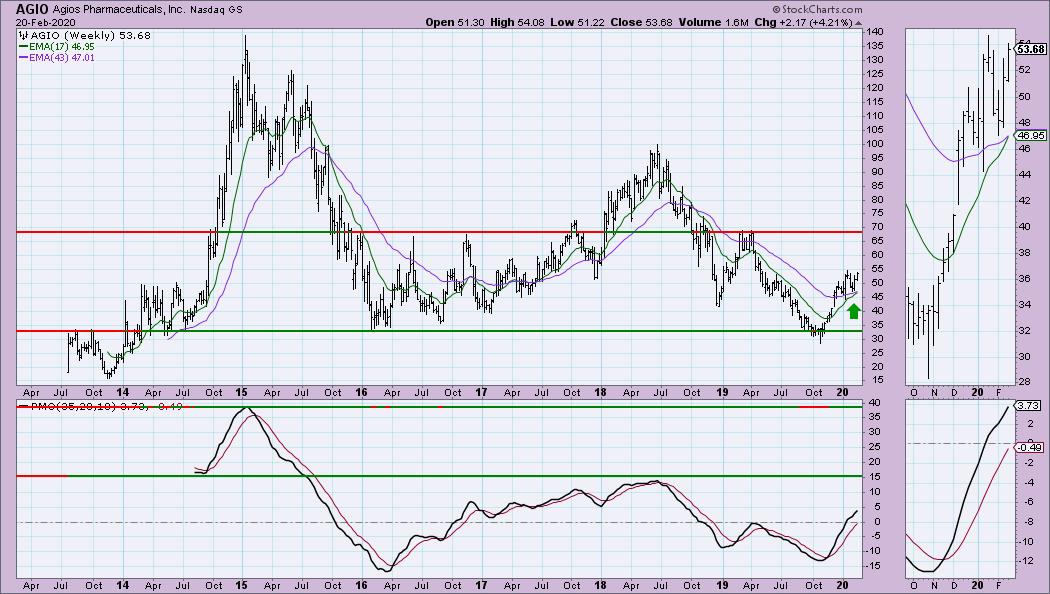
The weekly chart is the reason I would take the lower stop level. It's very bullish. I have a positive 17/43-week crossover. The PMO is rising and is not overbought. The next level of overhead resistance is all the way up at $68. At this point have to decide if I want something risky like this versus something more stable. A breakout above $55 would entice me.
Welcome to DecisionPoint Daily Diamonds, wherein I highlight five "diamonds in the rough." These are selected from the results of my DecisionPoint scans, which search for stocks that could benefit from the trend and condition of the market. Remember, these are not recommendations to buy or sell, but are the most interesting of the stocks that surfaced in my scans. My objective is to save you the work of the initial, tedious culling process, but you need to apply your own analysis to see if these stocks pique your interest as well. There are no guaranteed winners here!
Akamai Technologies Inc (AKAM) - Earnings: 4/28/2020 (AMC)
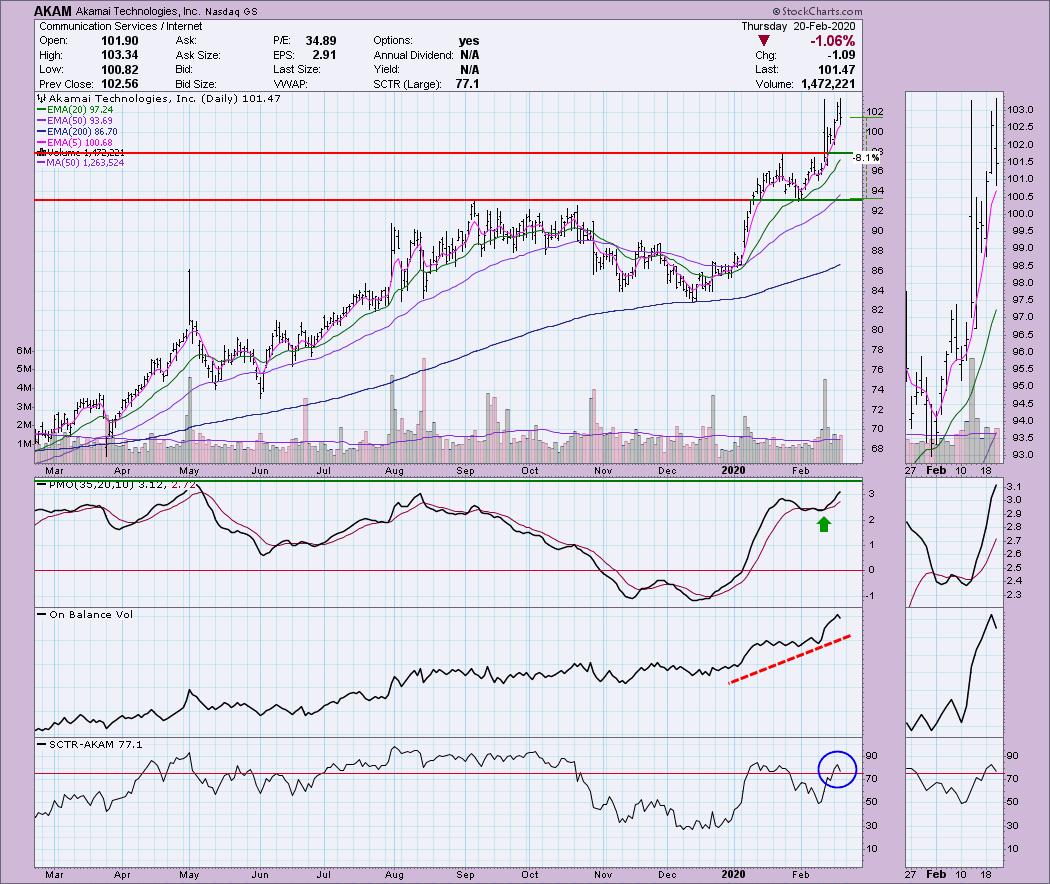
This reader request is a familiar name. Today wasn't a great day, but it has been performing well since it was requested. The PMO is on BUY signal but it is getting toward overbought extremes. Of course PMO ranges can stretch in a strong rally. This current rally is close to vertical, so for me it wouldn't be the best entry right now, I'd look for a pullback. However, if you own it, I'd hold on despite today's pullback. I might pull my stop in more tightly or set a trailing stop.
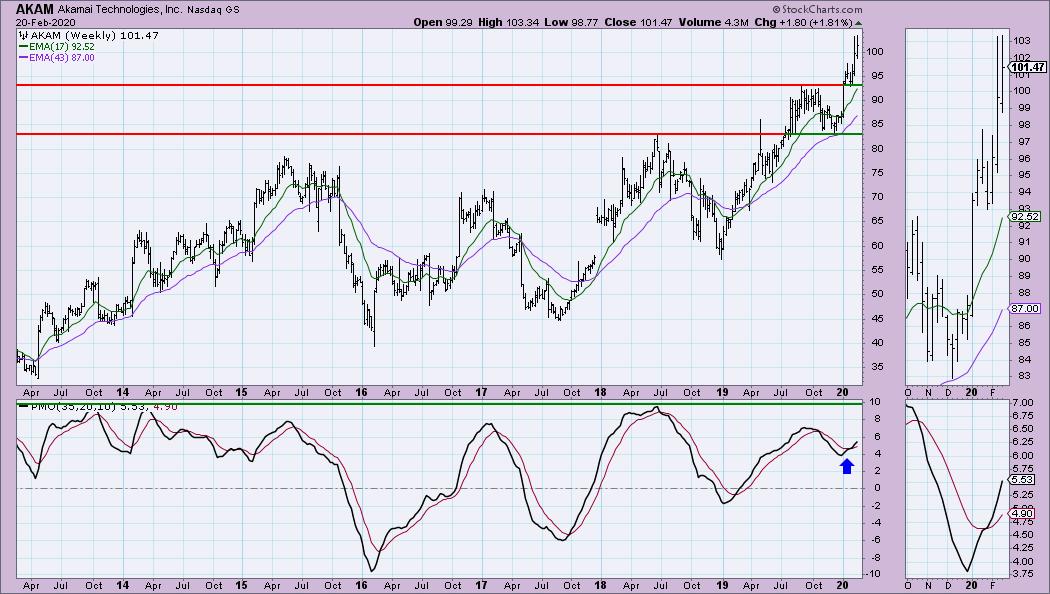
The PMO is on a BUY signal and rising nicely. It's not really overbought either. As you can see this year's rally has been close to straight up. Those rising trends are very difficult to maintain for a long period of time, so this one will need a pullback or correction soon.
Don't forget, on Thursdays I look at reader-requested symbols, so shoot me an email at erin@decisionpoint.com. I read every email I receive and try to answer them all!
Ballard Power Systems Inc (BLDP.TO) - Earnings: N/A
My friend, Judy told me she was unhappy with herself for not pulling the trigger on this one earlier this week. I can see why you didn't. This move is parabolic. Look at the flat OBV on the near vertical rally the past month...it's been flat. That tells me there could be some problems under the surface in preparation for a correction. There's also a negative divergence with the OBV tops and price tops. Notice that the last OBV top was below the previous on. Yet, notice the corresponding price tops... if you haven't gotten in, I wouldn't right now.
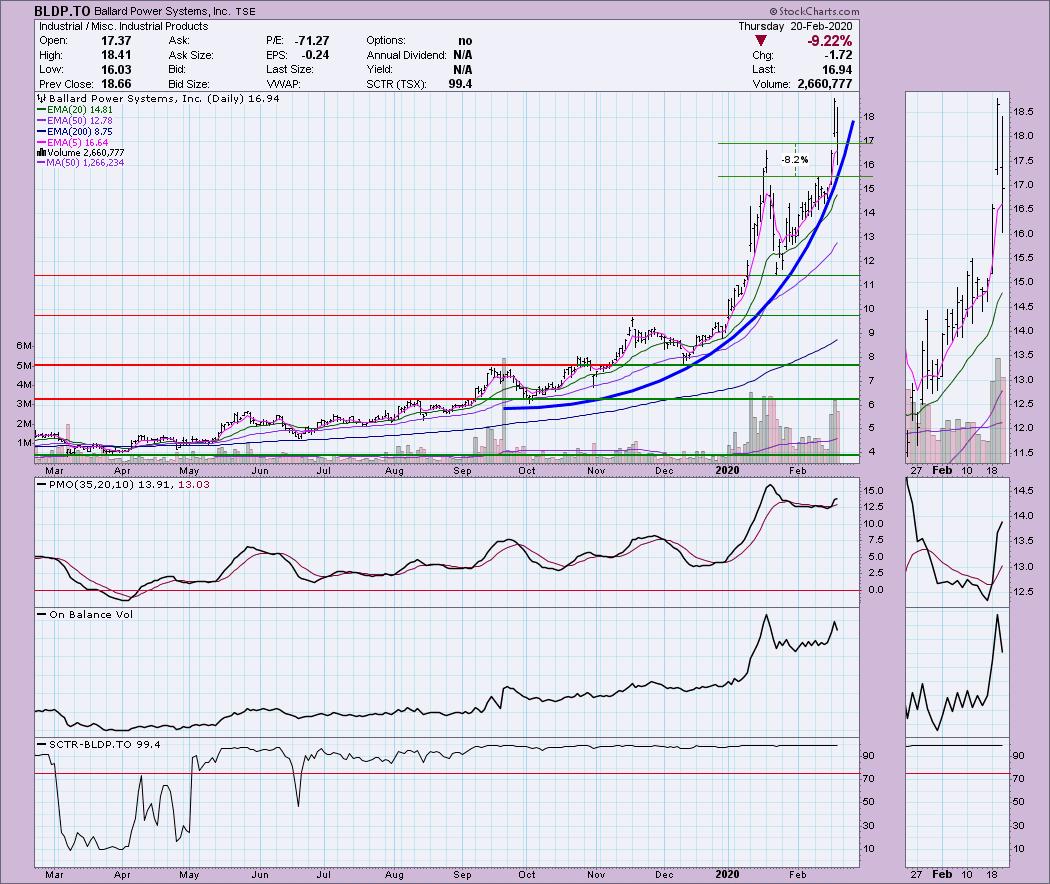
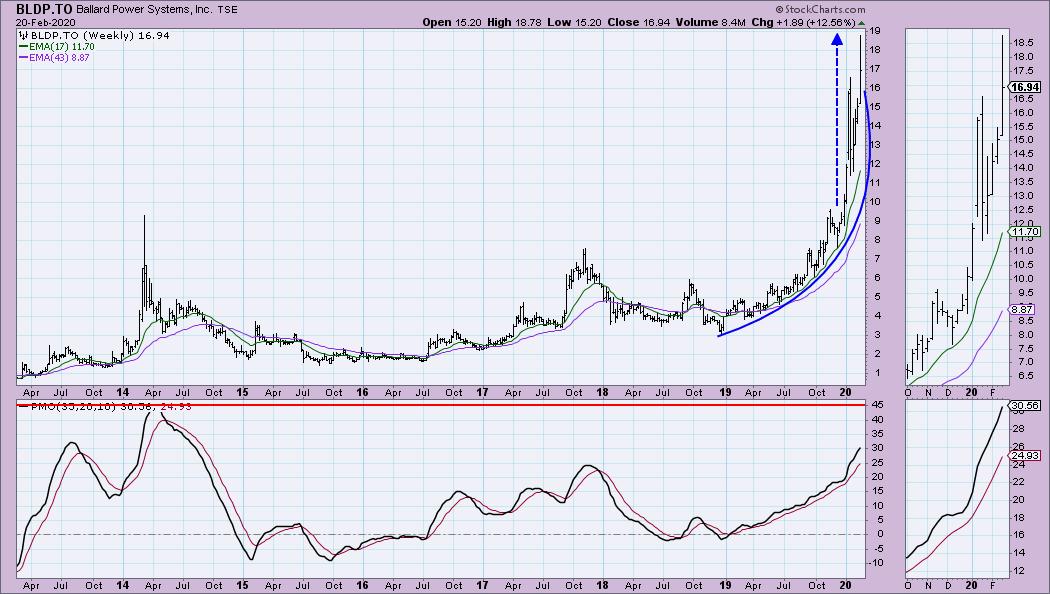
You can really see how vertical price has been traveling since December. That cannot be maintained. Of course, the PMO isn't all that overbought and it is rising. Still I would avoid chasing. If you own it, I'd recommend a trailing stop.
Comtech Telecommunications Corp (CMTL) - Earnings: 3/4/2020 (AMC)
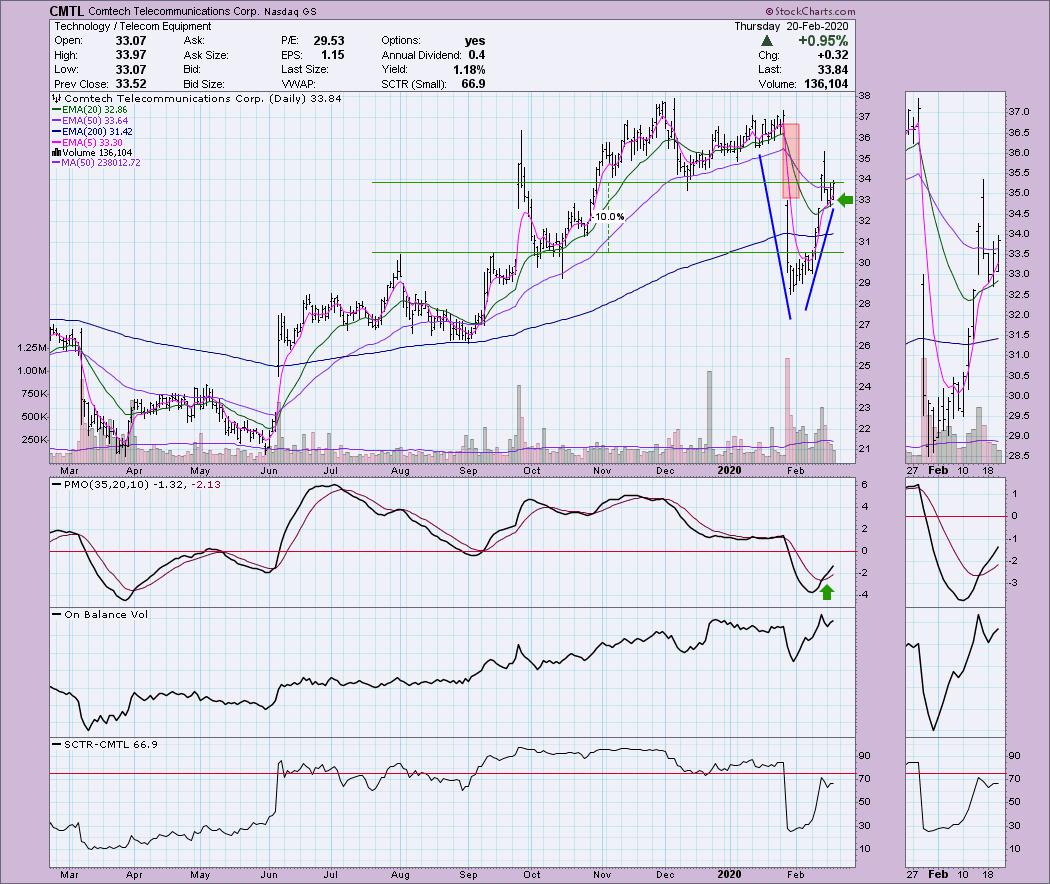
Here we have a bullish 'V' bottom formation. I actually like that it is consolidating right now on top of the 20-EMA. It seems to be a pause in the action that is forming a bull flag. My expectation is for price to close the gap I annotated in red. The PMO is on a BUY signal in oversold territory. The OBV is looking pretty good. I don't like to see a new OBV high without the corresponding new high in price. Price should follow volume and it isn't. But overall it looks good with the confirming rising OBV bottoms. I think my stop level would be the 200-EMA and not quite so far as I have marked.
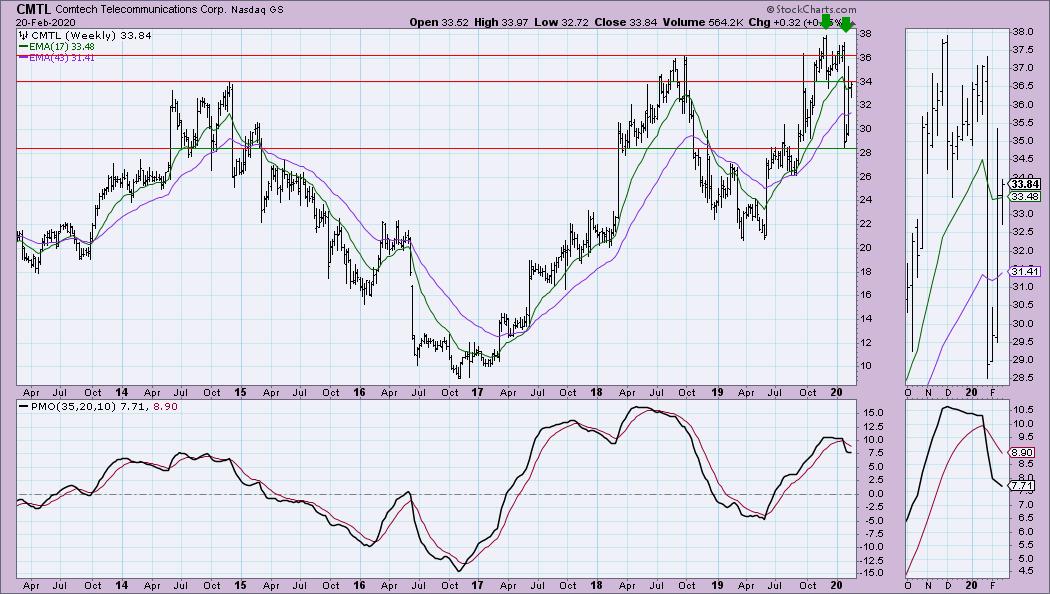
The weekly chart shows a prior double-top formation that executed on the big drop in January. Right now price is up against long-term resistance at the 2014 high. The daily chart is favorable and I would look for it to break that resistance. The weekly PMO is decelerating but is still declining. If you own it, hold it and I could see it as a possible buy.
iShares 20+ Year Treasury Bond ETF (TLT) - Earnings: N/A
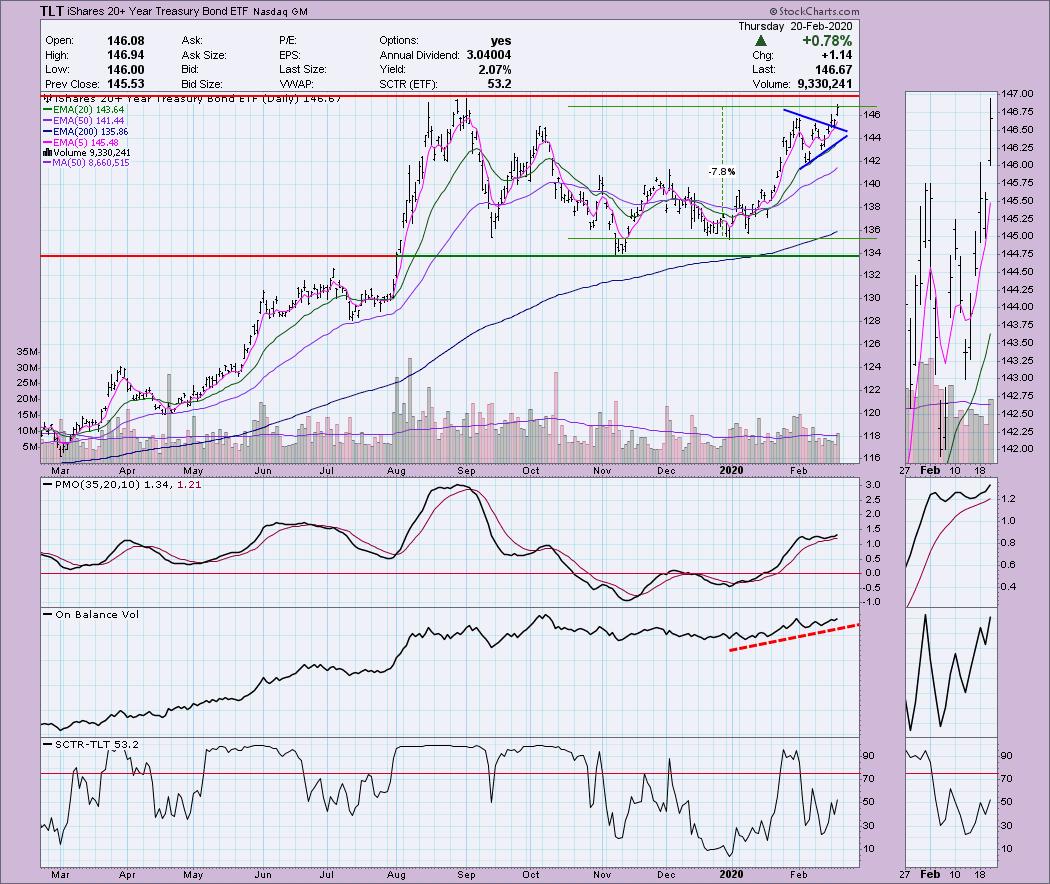
I'll be looking at TLT in the DecisionPoint Alert which is published daily. We always include TLT. I've been a fan of TLT since the PMO BUY signal at the beginning of the year. It did start to consolidate into a symmetrical triangle. Those are continuation patterns, so I was looking for some more upside which we got. Overhead resistance is nearing though. I think the question is how low can rates and yields go to support even higher prices on TLT? I don't know, but the PMO is rising again and the OBV is showing interest is still there and the SCTR is improving.
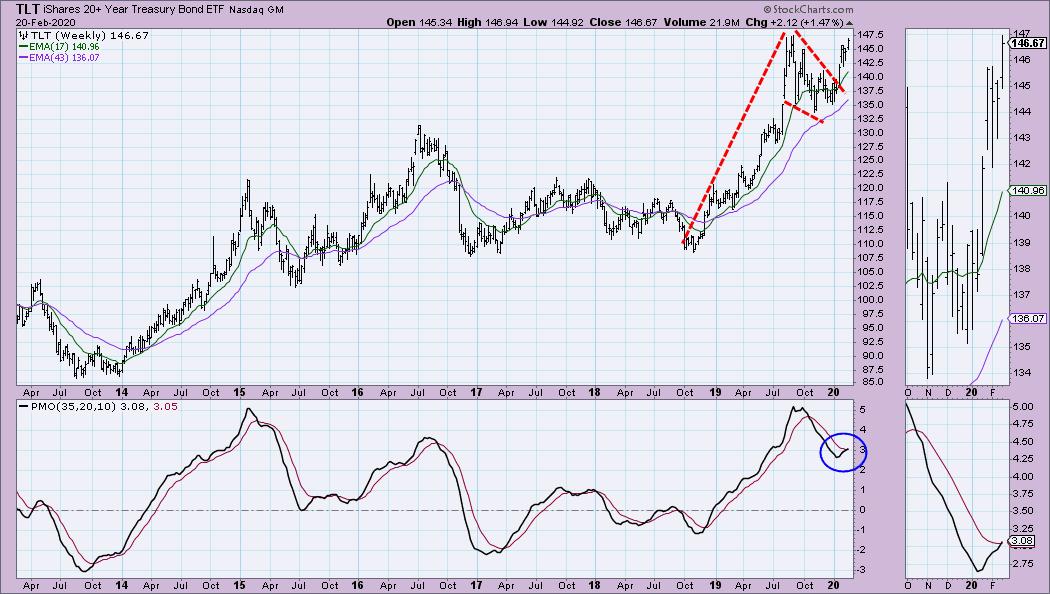
The weekly chart certainly suggests higher prices with a very large bull flag formation. The PMO just triggered an IT BUY signal. This is a steady in my portfolio, although I currently don't own in. Not a bad place to park right now.
Current Market Outlook:
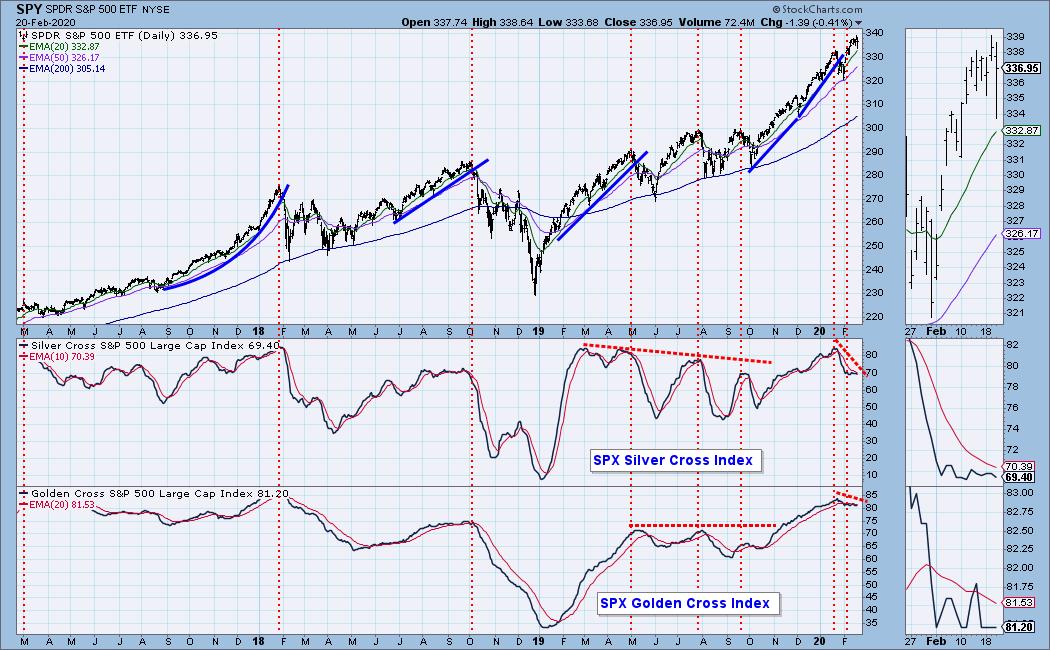
Market Environment: It is important to consider the odds for success. The Silver Cross Index measures the percentage of stocks on IT Trend Model BUY signals (20-EMA > 50-EMA), while the Golden Cross Index measures the percentage of stocks on LT Trend Model BUY signals (50-EMA > 200-EMA). Don't forget that as a "Diamonds" member, you have access to our GCI/SCI curated ChartList on DecisionPoint.com. You'll find it under "Members Only" links on the left side on the Blogs and Links Page. Here are the current percentages on the Silver and Golden Cross Indexes:
Diamond Index:
- Diamond Scan Results: 4
- Diamond Dog Scan Results: 7
- Diamond Bull/Bear Ratio: 0.57
For a more comprehensive review of current market conditions as well as analysis of Dollar, Gold, Oil and Bonds, subscribe to the DecisionPoint Alert! For a LIMITED TIME you can get a coupon code that will give you a discount for bundling your Diamonds subscription with the DecisionPoint Alert! Contact support@decisionpoint.com for more details.
Full Disclosure: I do not own any of the stocks above but I am stalking AGIO. I'm currently 20% in cash.

Erin Swenlin will be presenting at the The MoneyShow Las Vegas on May 11-13, 2020! You'll have an opportunity to meet Erin and discuss the latest DecisionPoint news and Diamond Scans. The conference is free to attend or view online!
Watch the latest episode of DecisionPoint with Carl & Erin Swenlin LIVE on Mondays 5:00p EST or on the StockCharts TV YouTube channel here!
Technical Analysis is a windsock, not a crystal ball.
Happy Charting!
- Erin
erinh@stockcharts.com
NOTE: The stocks reported herein are from mechanical trading model scans that are based upon moving average relationships, momentum and volume. DecisionPoint analysis is then applied to get five selections from the scans. The selections given should prompt readers to do a chart review using their own analysis process. This letter is not a call for a specific action to buy, sell or short any of the stocks provided. There are NO sure things or guaranteed returns on the daily selection of "diamonds in the rough."
Helpful DecisionPoint Links:
DecisionPoint Shared ChartList and DecisionPoint Chart Gallery
Price Momentum Oscillator (PMO)
Swenlin Trading Oscillators (STO-B and STO-V)
For more links, go to DecisionPoint.com!