
After the recent pullback in the market, I thought it would be fruitful to use Carl's Scan. This scan picks out extra beat down stocks that are oversold and full of potential if the conditions are right. I decided on two of them. The other three were pulled from my "Bullish EMAs - Mid-Range SCTR" Scan. I have noticed a lot of REITs coming up on the scans so I found one that isn't quite so overbought and could still run higher. On Monday I looked at Barrick Gold (GOLD). I still like Gold in general as well as Gold Miners so when another Gold related stock appeared in the scan results, I made sure to include it. Tomorrow is Reader Request stocks so email me at erin@decisionpoint.com. They don't have to be diamonds necessarily, I just want to give readers an opportunity to see how I read the charts of symbols that are on their radar.
Welcome to DecisionPoint Daily Diamonds, wherein I highlight five "diamonds in the rough." These are selected from the results of my DecisionPoint scans, which search for stocks that could benefit from the trend and condition of the market. Remember, these are not recommendations to buy or sell, but are the most interesting of the stocks that surfaced in my scans. My objective is to save you the work of the initial, tedious culling process, but you need to apply your own analysis to see if these stocks pique your interest as well. There are no guaranteed winners here!
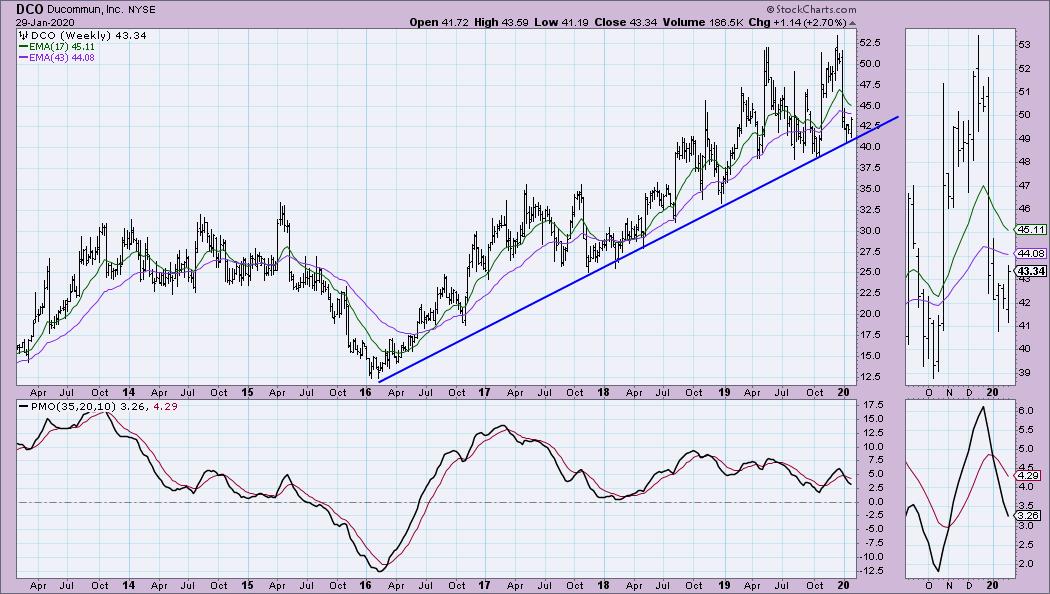
Ducommun Inc (DCO) - Earnings: 2/26 - 3/2/2020
This is from Carl's Scan. The PMO is bottoming nicely in very oversold territory. Price is coming up to the 20-EMA which could be a short-term problem for DCO. OBV looks great as it confirms the up trend. The SCTR is showing marked improvement. I think this one is ripe in the short term.

The weekly PMO isn't great, but price did take a deep dive last month. The PMO is nearing oversold territory. Rather than a parabolic rise (like many many of the stocks in the SPX), we have a steady rising bottoms trendline and price is bouncing off it again.
Don't forget, on Thursdays I look at reader-requested symbols, so shoot me an email at erin@decisionpoint.com. I read every email I receive and try to answer them all!
Legg Mason Inc (LM) - Earnings: 10/22 - 10/28/2019
Really nice breakout today on LM. The indicators tell me this one is poised to continue higher. This is the kind of short-term investment I generally go for because I can set up a fairly tight stop just below support. Yes, I get stopped out frequently with this, but in all honesty if it doesn't perform as I expect out the gate, I'd rather move on.
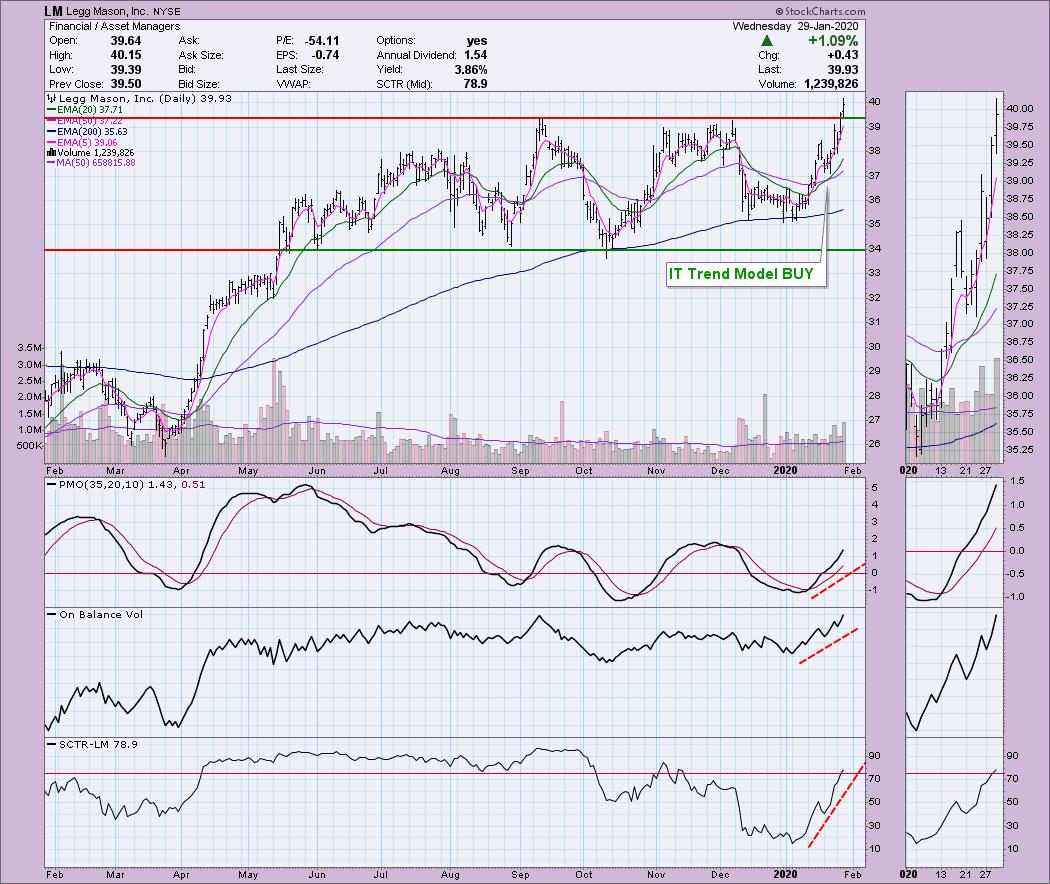
The importance of this breakout is significant. Notice how it coincides with the lows from 2014 and that top from late 2015. The PMO has turned up. The only issue I see is overhead resistance is lurking closer than I like.
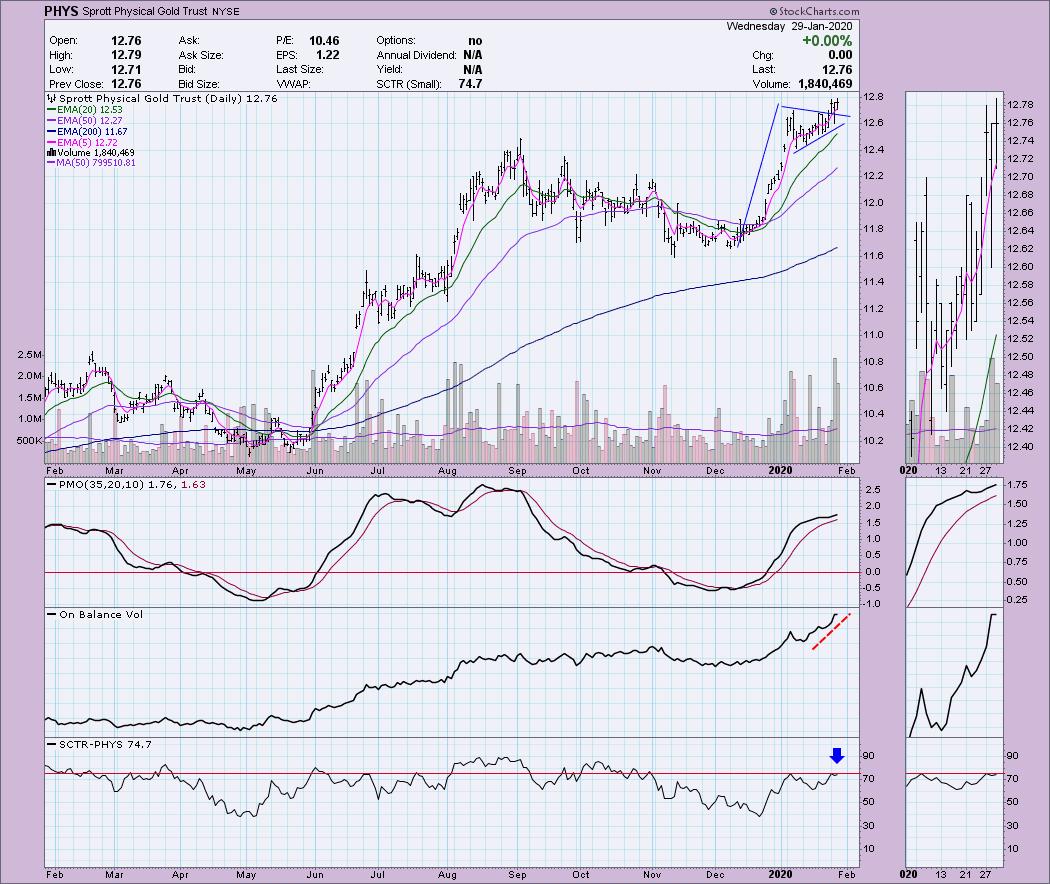
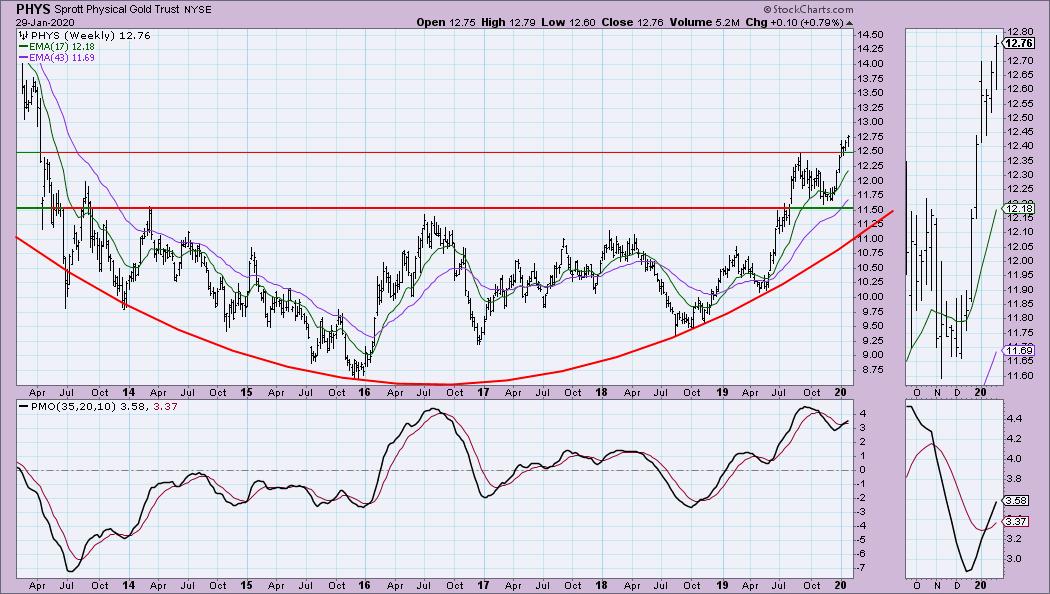
Sprott Physical Gold Trust (PHYS) - Earnings: N/A
This is a closed ended fund so Carl and I actually use it to calculate premiums and discounts for use on our Gold chart as a sentiment indicator. Price has broken out of a flag formation. The PMO is rising and isn't particularly overbought. OBV confirmed the breakout by have its own breakout. The SCTR is just about in the 'hot zone' above 75.
There is a very large saucer shaped bottom on the weekly chart, this is bullish. The PMO is overbought, but there is room for it to move higher and stretch even further. I see another bull flag on the weekly chart as well and it executed. Minimum upside target of the flag would be around $14.50 - $15.00.
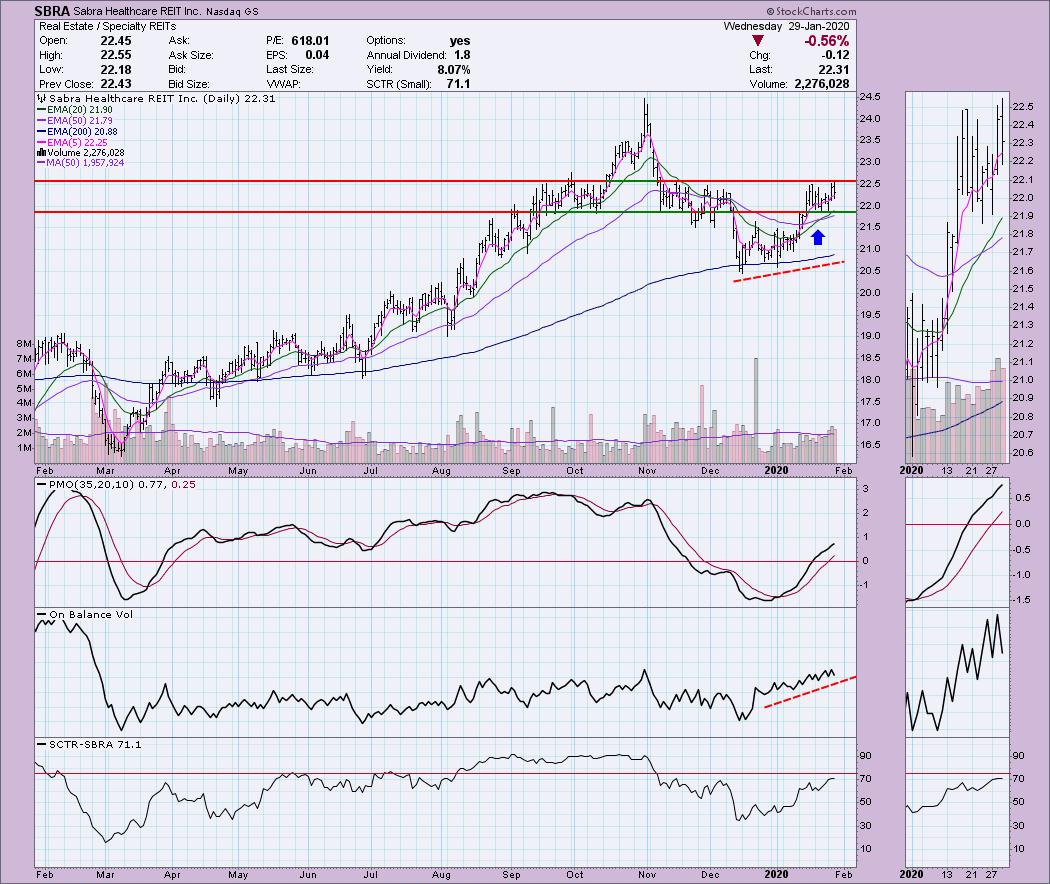
Sabra Healthcare REIT Inc (SBRA) - Earnings: 2/24 - 2/28/2020
This REIT hasn't quite broken out of a consolidation zone, but it certainly looks ready to. We have an IT Trend Model BUY signal and the PMO is rising and now above zero. OBV is confirming the uptrend.
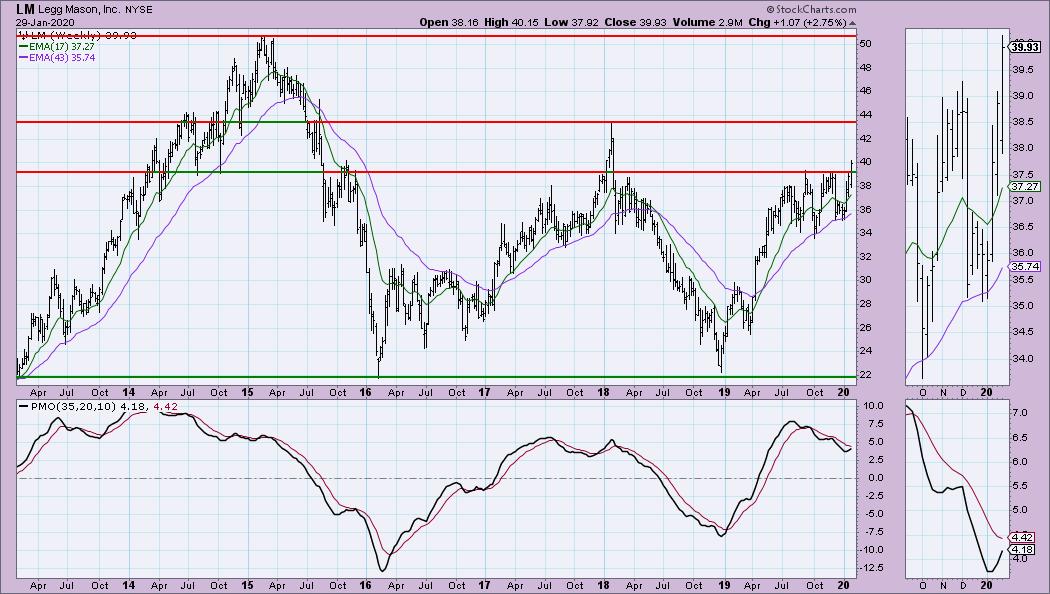
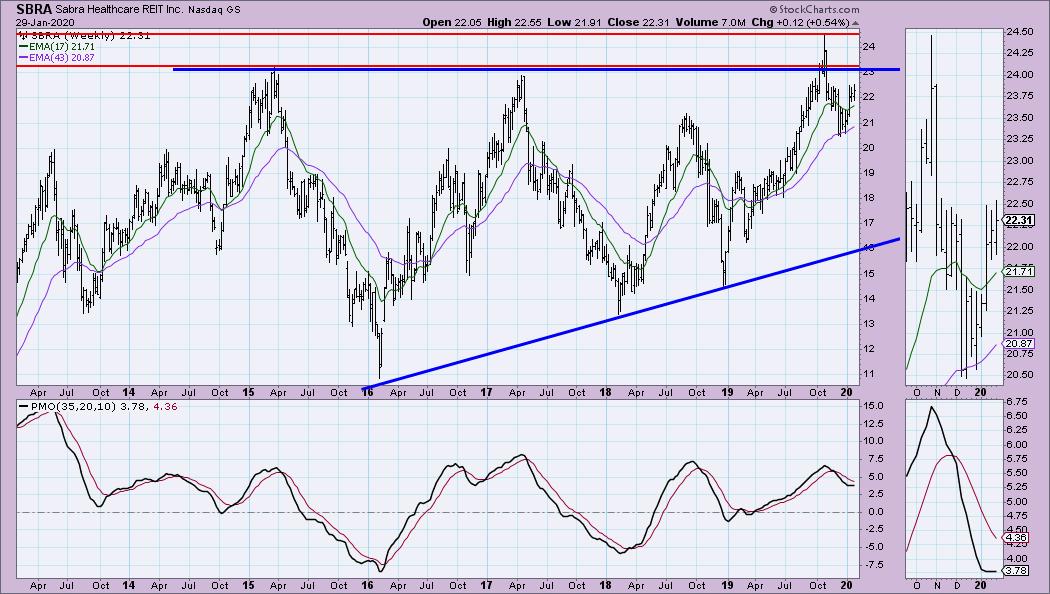
I think you can make a case for a long-term ascending triangle. The last breakout failed, but I think price is going back to finally execute the triangle the right way, with a prolonged rally. The weekly PMO has turned up above the zero line and price bounced off the 43-week EMA. All positives.
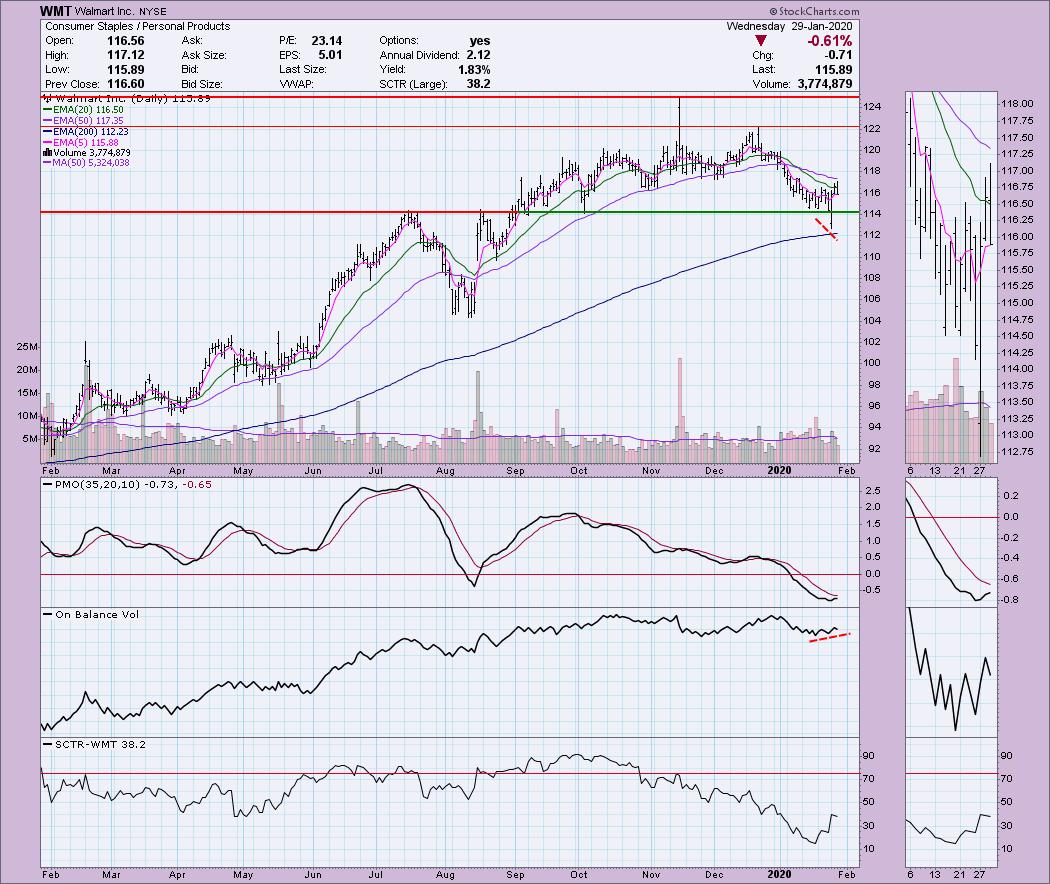
Walmart Inc (WMT) - Earnings: 2/18/2020
This came up in Carl's Scan. If you recall, on Monday I gave you Costco, another Consumer Staple, so when I saw this one on Carl's Scan, I had to include it. First thing that caught my eye was the positive divergence between the OBV and price lows. The PMO is turning up in oversold territory and the SCTR has already begun to make a move toward the 'hot zone' above 75.
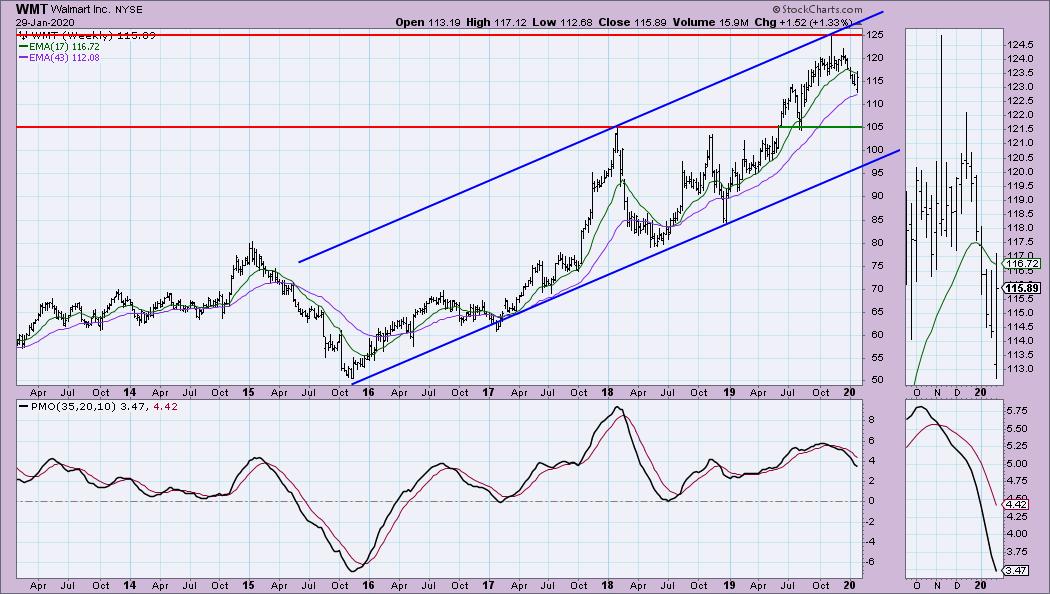
The weekly chart isn't too pretty as price appears to be in a topping pattern and the weekly PMO is declining. If it can hold onto the rising bottoms trendline and especially the 43-week EMA, I think it will be rebounding and breaking out. It is a very large range in that rising trend channel which does add risk unless you put a stop in that will prevent you from having to suck up a move down to test the bottom of the channel. Remember it's hard to find a 'beat down' stock with a good weekly chart.
Current Market Outlook:
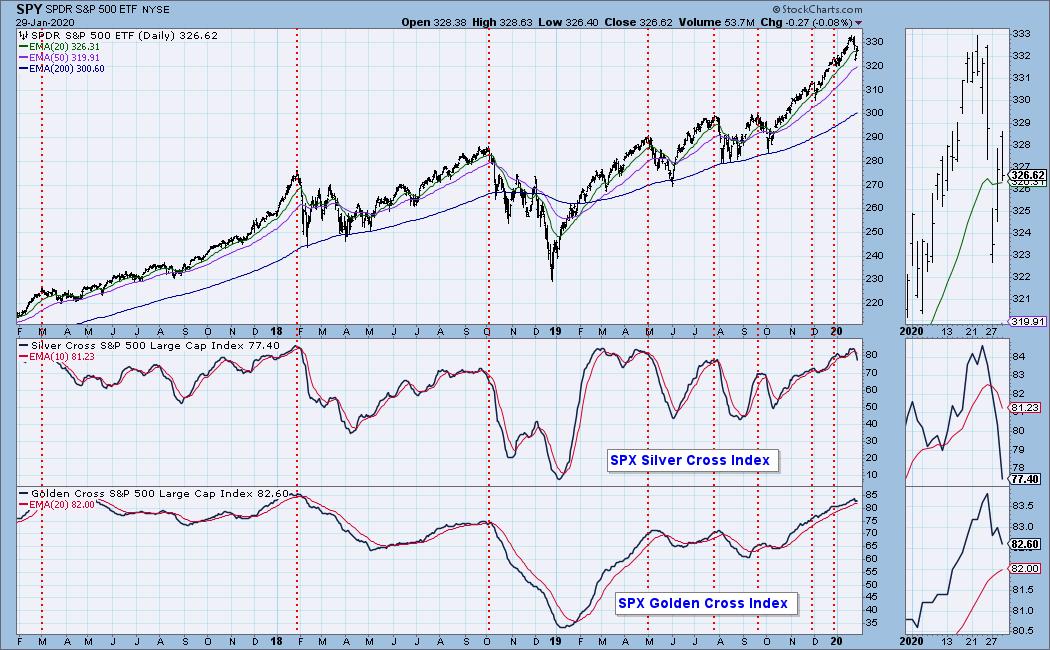
Market Environment: It is important to consider the odds for success. The Silver Cross Index measures the percentage of stocks on IT Trend Model BUY signals (20-EMA > 50-EMA), while the Golden Cross Index measures the percentage of stocks on LT Trend Model BUY signals (50-EMA > 200-EMA). Don't forget that as a "Diamonds" member, you have access to our GCI/SCI curated ChartList on DecisionPoint.com. You'll find it under "Members Only" links on the left side on the Blogs and Links Page. Here are the current percentages on the Silver and Golden Cross Indexes:
Diamond Index:
- Diamond Scan Results: 1
- Diamond Dog Scan Results: 10
- Diamond Bull/Bear Ratio: 0.10
For a more comprehensive review of current market conditions as well as analysis of Dollar, Gold, Oil and Bonds, subscribe to the DecisionPoint Alert! For a LIMITED TIME you can get a coupon code that will give you a discount for bundling your Diamonds subscription with the DecisionPoint Alert! Contact support@decisionpoint.com for more details.
Full Disclosure: I do not own any of the stocks above. I'm currently 35% in cash.

Erin Swenlin will be presenting at the The MoneyShow Las Vegas on May 11-13, 2020! You'll have an opportunity to meet Erin and discuss the latest DecisionPoint news and Diamond Scans. The conference is free to attend or view online!
Watch the latest episode of DecisionPoint with Carl & Erin Swenlin LIVE on Mondays 5:00p EST or on the StockCharts TV YouTube channel here!
Technical Analysis is a windsock, not a crystal ball.
Happy Charting!
- Erin
erinh@stockcharts.com
NOTE: The stocks reported herein are from mechanical trading model scans that are based upon moving average relationships, momentum and volume. DecisionPoint analysis is then applied to get five selections from the scans. The selections given should prompt readers to do a chart review using their own analysis process. This letter is not a call for a specific action to buy, sell or short any of the stocks provided. There are NO sure things or guaranteed returns on the daily selection of "diamonds in the rough."
Helpful DecisionPoint Links:
DecisionPoint Shared ChartList and DecisionPoint Chart Gallery
Price Momentum Oscillator (PMO)
Swenlin Trading Oscillators (STO-B and STO-V)
For more links, go to DecisionPoint.com!