
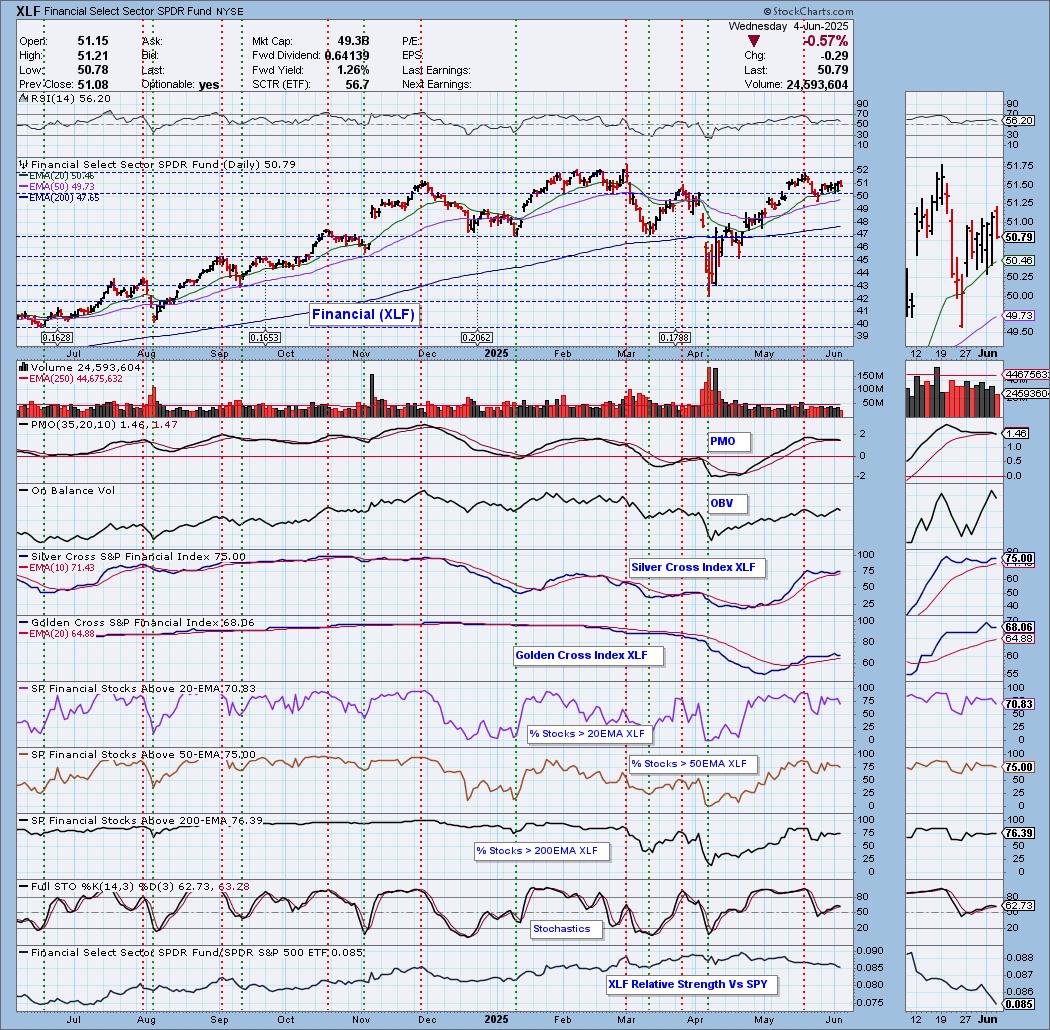
Financials (XLF) saw a negative PMO Crossover SELL Signal today. Price is still melting upward and is staying above the 50-day EMA. This is a warning shot that XLF may start drifting lower soon. Participation is still fairly strong holding above 70%, but Stochastics did top and we can see that the sector is seriously underperforming the SPY. The Silver Cross Index has topped. We aren't so sure it will completely fall apart, but you've been warned in case it does.
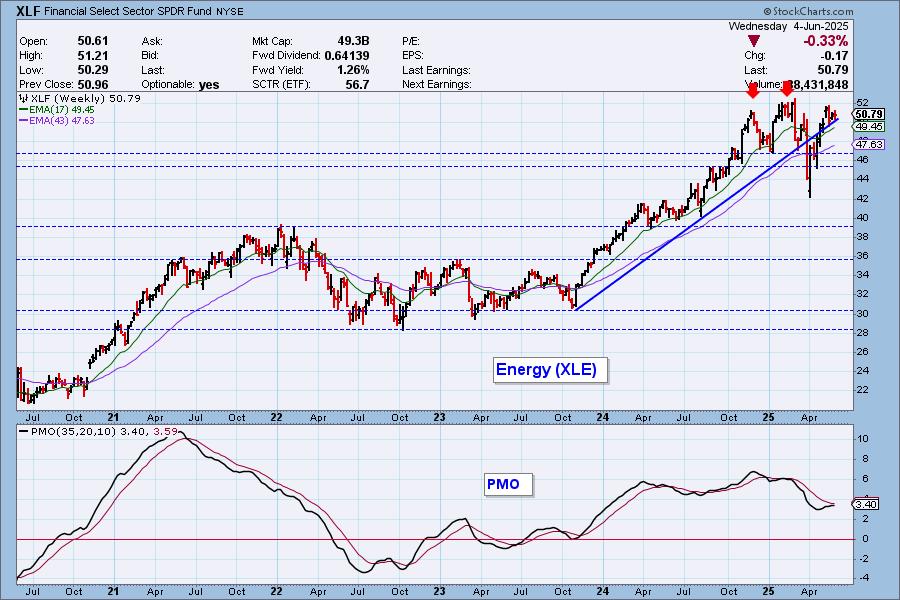
The double top fulfilled on the weekly chart with the deep decline below the rising bottoms trendline. Price has now recaptured that trendline. The weekly PMO is still on the rise. While we got this PMO SELL Signal, it seems to be a short-term caution flag.
The DecisionPoint Alert Weekly Wrap presents an end-of-week assessment of the trend and condition of the Stock Market, the U.S. Dollar, Gold, Crude Oil, and Bonds. The DecisionPoint Alert daily report (Monday through Thursday) is abbreviated and gives updates on the Weekly Wrap assessments.
MARKET/INDUSTRY GROUP/SECTOR INDEXES
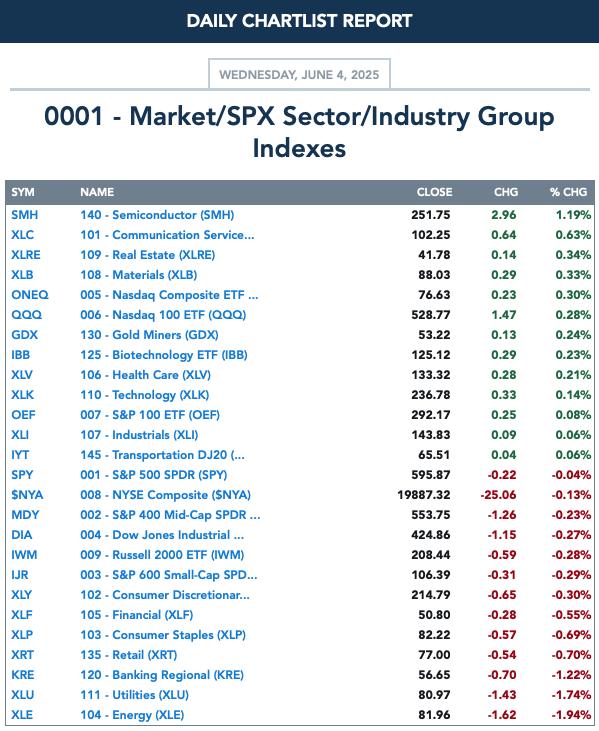
CLICK HERE for Carl's annotated Market Index, Sector, and Industry Group charts.
THE MARKET (S&P 500)
IT Trend Model: NEUTRAL as of 3/4/2025
LT Trend Model: SELL as of 4/16/2025
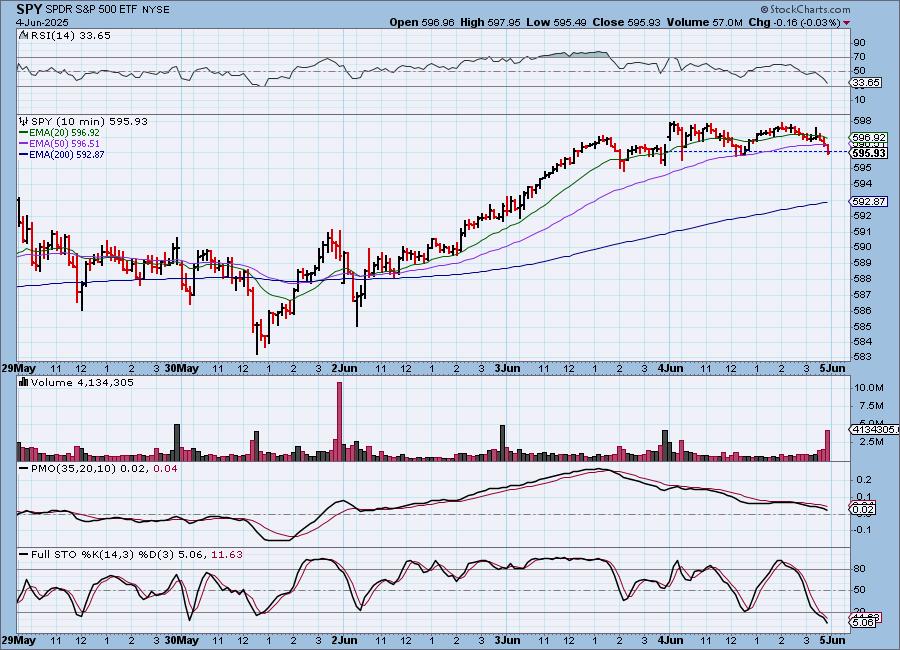
SPY 10-Minute Chart: The market went into pause mode today. It spent most of the day in positive territory but ultimately finished very slightly lower. The upside initiation climax did not fulfill which is bearish.
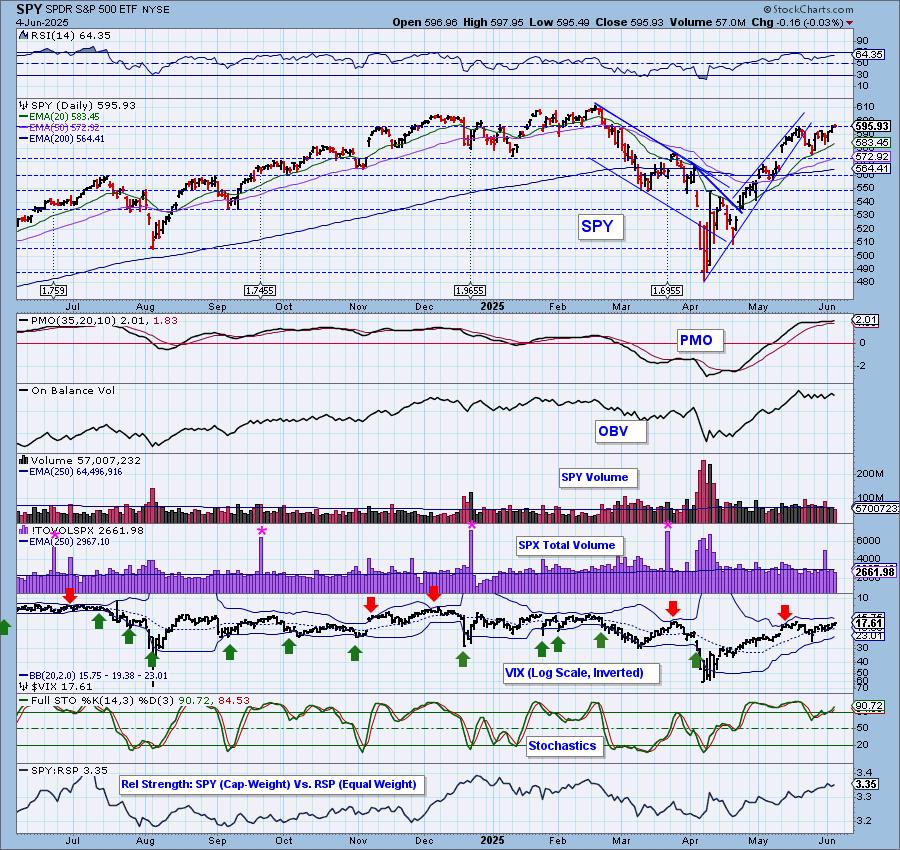
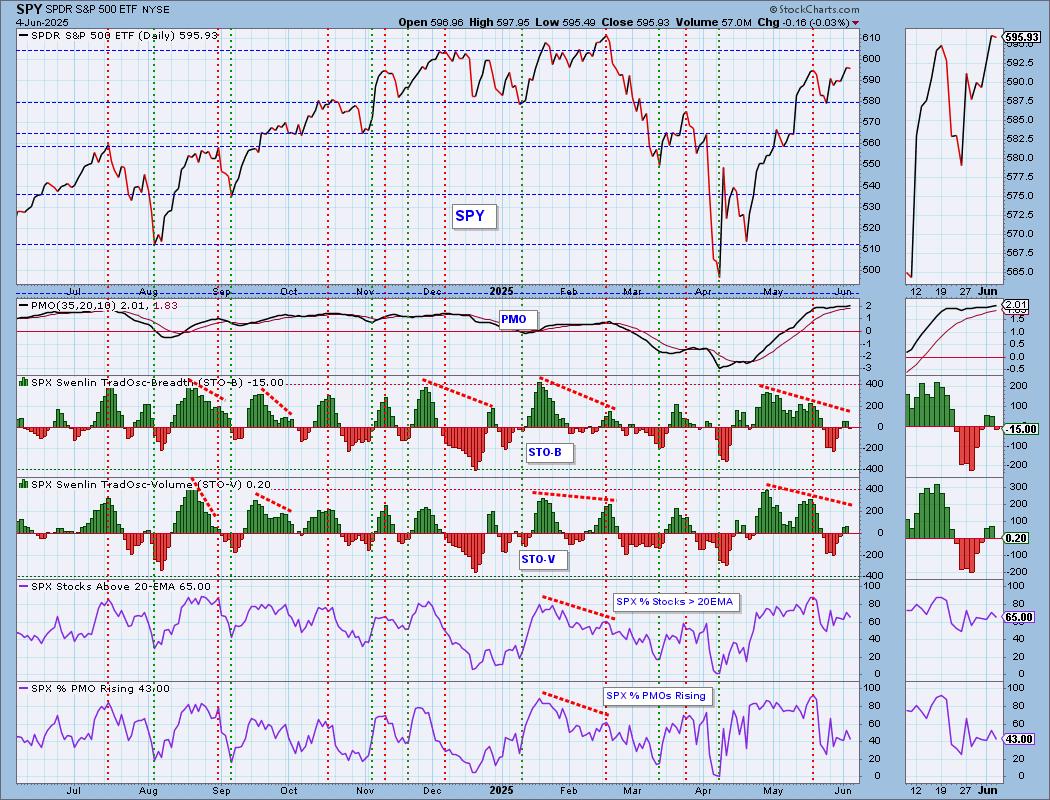
SPY Daily Chart: Price did form a higher high and a higher low despite the negative close. The PMO is still moving higher for now. The RSI is positive and not yet overbought.

The Bollinger Bands on the VIX are shrinking so we could see a puncture in either direction should we see some volatility injected into the market. For now it is above its moving average on the inverted scale and that is bullish. Stochastics also look very bullish above 80 and rising.
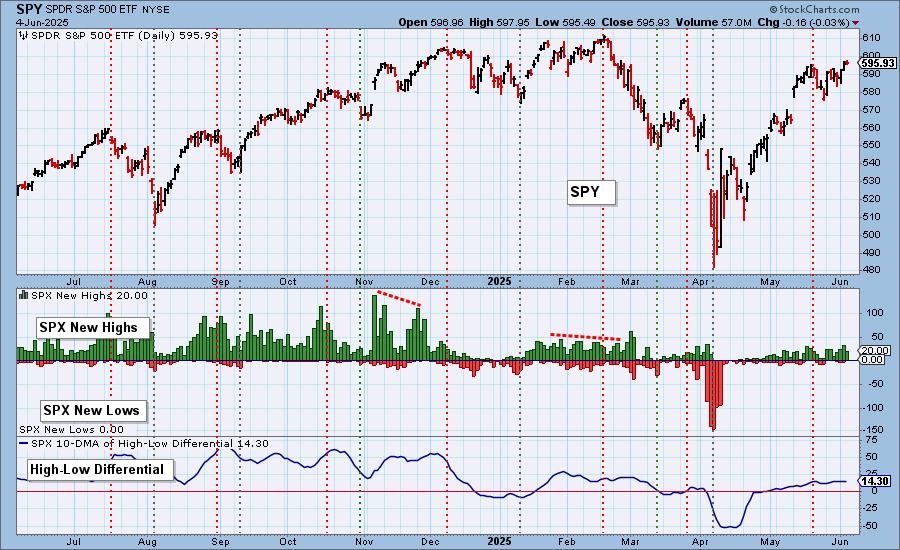
S&P 500 New 52-Week Highs/Lows: No New Lows were logged today on the decline which is good news, but given the decline was minuscule, it isn't surprising. New Highs did contract as we would expect. The High-Low Differential is still rising.
Climax* Analysis: There were no climax readings today.
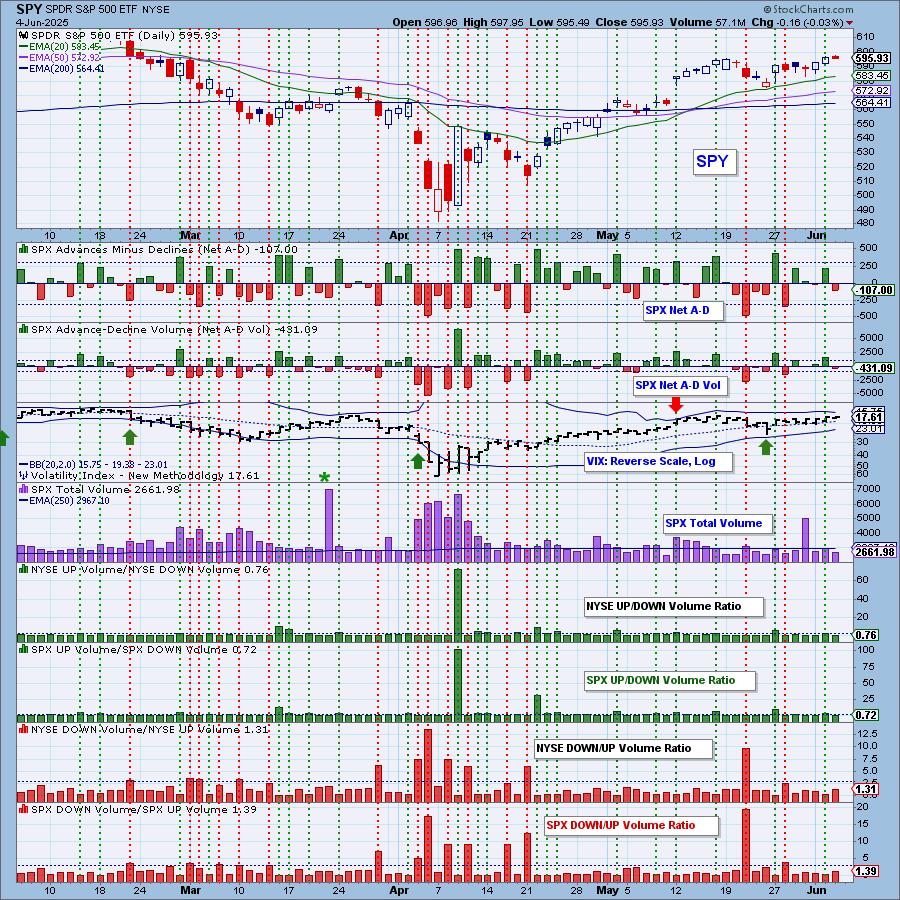
*A climax is a one-day event when market action generates very high readings in, primarily, breadth and volume indicators. We also include the VIX, watching for it to penetrate outside the Bollinger Band envelope. The vertical dotted lines mark climax days -- red for downside climaxes, and green for upside. Climaxes are at their core exhaustion events; however, at price pivots they may be initiating a change of trend.
Short-Term Market Indicators: The short-term market trend is UP and the condition is NEUTRAL.
The Swenlin Trading Oscillators (STOs) both turned down today with the STO-B landing in negative territory. Negative divergences are in place. Participation shrank on the decline, but is still reading at a healthy 65%. We lost rising momentum within the index. %PMOs Rising is below our 50% bullish threshold.
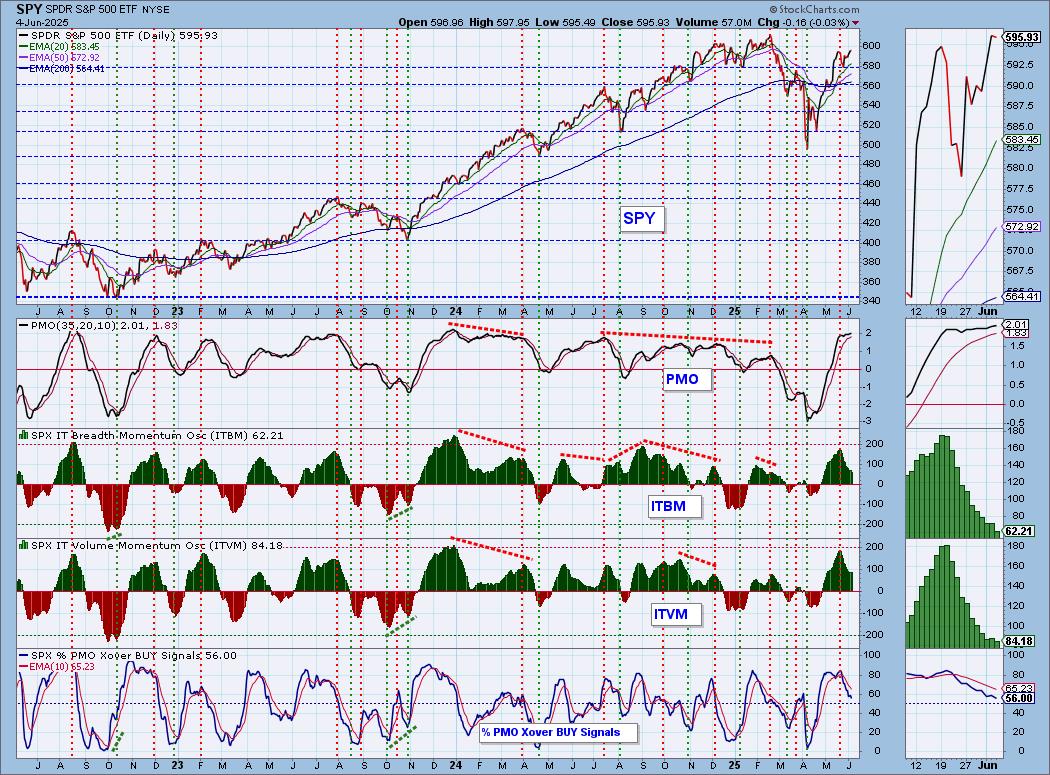
Intermediate-Term Market Indicators: The intermediate-term market trend is UP and the condition is OVERBOUGHT.
The ITVM may've turned up yesterday, but it turned right back down today. The ITBM continued its fall. %PMO Xover BUY Signals topped beneath the signal line.
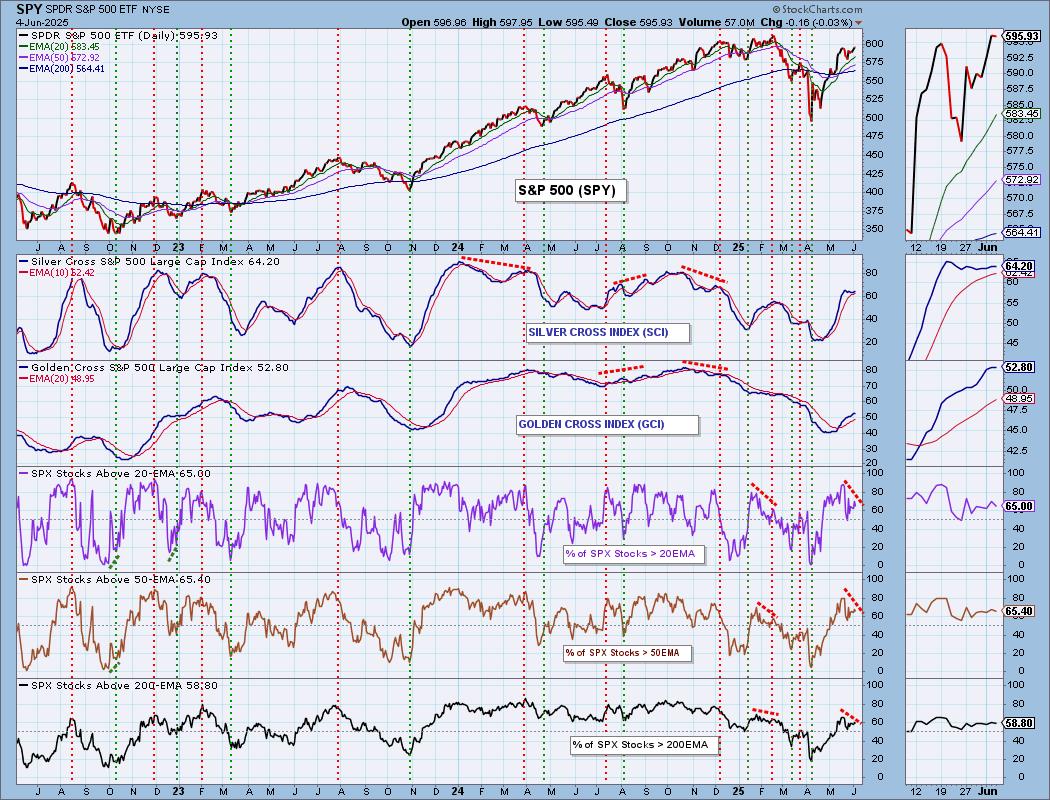
PARTICIPATION CHART (S&P 500): The following chart objectively shows the depth and trend of participation for the SPX in two time frames.
- Intermediate-Term - the Silver Cross Index (SCI) shows the percentage of SPX stocks on IT Trend Model BUY signals (20-EMA > 50-EMA). The opposite of the Silver Cross is a "Dark Cross" -- those stocks are, at the very least, in a correction.
- Long-Term - the Golden Cross Index (GCI) shows the percentage of SPX stocks on LT Trend Model BUY signals (50-EMA > 200-EMA). The opposite of a Golden Cross is the "Death Cross" -- those stocks are in a bear market.
The market bias is BULLISH in the intermediate and long terms.
Participation indicators are all showing negative divergences with price. They are reading above our bullish 50% threshold, but are moving lower. The Silver Cross Index is in a holding pattern. It is above its signal line so the IT Bias is BULLISH. The Golden Cross Index is decelerating, but given we have more stocks above their 50/200-day EMAs, it should continue to rise a bit longer. It is above its signal line so the LT Bias is BULLISH.
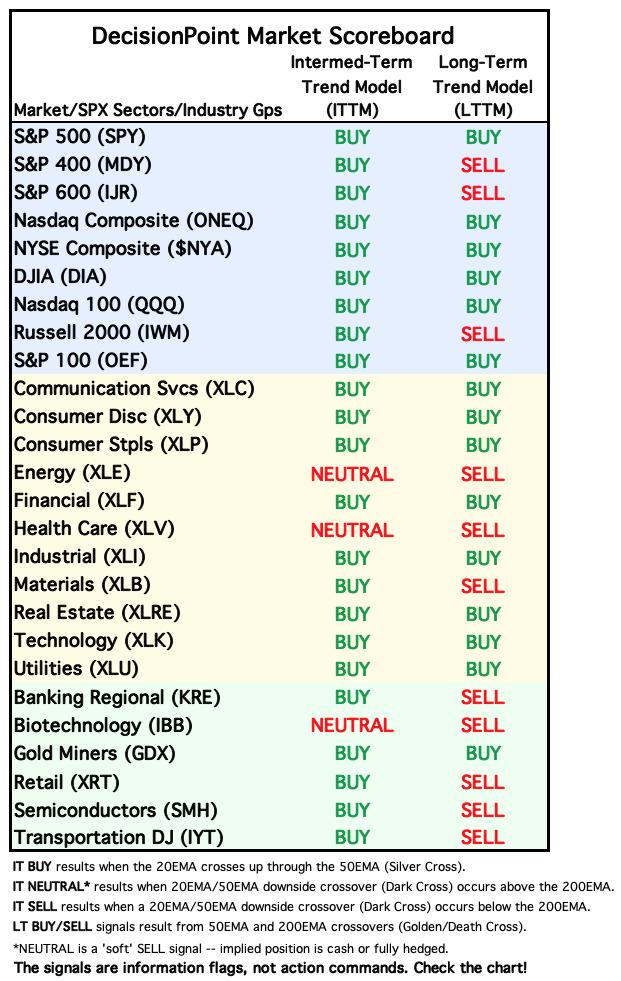
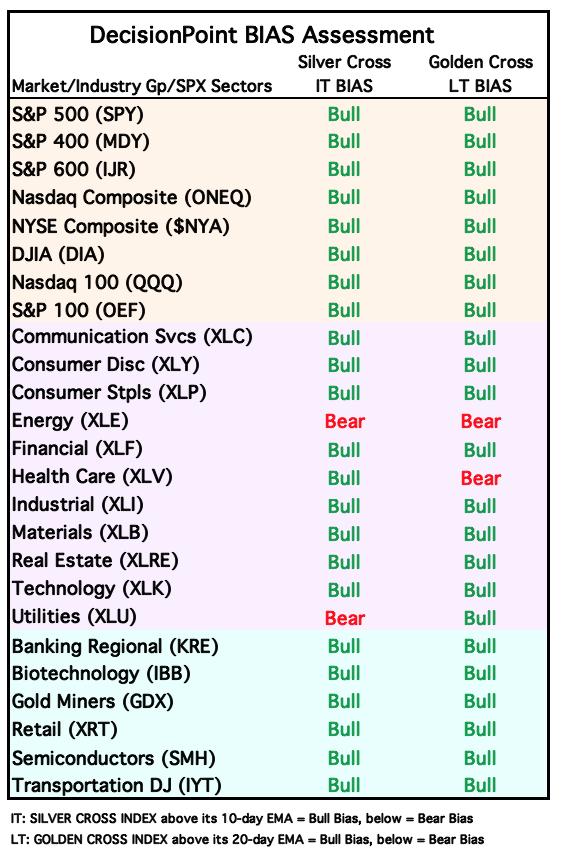
BIAS Assessment: The following table expresses the current BIAS of various price indexes based upon the relationship of the Silver Cross Index to its 10-day EMA (intermediate-term), and of the Golden Cross Index to its 20-day EMA (long-term). When the Index is above the EMA it is bullish, and it is bearish when the Index is below the EMA. The BIAS does not imply that any particular action should be taken. It is information to be used in the decision process.
The items with highlighted borders indicate that the BIAS changed today.
*****************************************************************************************************
CONCLUSION: We must say that the PMO and Stochastics do imply we'll see more upside ahead. The Bias Table also looks very bullish. Unfortunately, the STOs have turned back down and we don't have that many rising PMOs within the index to hold price up. We are also losing PMO BUY Signals. Both the ITBM and ITVM are falling again. At this point we see the market struggling to get the rally going again. We need to be careful and not get complacent given we are seeing some cracks in the foundation. Internals could be better. We would look for more sideways movement until participation numbers start dropping. We have a jobs report due out tomorrow. We've seen mixed reviews on the job market. Tomorrow will give us more insight. Today's less than stellar ADP Employment report was blamed on keeping the market in check today. We could see some volatility associated with tomorrow's report.
Erin is 60% long, 0% short. (This is intended as information, not a recommendation.)
*****************************************************************************************************
CALENDAR

BITCOIN
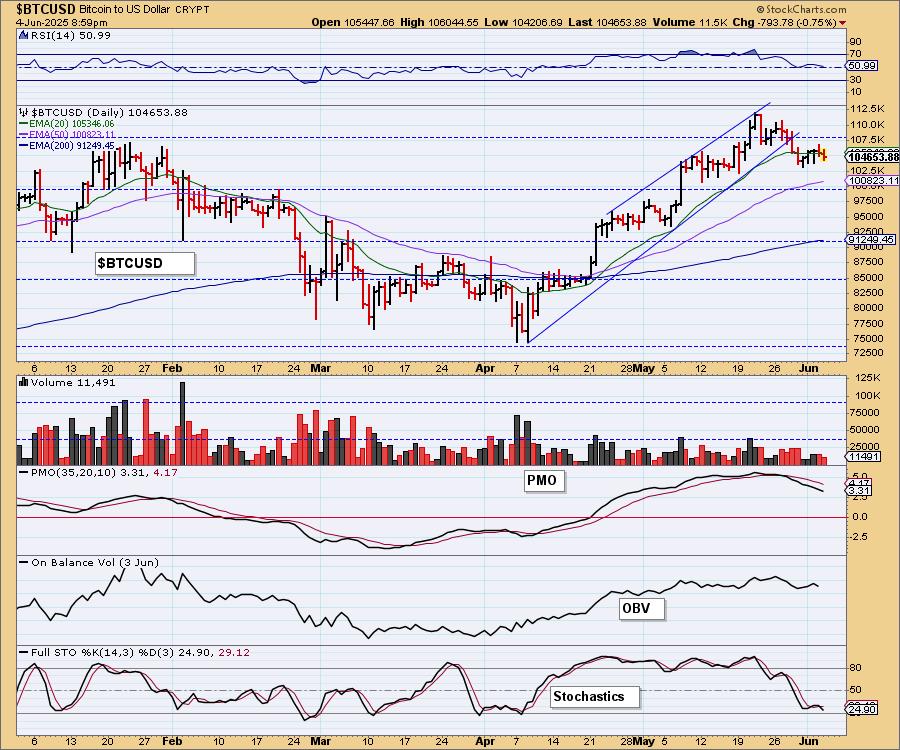
Bitcoin is holding it together, especially given the negative PMO and very negative Stochastics. We do think it is vulnerable to more decline here given those negative indicators.
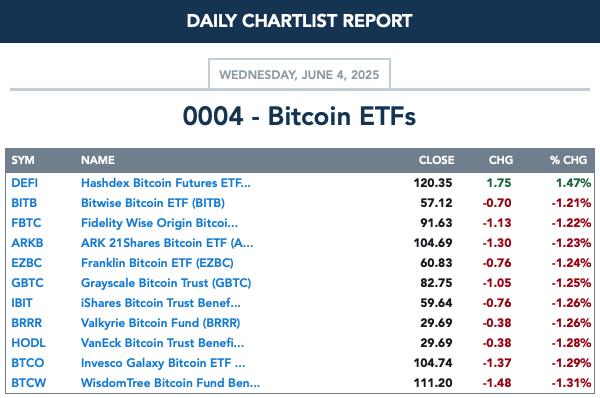
BITCOIN ETFs
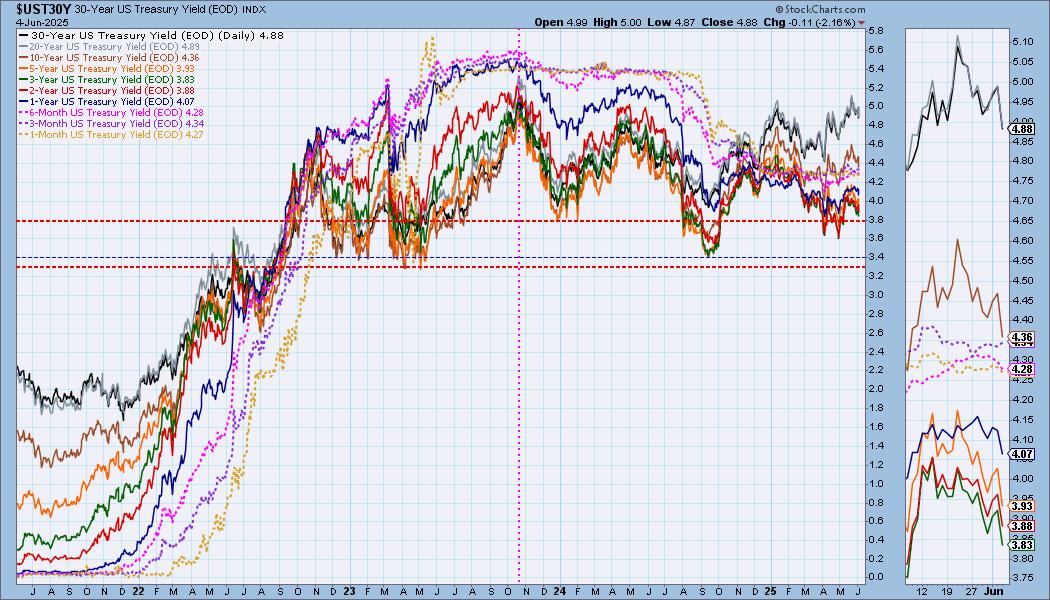
INTEREST RATES
Yields fell heavily today, putting in question our bullish stance. We are seeing new declining trends now so they are vulnerable to more decline.
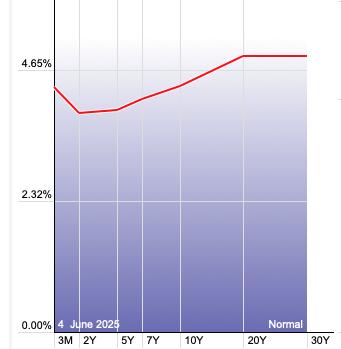
The Yield Curve Chart from StockCharts.com shows us the inversions taking place. The red line should move higher from left to right. Inversions are occurring where it moves downward.
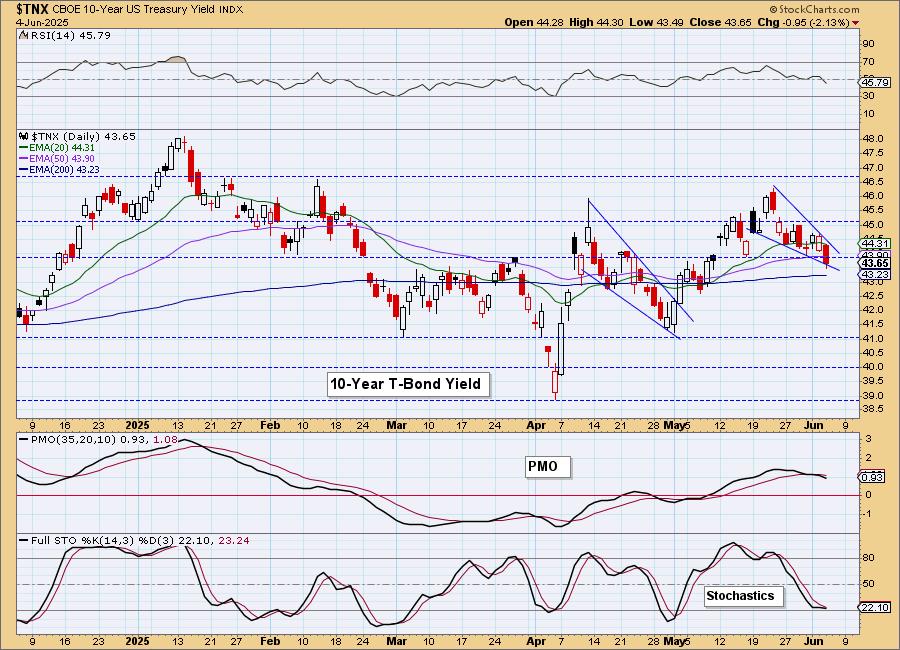
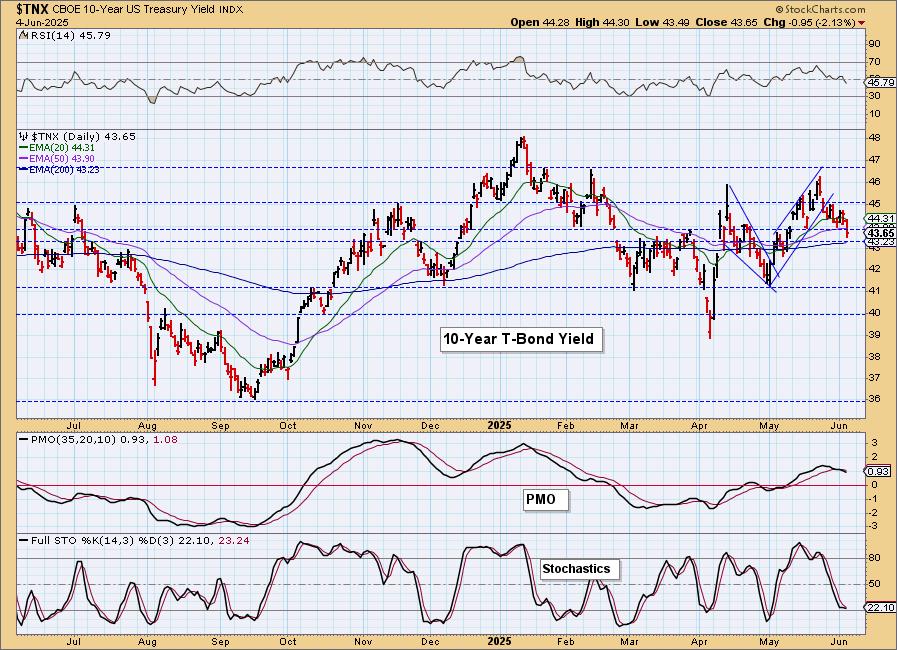
10-YEAR T-BOND YIELD
We've now identified a bullish falling wedge on $TNX that implies we will see a breakout soon. The indicators are not in agreement and tell us $TNX is very vulnerable to more downside. The RSI has moved into negative territory and the PMO is falling on a Crossover SELL Signal. Stochastics are trying to top in negative territory. The 200-day EMA is nearing as support. We'll look for a possible upside reversal but we're not that optimistic.
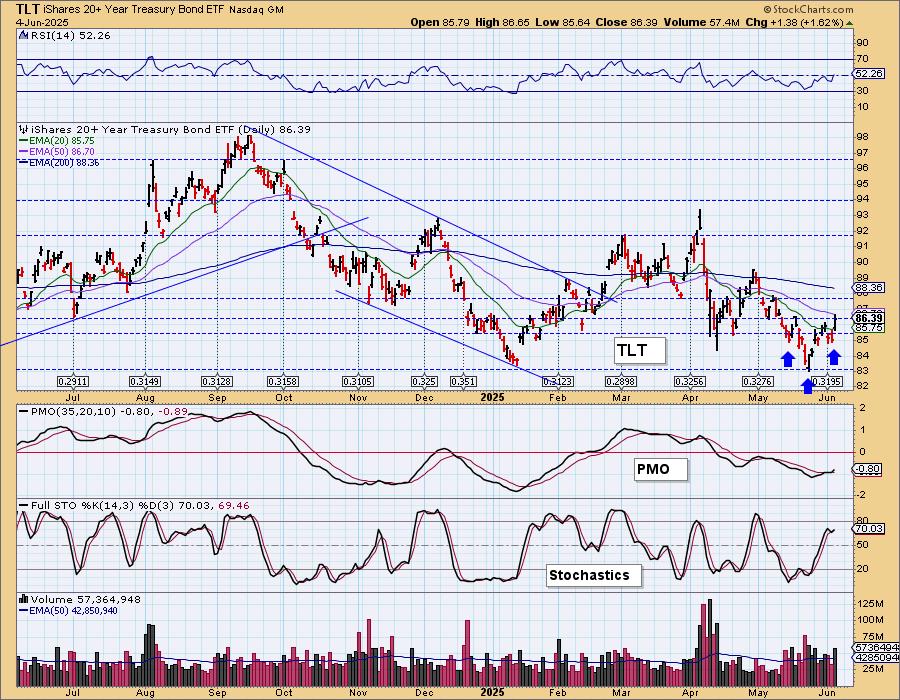
BONDS (TLT)
IT Trend Model: SELL as of 4/14/2025
LT Trend Model: SELL as of 12/13/2024
TLT Daily Chart: TLT rallied as the 20-year yield tumbled. It does look fairly bullish with the new rising trend out of the declining trend channel. The RSI just moved into positive territory and the PMO is on a new Crossover BUY Signal, so maybe we shouldn't count out Bonds yet. Stochastics have turned back up in positive territory.
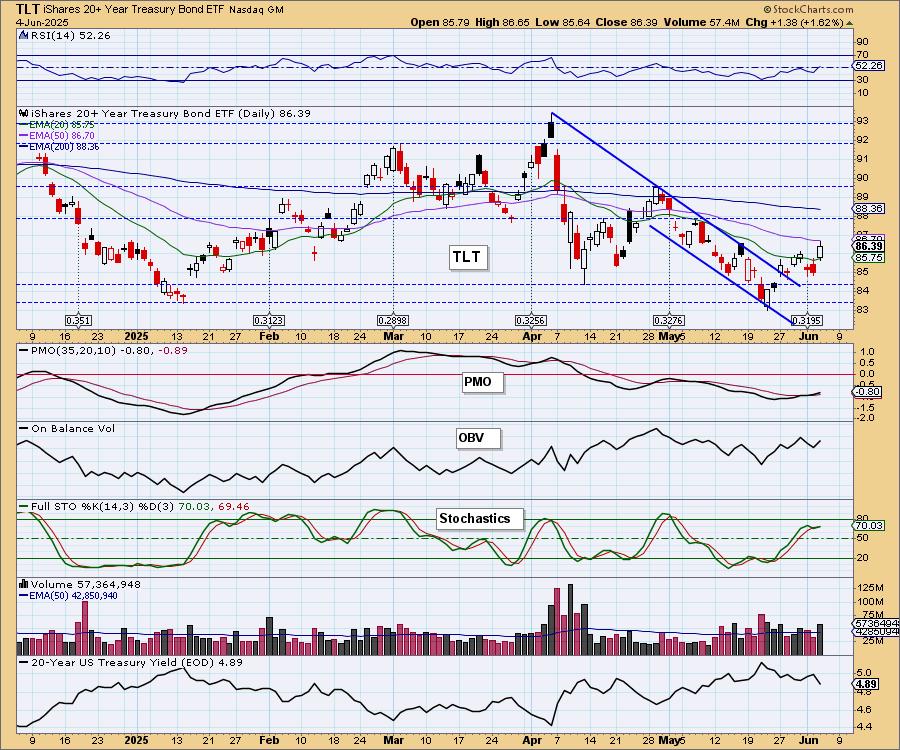
We've spotted a reverse head and shoulders on the chart that was confirmed with today's breakout. Its upside target would take price to the late April top.
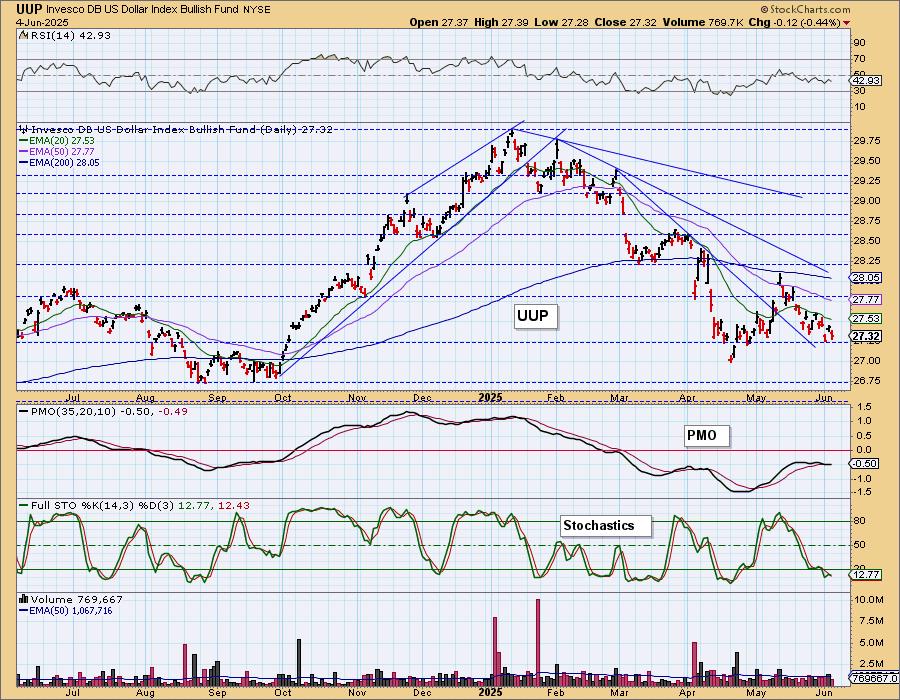
DOLLAR (UUP)
IT Trend Model: NEUTRAL as of 3/5/2025
LT Trend Model: SELL as of 4/25/2025
UUP Daily Chart: The Dollar looks bearish in its short-term and intermediate-term declining trends. The PMO has just triggered a Crossover SELL Signal below the zero line which is especially bearish. Stochastics topped below 20. We are looking for support to be tested at 27.
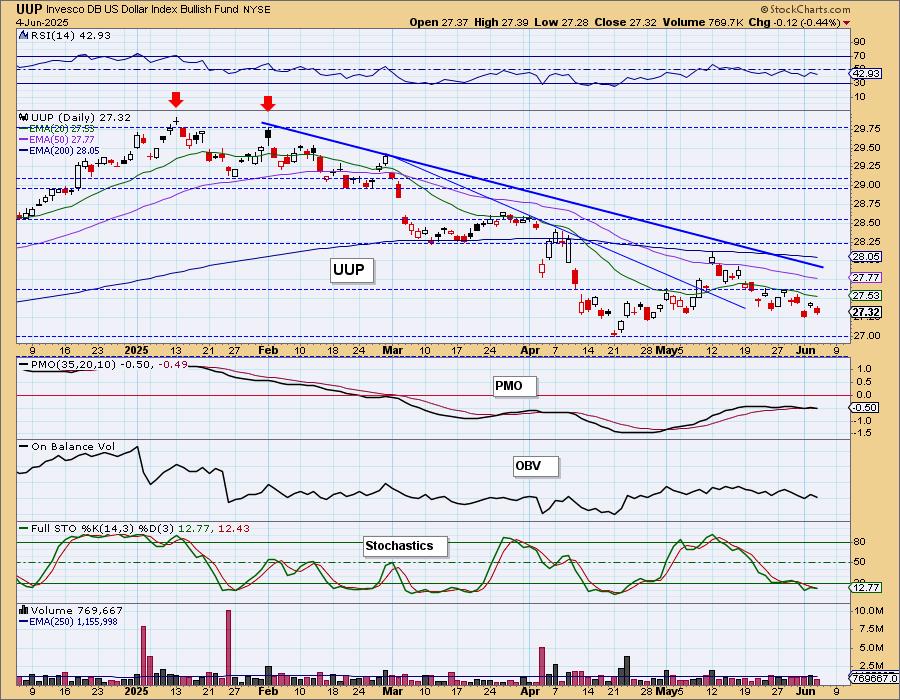
The strongest level of support lies at 26.75.
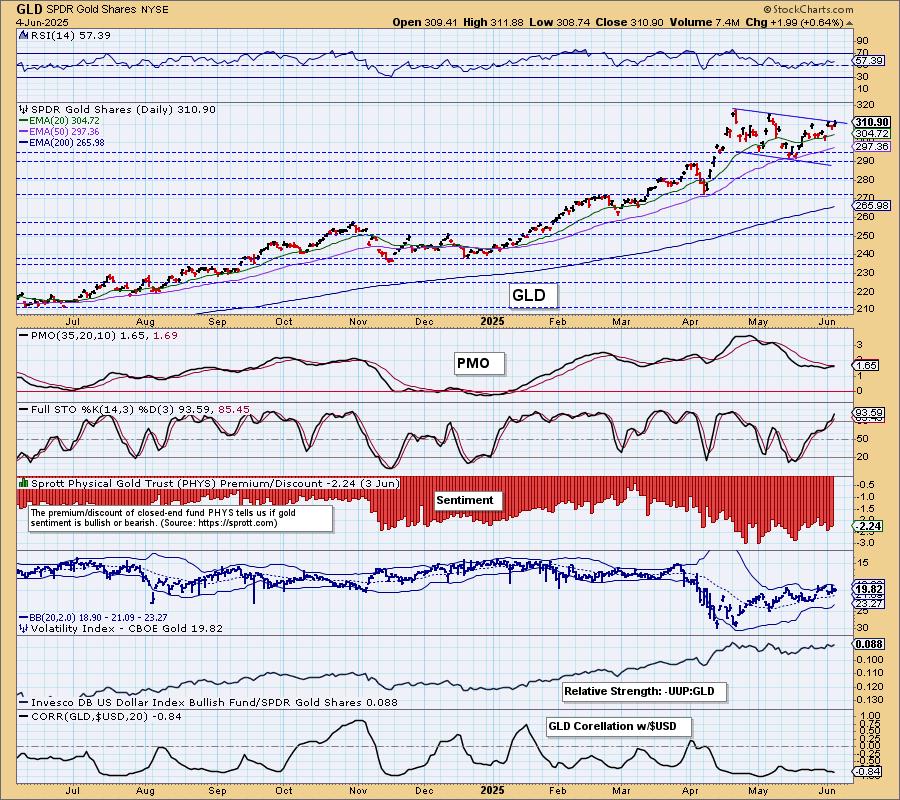
GOLD
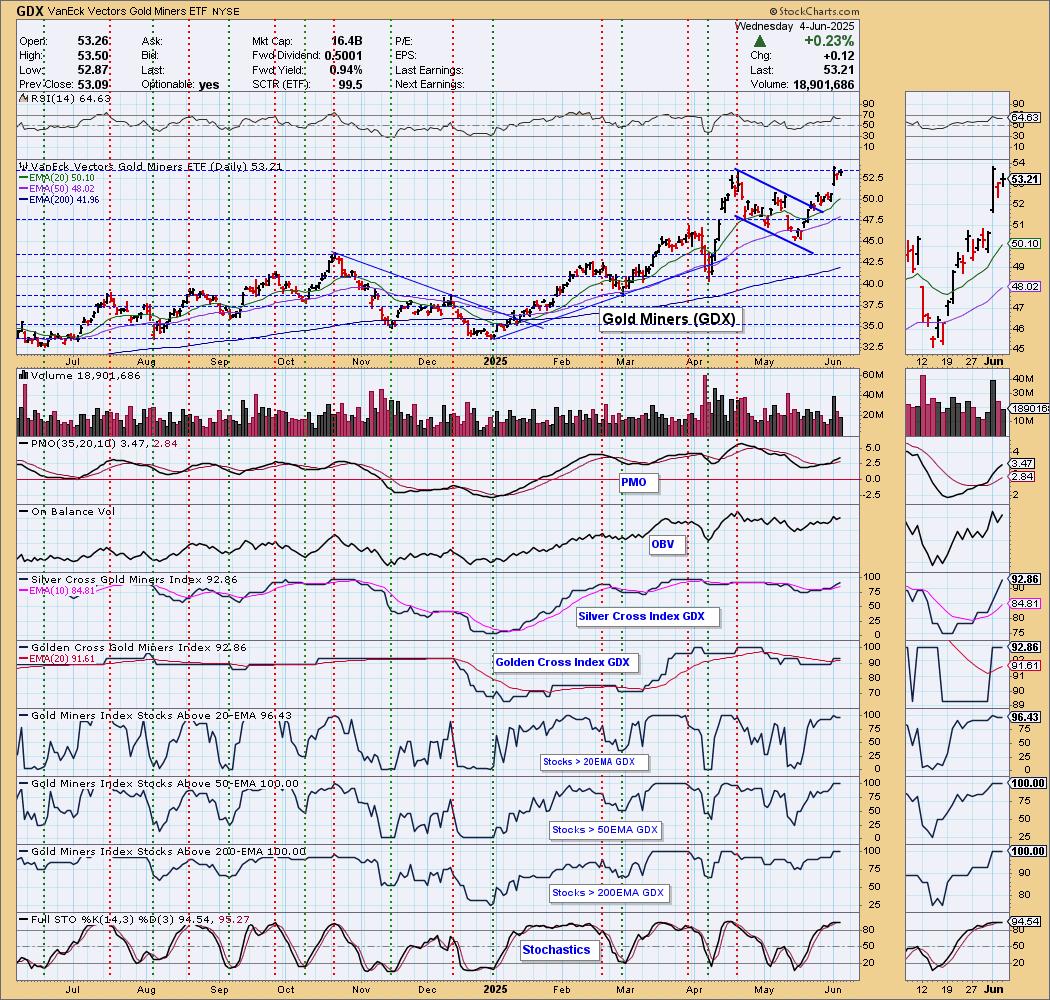
IT Trend Model: BUY as of 1/10/2025
LT Trend Model: BUY as of 10/20/2023
GLD Daily Chart: Gold rallied on the weak Dollar, but it was up more percentage points than the Dollar suggesting we had some extra buyers in there. Price is holding above the prior declining trend channel and looks ready to rally higher. The PMO is nearing a Crossover BUY Signal and Stochastics are using above 80. The Dollar is weak so we would look for new all-time highs for Gold.
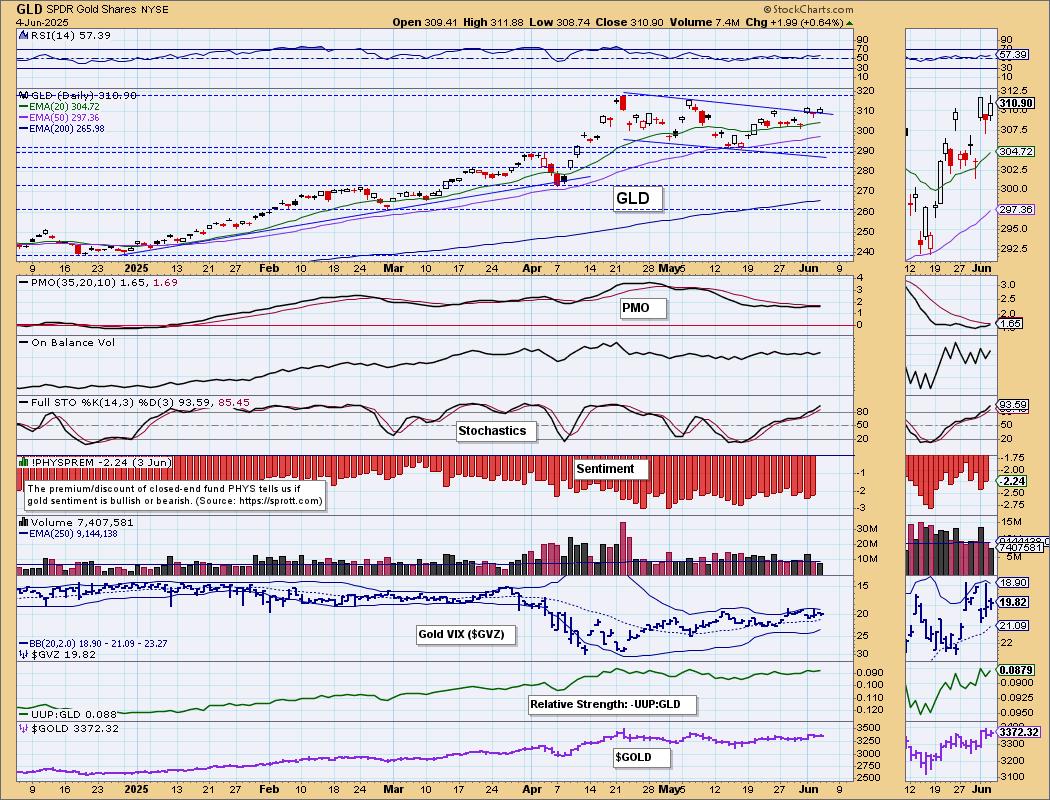
We have a nice rising trend on relative strength to the Dollar.
GOLD MINERS (GDX) Daily Chart: Gold Miners were up slightly. We would've expected more out of them given the rally in Gold. They have hit overhead resistance and that could be the hold up. The indicators and participation are extremely bullish so we would look for a breakout. With Gold looking so bullish, we are very bullish on Gold Miners.
CRUDE OIL (USO)
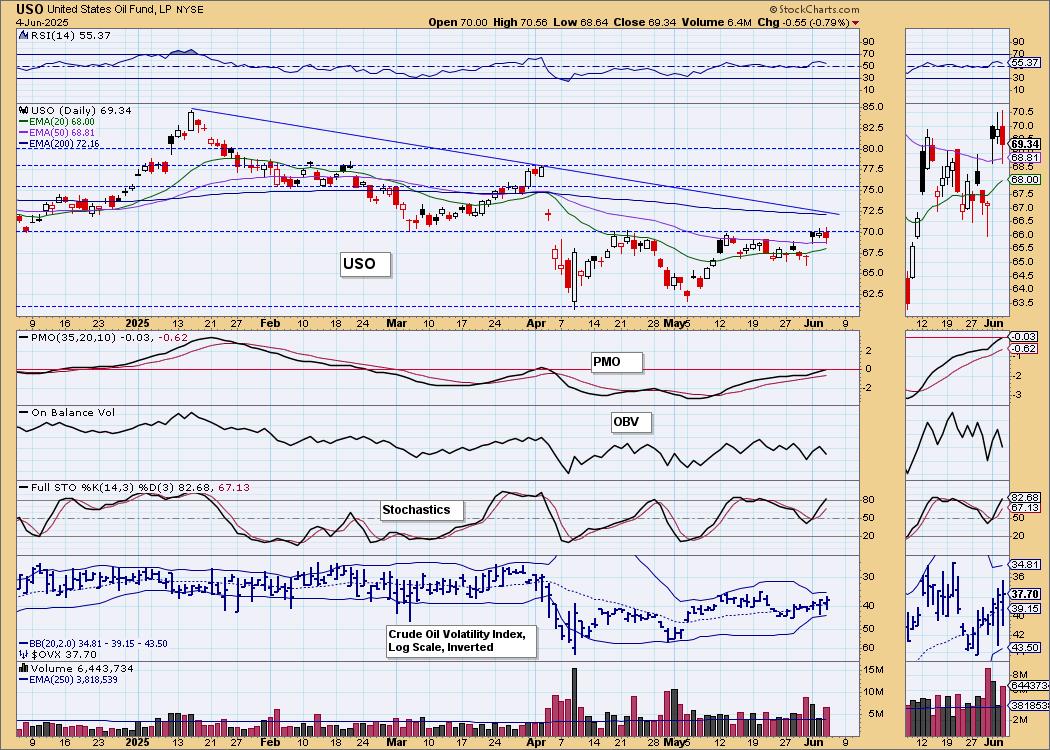
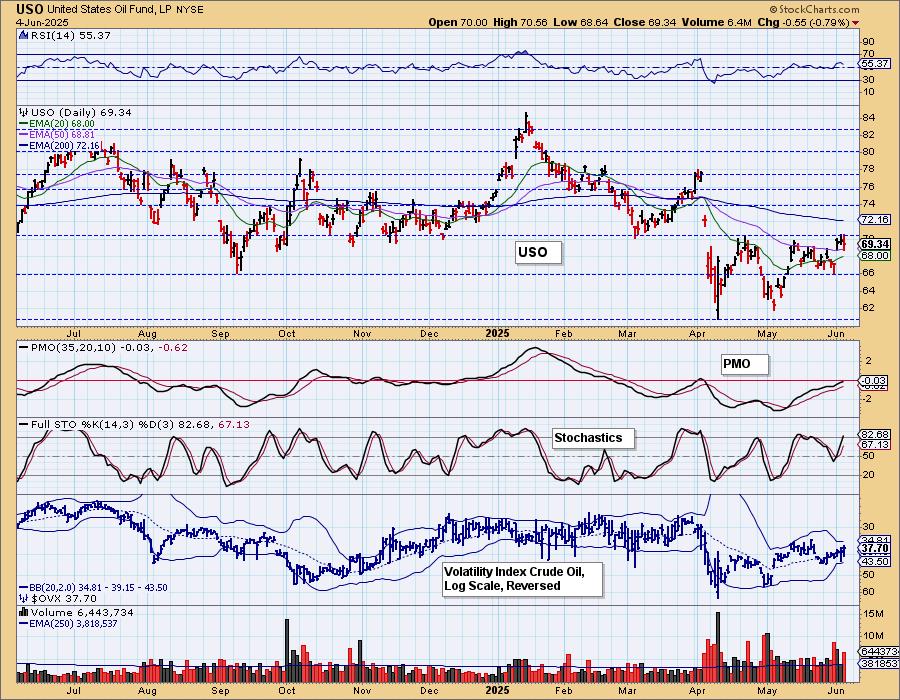
IT Trend Model: NEUTRAL as of 2/27/2025
LT Trend Model: SELL as of 3/18/2025
USO Daily Chart: Crude couldn't press past resistance again. Considering we have had a rising PMO for so long, we should've seen a breakout by now. Stochastics have even climbed above 80. The indicators do seem to suggest a breakout ahead, but with the administration working hard to keep prices low, it could fail here.
Good Luck & Good Trading!
Erin Swenlin and Carl Swenlin
Technical Analysis is a windsock, not a crystal ball. --Carl Swenlin
(c) Copyright 2025 DecisionPoint.com
Disclaimer: This blog is for educational purposes only and should not be construed as financial advice. The ideas and strategies should never be used without first assessing your own personal and financial situation, or without consulting a financial professional. Any opinions expressed herein are solely those of the author, and do not in any way represent the views or opinions of any other person or entity.
DecisionPoint is not a registered investment advisor. Investment and trading decisions are solely your responsibility. DecisionPoint newsletters, blogs or website materials should NOT be interpreted as a recommendation or solicitation to buy or sell any security or to take any specific action.
NOTE: The signal status reported herein is based upon mechanical trading model signals, specifically, the DecisionPoint Trend Model. They define the implied bias of the price index based upon moving average relationships, but they do not necessarily call for a specific action. They are information flags that should prompt chart review. Further, they do not call for continuous buying or selling during the life of the signal. For example, a BUY signal will probably (but not necessarily) return the best results if action is taken soon after the signal is generated. Additional opportunities for buying may be found as price zigzags higher, but the trader must look for optimum entry points. Conversely, exit points to preserve gains (or minimize losses) may be evident before the model mechanically closes the signal.
Helpful DecisionPoint Links:
DecisionPoint Alert Chart List
DecisionPoint Golden Cross/Silver Cross Index Chart List
DecisionPoint Sector Chart List
Price Momentum Oscillator (PMO)