
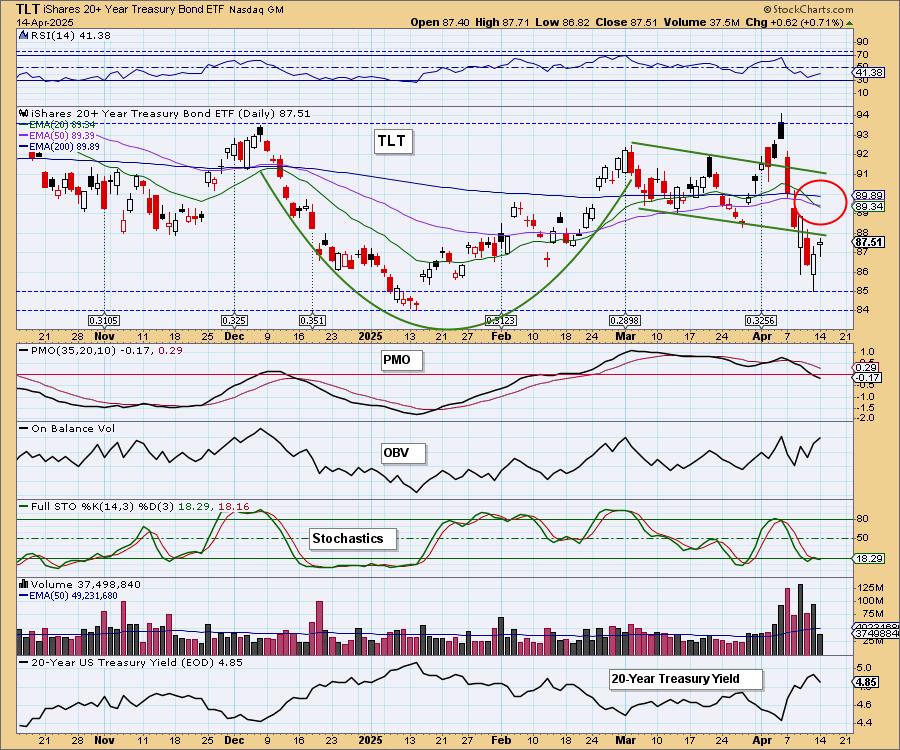
Today the 20+ Year Treasury Bond ETF (TLT) 20-day EMA crossed down through the 50-day EMA below the 200-day EMA (Death Cross), generating an IT Trend Model SELL Signal. We'll discuss it further in the Bonds Section below.
The DecisionPoint Alert Weekly Wrap presents an end-of-week assessment of the trend and condition of the Stock Market, the U.S. Dollar, Gold, Crude Oil, and Bonds. The DecisionPoint Alert daily report (Monday through Thursday) is abbreviated and gives updates on the Weekly Wrap assessments.
MARKET/INDUSTRY GROUP/SECTOR INDEXES
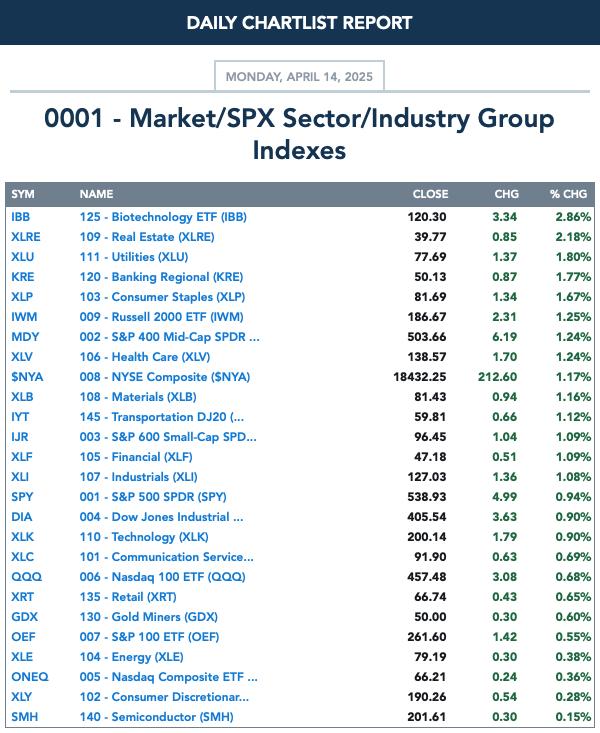
CLICK HERE for Carl's annotated Market Index, Sector, and Industry Group charts.
THE MARKET (S&P 500)
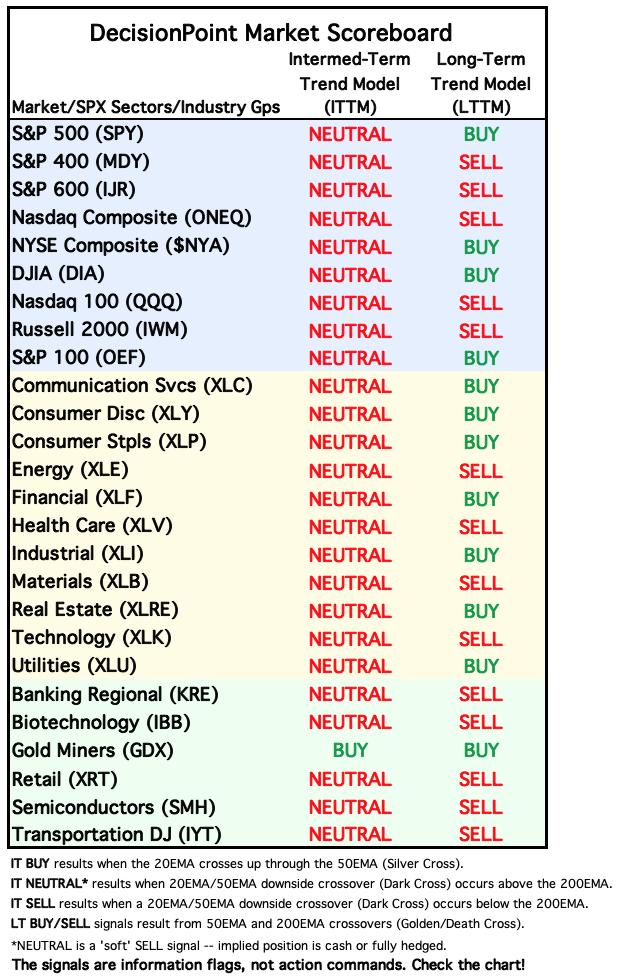
IT Trend Model: NEUTRAL as of 3/4/2025
LT Trend Model: BUY as of 3/29/2023
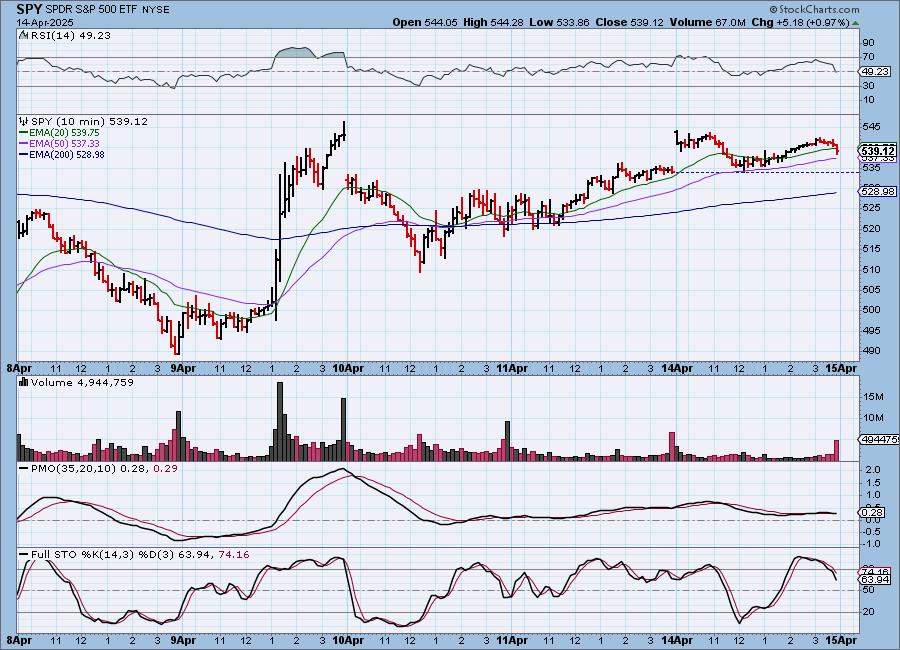
SPY 10-Minute Chart: We saw a nice rally today, but now price has formed a bearish double top. The 10-minute PMO has also dropped beneath its signal line. Stochastics are tumbling lower.
SPY Daily Chart: While we had a nice rally, the market formed a bearish filled black candlestick. Price closed higher, but closed beneath the open. Price is nearing the declining tops trendline and that could form resistance along with resistance at the March low. The PMO is still making its way higher but remains well below the zero line.
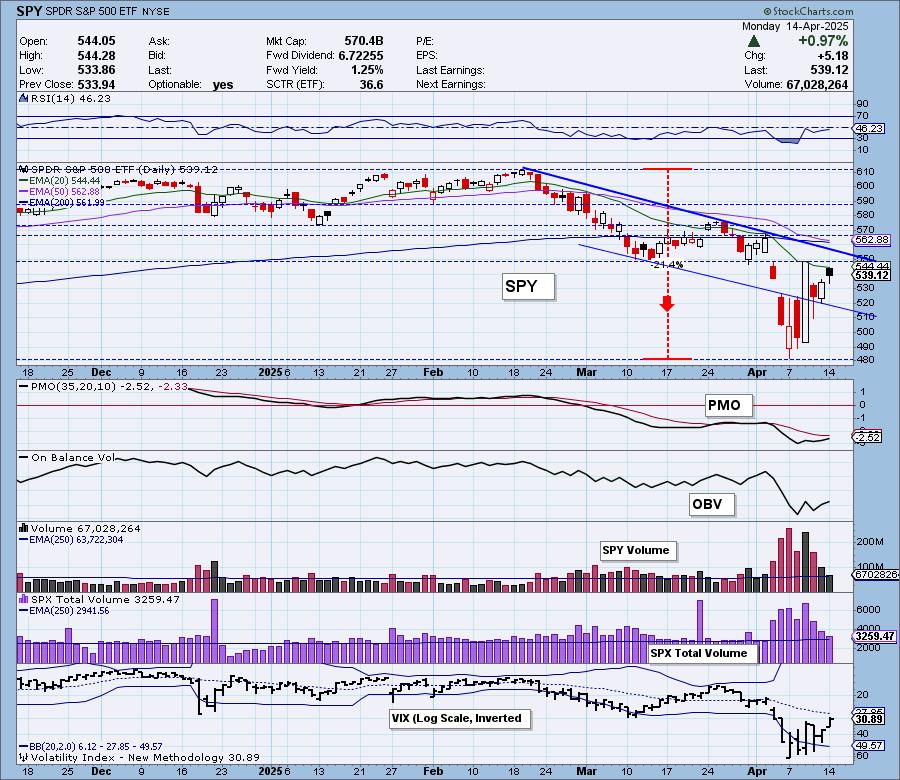
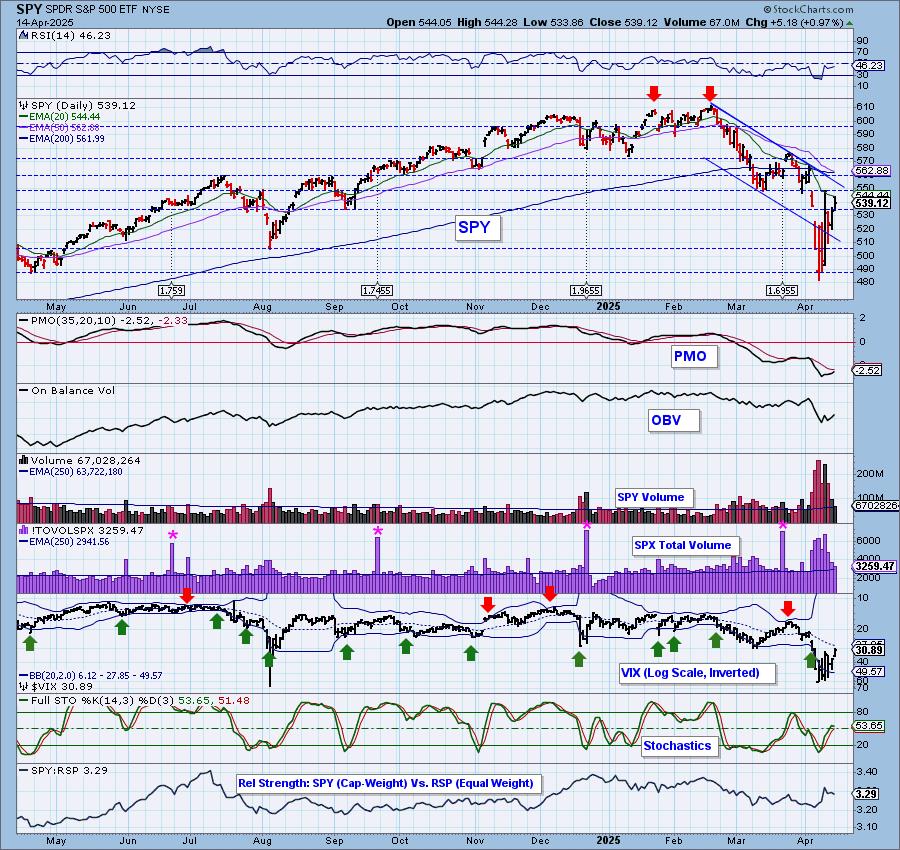
The VIX is easing, but remains below its moving average so there is still weakness visible. Stochastics are already trying to top. Notice that mega-caps are losing sway as the SPY relative strength line to equal-weight RSP is beginning to drop again. That is not a good condition for the market.
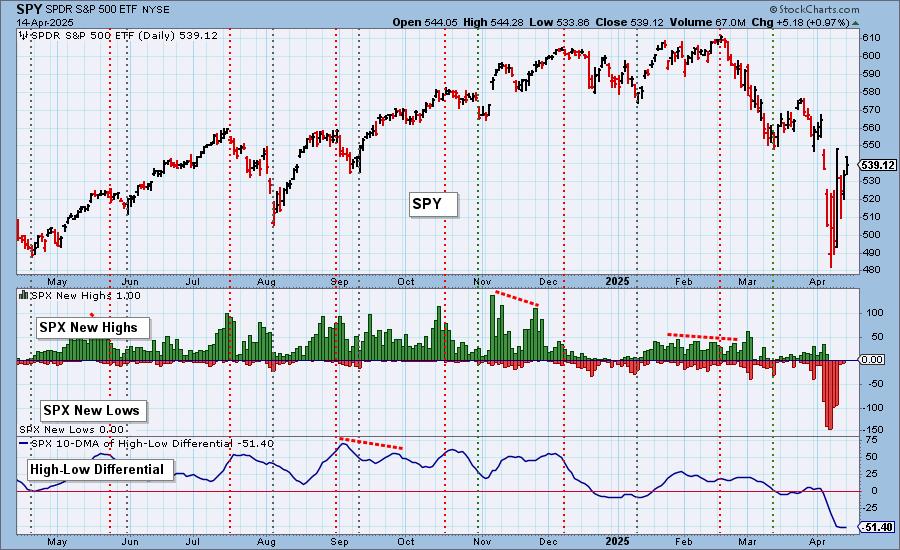
S&P 500 New 52-Week Highs/Lows: Repair work is being done as we didn't see any New Lows today. However, we didn't get a huge vote of confidence from New Highs as we only saw one. The High-Low Differential is attempting to bottom but for now is still inching lower.
Climax* Analysis: There were unanimous climax readings on the four relevant indicators, giving us an upside exhaustion climax. The rally is potentially done.
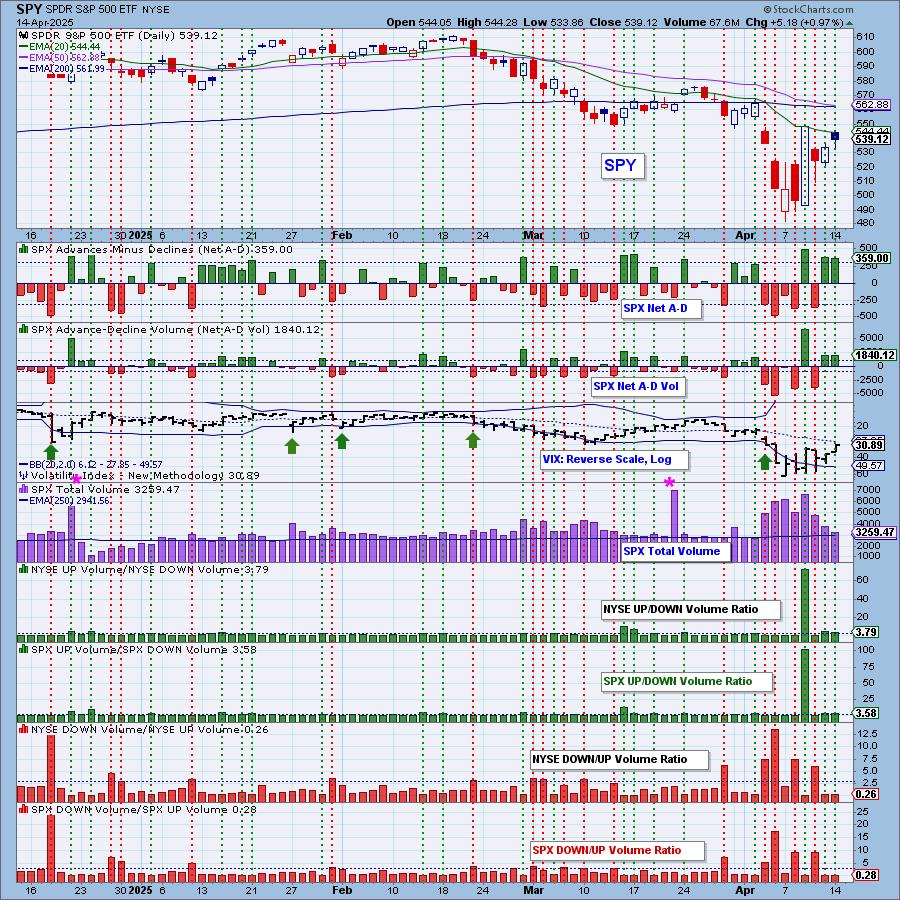
*A climax is a one-day event when market action generates very high readings in, primarily, breadth and volume indicators. We also include the VIX, watching for it to penetrate outside the Bollinger Band envelope. The vertical dotted lines mark climax days -- red for downside climaxes, and green for upside. Climaxes are at their core exhaustion events; however, at price pivots they may be initiating a change of trend.
Short-Term Market Indicators: The short-term market trend is DOWN and the condition is NEUTRAL.
Both Swenlin Trading Oscillators (STOs) are rising. They rose quite a bit on today's rally, pushing the STO-B back into positive territory. Participation and %PMOs Rising saw very good gains today, with now 75% holding rising momentum.
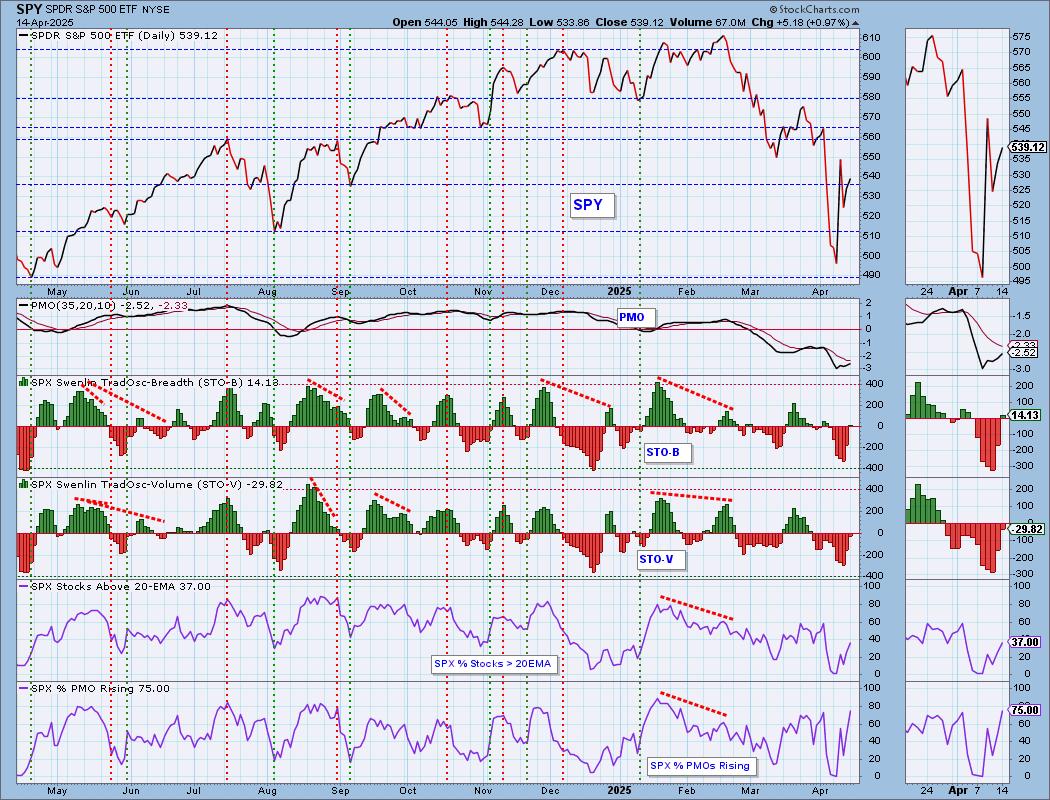
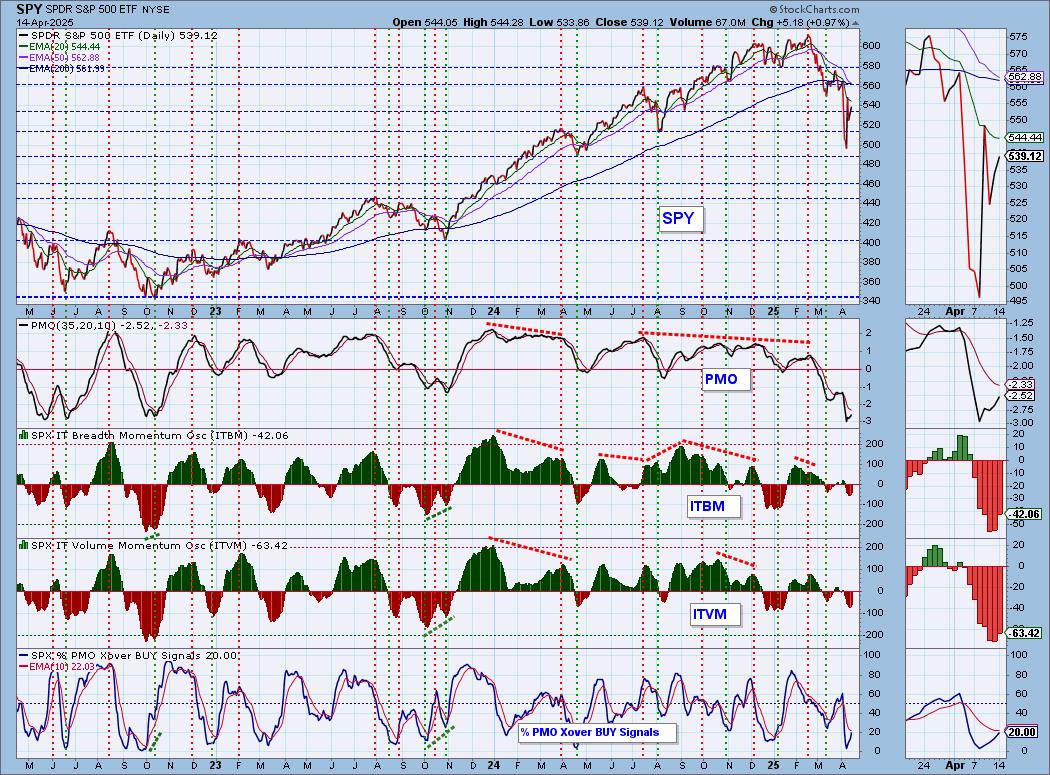
Intermediate-Term Market Indicators: The intermediate-term market trend is DOWN and the condition is NEUTRAL.
Both the ITBM and ITVM rose on the day which is positive and we did see the addition of more PMO BUY Signals. Not a bad chart.
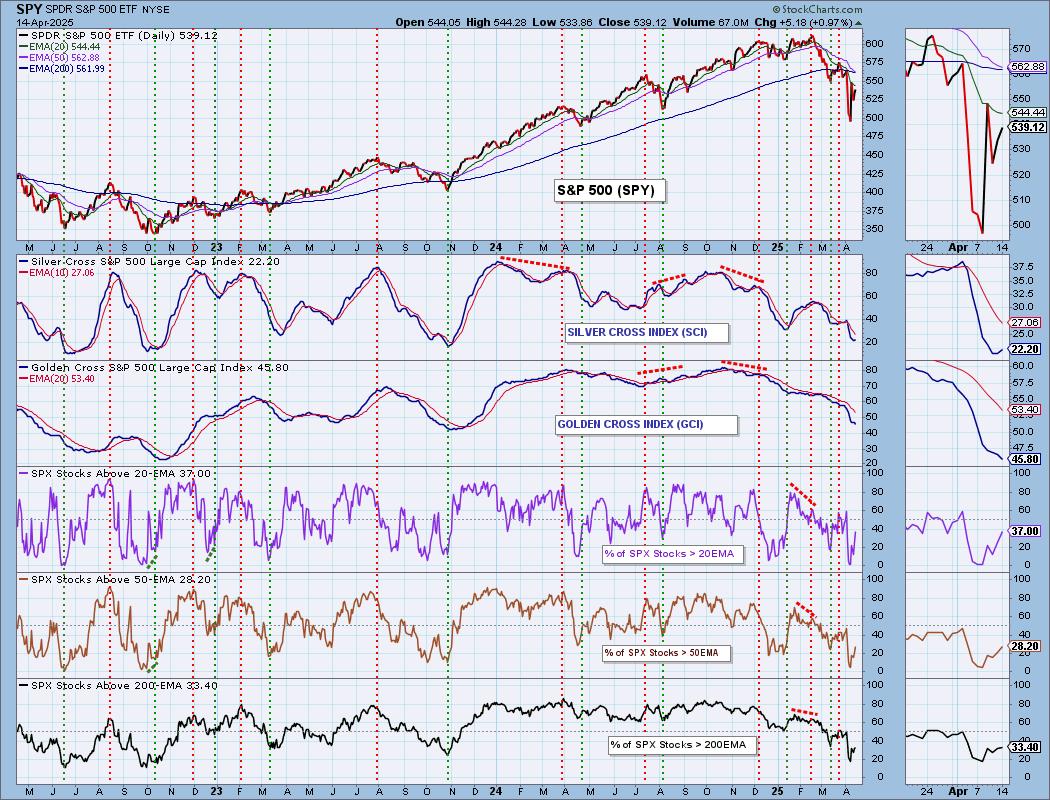
PARTICIPATION CHART (S&P 500): The following chart objectively shows the depth and trend of participation for the SPX in two time frames.
- Intermediate-Term - the Silver Cross Index (SCI) shows the percentage of SPX stocks on IT Trend Model BUY signals (20-EMA > 50-EMA). The opposite of the Silver Cross is a "Dark Cross" -- those stocks are, at the very least, in a correction.
- Long-Term - the Golden Cross Index (GCI) shows the percentage of SPX stocks on LT Trend Model BUY signals (50-EMA > 200-EMA). The opposite of a Golden Cross is the "Death Cross" -- those stocks are in a bear market.
The market bias is BEARISH in the intermediate and long terms.
Participation is slowly healing, but readings are still well below our bullish 50% threshold so we don't want to read too much into this. The Silver Cross Index did turn up today and given we have more stocks above the 20/50-day EMAs versus Silver Crosses, we should see it continue to rise from here. The Silver Cross Index and Golden Cross Index are below their signal lines, so the IT and LT Biases are BEARISH.
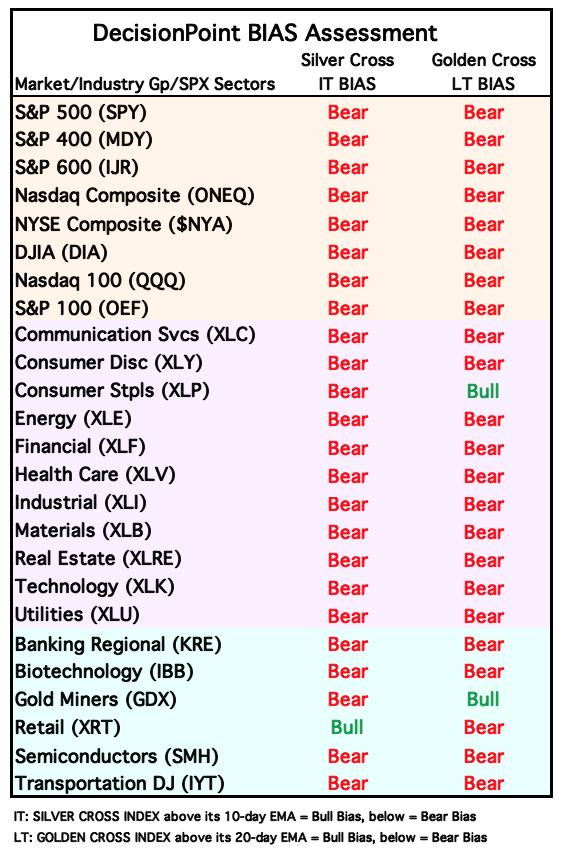
BIAS Assessment: The following table expresses the current BIAS of various price indexes based upon the relationship of the Silver Cross Index to its 10-day EMA (intermediate-term), and of the Golden Cross Index to its 20-day EMA (long-term). When the Index is above the EMA it is bullish, and it is bearish when the Index is below the EMA. The BIAS does not imply that any particular action should be taken. It is information to be used in the decision process.
The items with highlighted borders indicate that the BIAS changed today.
*****************************************************************************************************
CONCLUSION: The very short-term picture is quite bearish. We have a double top on the 10-minute bar chart, a filled black candlestick and an upside exhaustion climax. We should expect lower prices over the next day or two. Past that the indicators don't look that bad. Participation is improving and the Silver Cross Index turned back up. It appears that we should expect another leg downward with a distinct possibility that we could get another bear market rally. Market volatility did ease today but this may not be over as uncertainty over tariffs remains. The market is likely to continue being news driven.
Erin is 10% long, 0% short. (This is intended as information, not a recommendation.)
*****************************************************************************************************
CALENDAR

BITCOIN
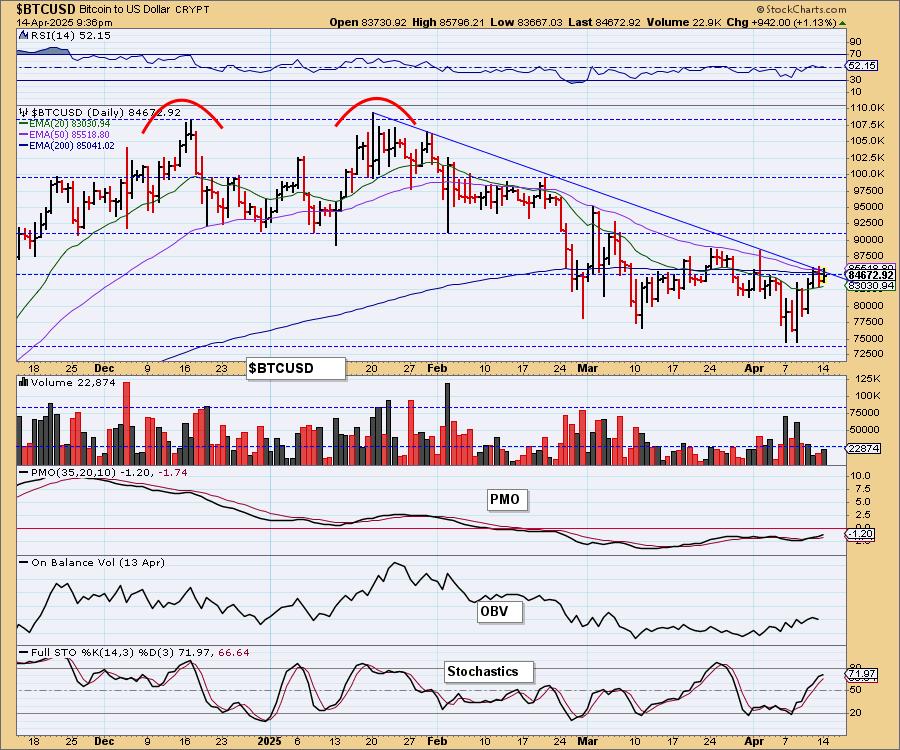
The declining tops trendline is beginning to see a test. The indicators are configured positively enough to support a rally here. The RSI is in positive territory above net neutral (50) and the PMO is rising on a Crossover BUY Signal. Stochastics have also shown plenty of improvement. We must say that this declining tops trendline has held for quite some time so we wouldn't be surprised at all if it turned down here.
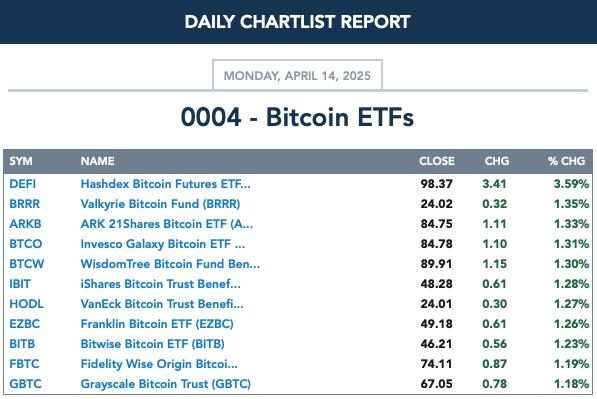
BITCOIN ETFs
INTEREST RATES
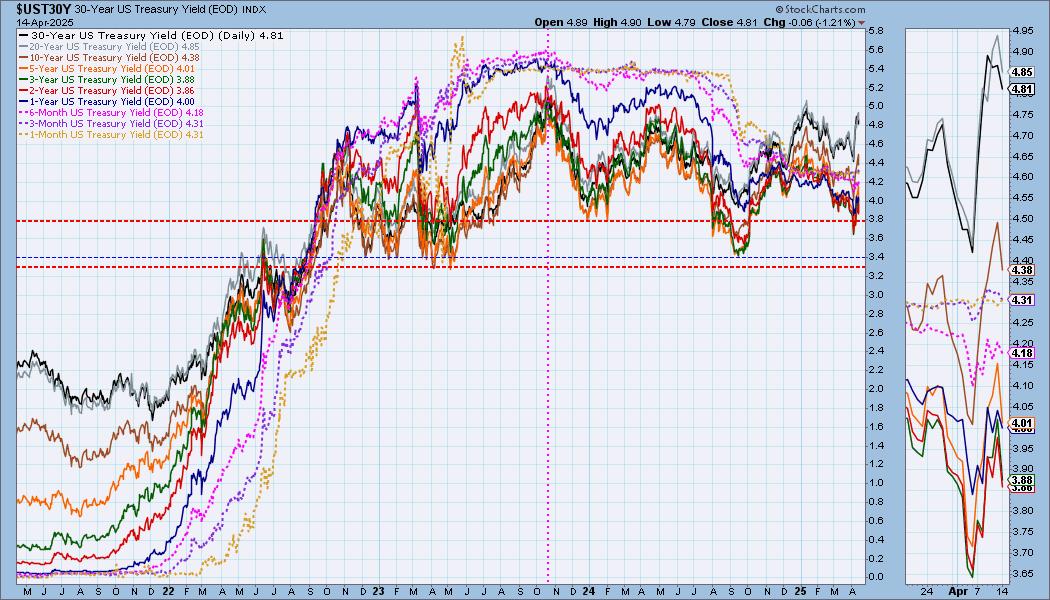
Yields back off today, but ultimately have nearly all broken declining trends so for now we would look for them to move higher.
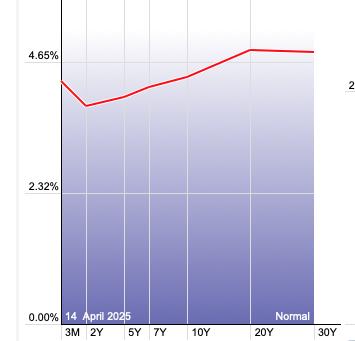
The Yield Curve Chart from StockCharts.com shows us the inversions taking place. The red line should move higher from left to right. Inversions are occurring where it moves downward.
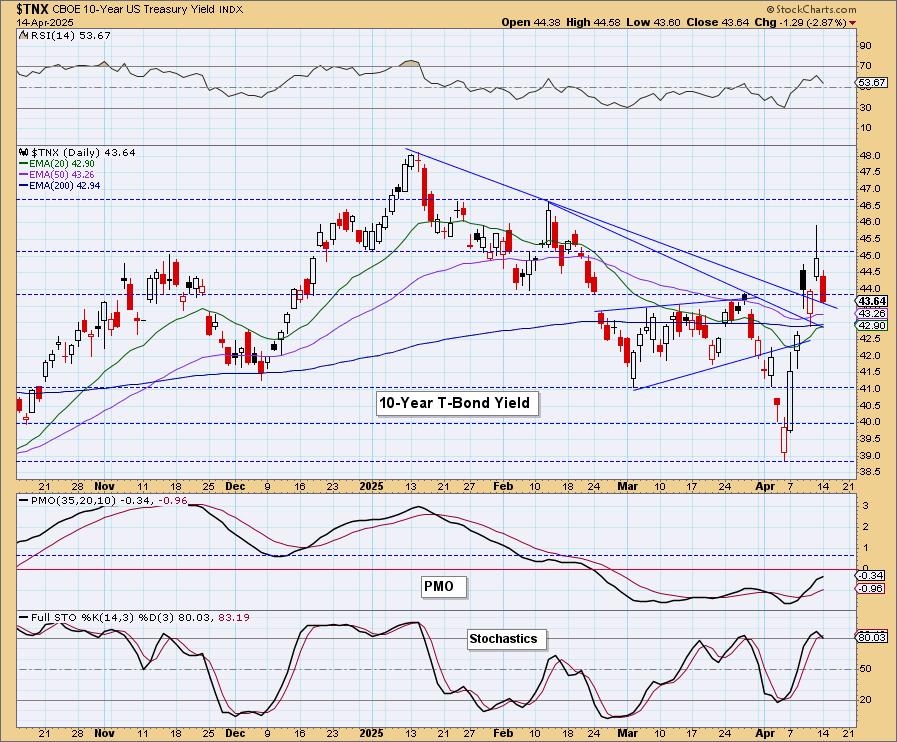
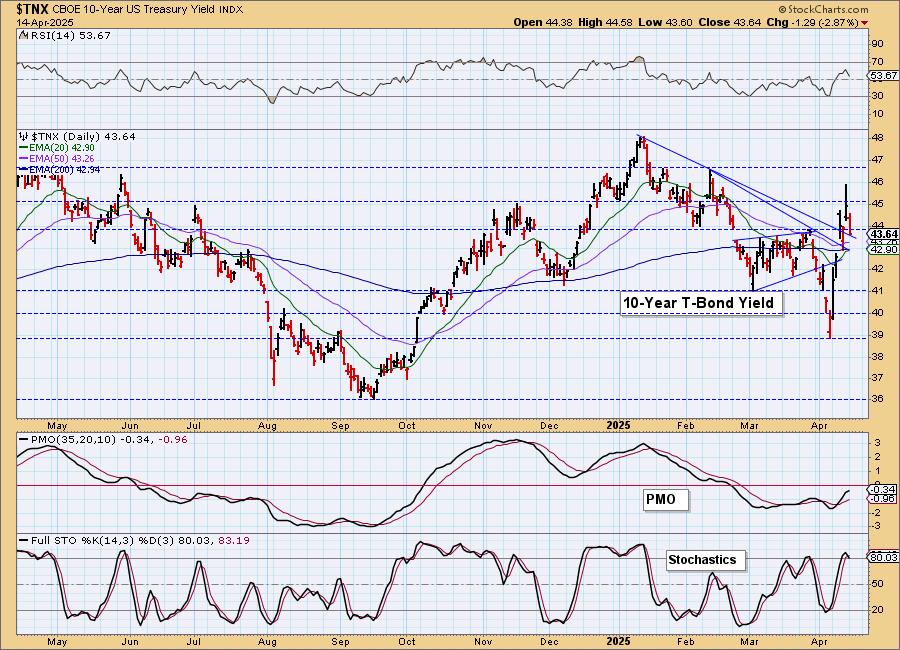
10-YEAR T-BOND YIELD
$TNX dropped back down to test the declining tops trendline. It did manage to hold above it. The indicators are seeing a little damage, but overall are mostly positive. The RSI is positive still and the PMO is rising on a Crossover BUY Signal. Stochastics did top but so far remain above 80 which indicates strength. We're looking for a rebound.
BONDS (TLT)
IT Trend Model: SELL as of 4/14/2025
LT Trend Model: SELL as of 12/13/2024
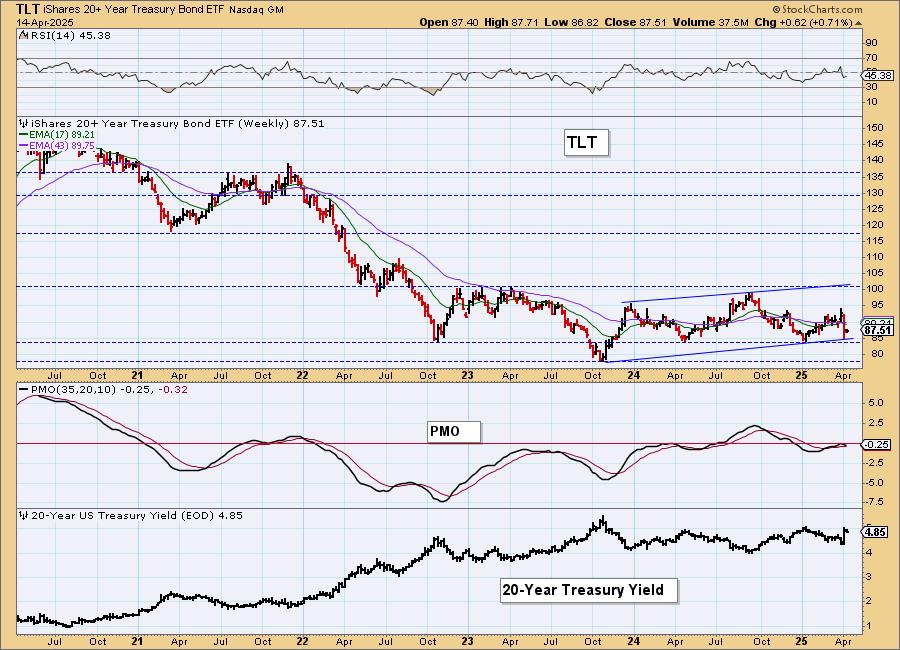
TLT Daily Chart: Today the 20+ Year Treasury Bond ETF (TLT) 20-day EMA crossed down through the 50-day EMA below the 200-day EMA (Death Cross), generating an IT Trend Model SELL Signal. Bonds have managed to rebound off a strong support zone, but ultimately the indicators are not working in their favor and suggest this rally is very temporary. The PMO has dropped below the zero line and Stochastics topped and are below 20. We expect the decline will resume soon.
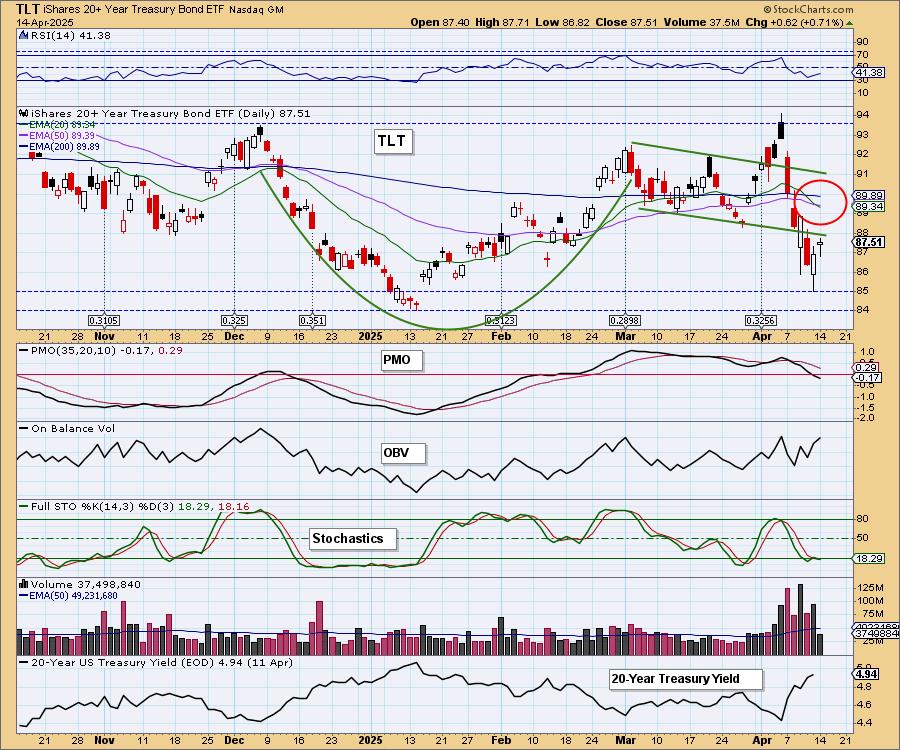
Price hasn't quite hit strong support at the 2025 low. We are looking for price to eventually move down to that level.
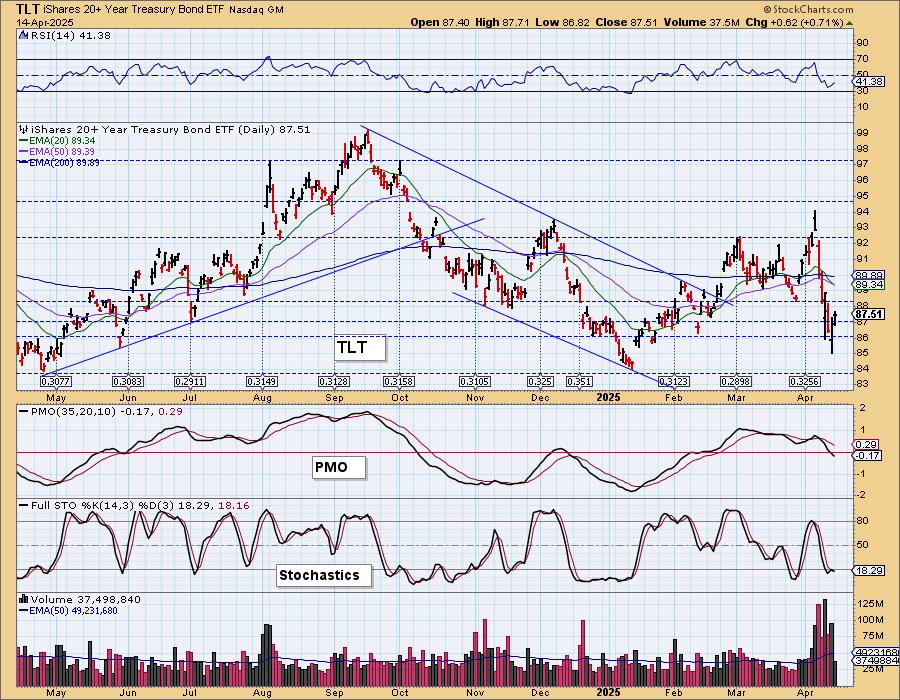
TLT Weekly Chart: We see a rising trend channel on the weekly chart and price is currently bouncing off that level so we can't rule out an upside reversal.
DOLLAR (UUP)
IT Trend Model: NEUTRAL as of 3/5/2025
LT Trend Model: BUY as of 5/25/2023
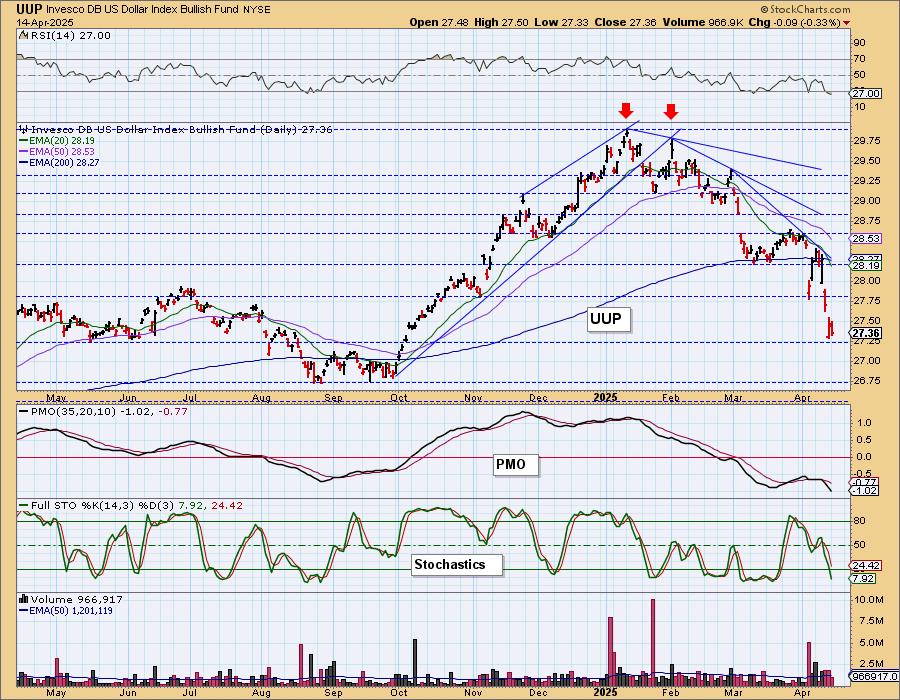
UUP Daily Chart: The Dollar continues its decline having formed a steeper declining tops trendline. The RSI is oversold so we could see a small rally soon, but the PMO looks highly negative as it fall well below the zero line. Stochastics also look terrible as they move lower and are now below 20. We could see a small bounce here, but ultimately the Dollar is still flashing weakness.
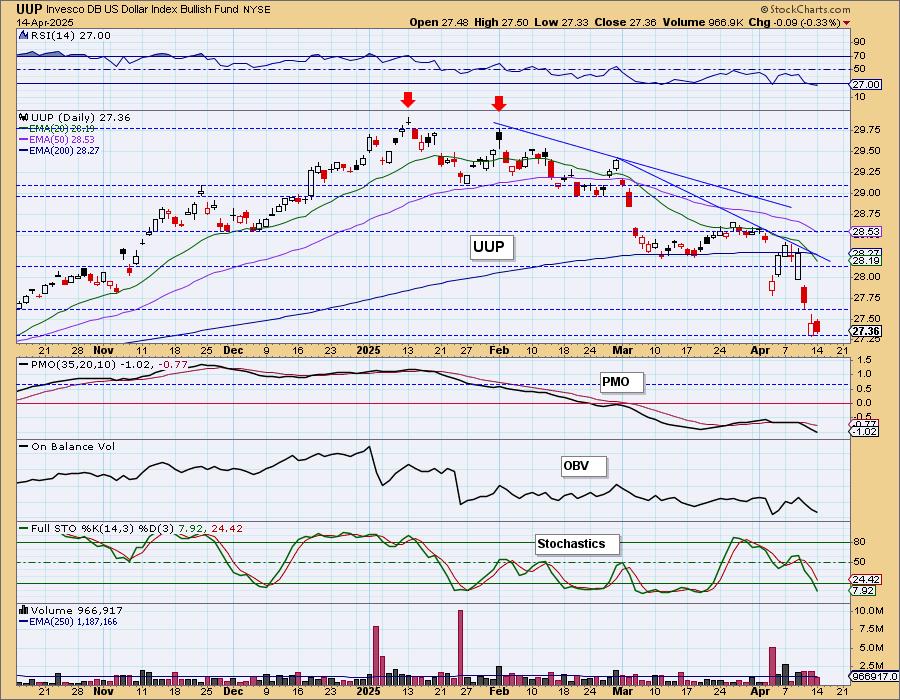
The next level of support that we are watching is 26.75.
GOLD
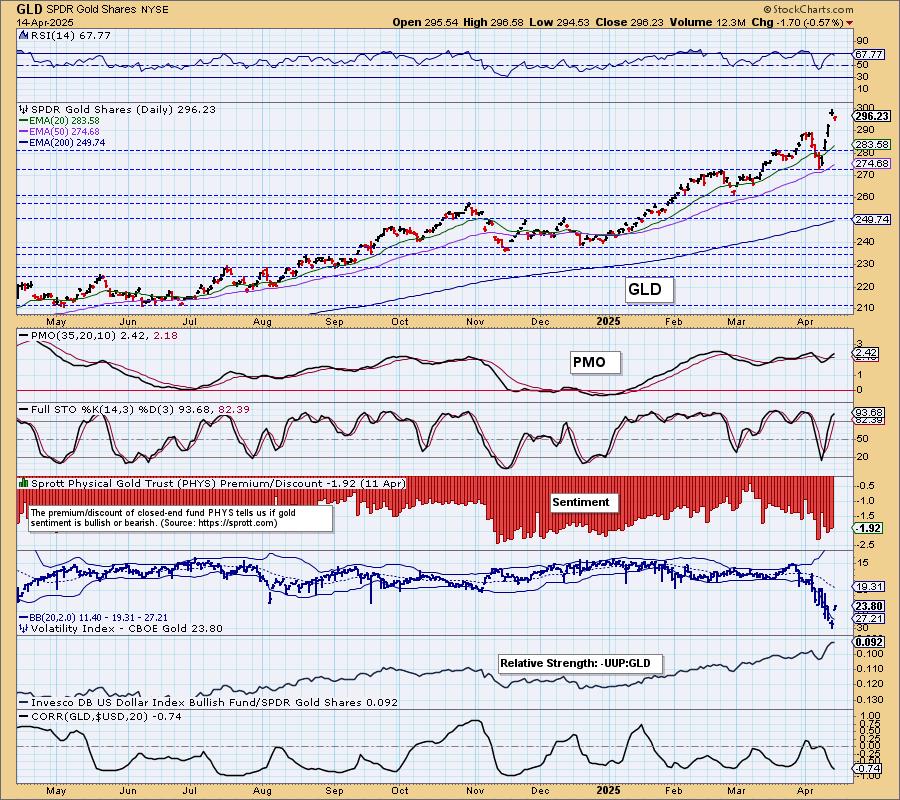
IT Trend Model: BUY as of 1/10/2025
LT Trend Model: BUY as of 10/20/2023
GLD Daily Chart: Gold pulled back slightly today which was good as it has now taken the RSI out of overbought territory. It is due for a pause having rallied so strongly last week. The PMO and Stochastics are still quite bullish, but we think Gold is due for a bit more decline or consolidation before it makes all-time highs again. However, it has been incredibly strong so we wouldn't be surprised if it reverses higher quickly especially if we see a heavy market decline.
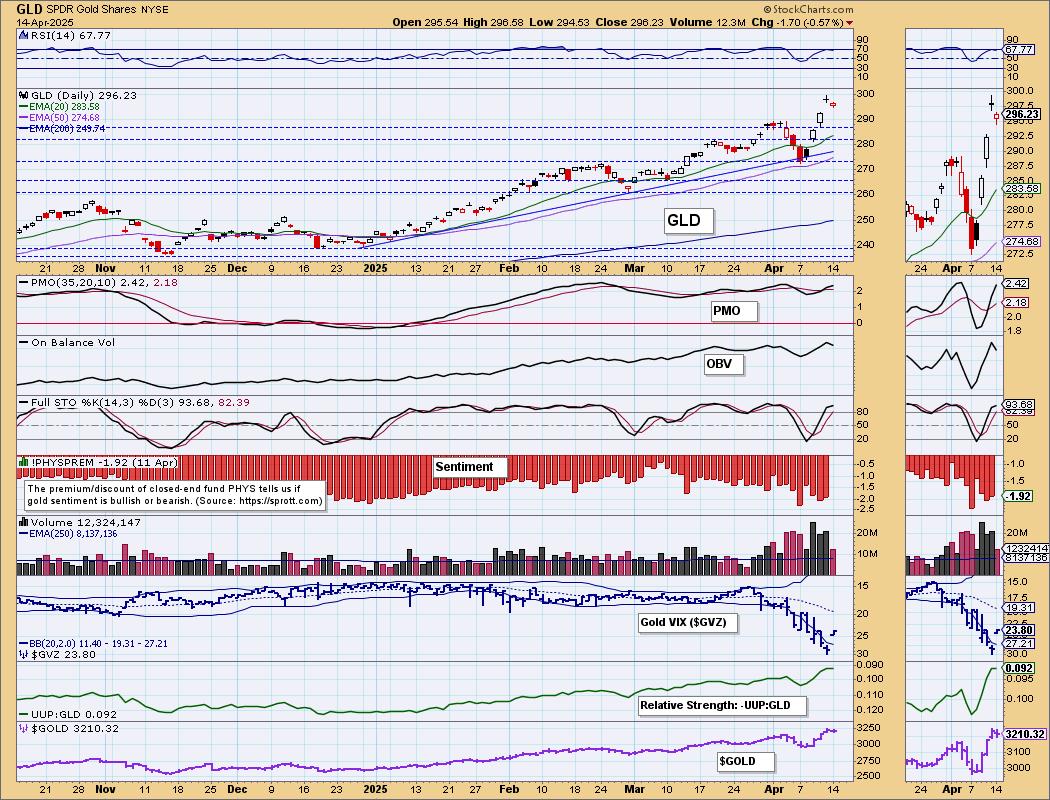
The Gold Volatility Index ($GVZ) did rise on our inverted scale. It is below its moving average and that does imply weakness.
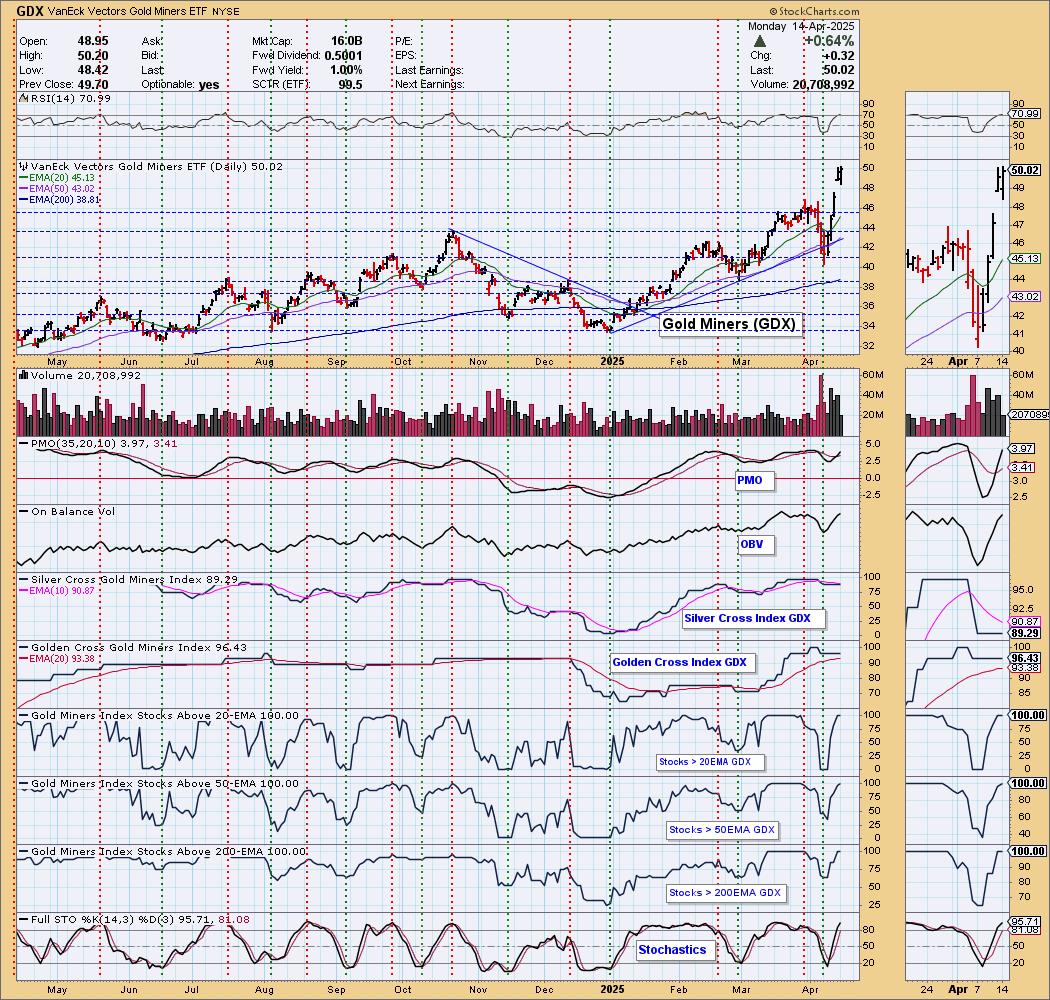
GOLD MINERS (GDX) Daily Chart: Gold was down but Gold Miners managed a rally anyway as more buyers find their way toward this strong industry group. Participation is at 100% across the board with the Silver Cross Index and Golden Cross Index near the top of their range. The RSI is overbought again so we could see a small pullback alongside Gold, but ultimately it is hard to argue with such strong technicals.
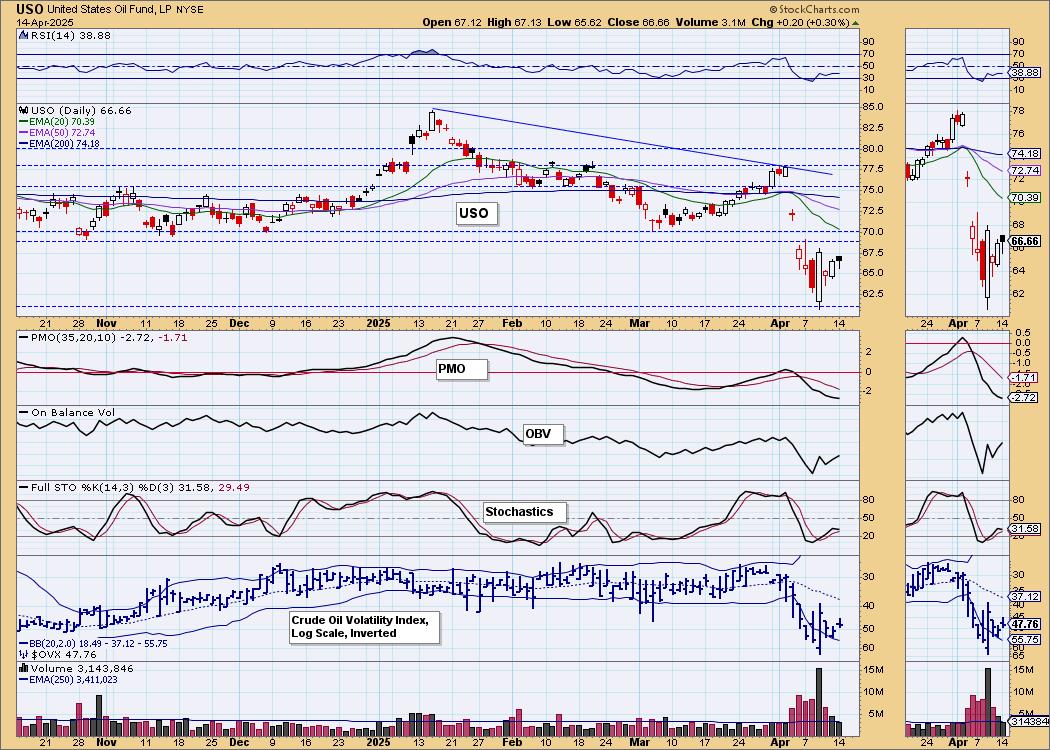
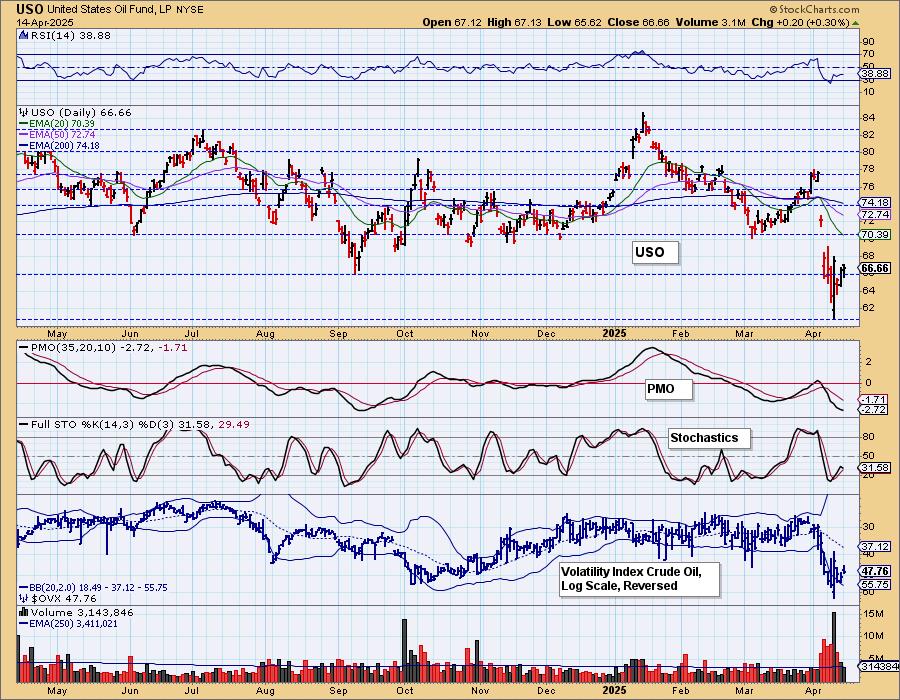
CRUDE OIL (USO)
IT Trend Model: NEUTRAL as of 2/27/2025
LT Trend Model: SELL as of 3/18/2025
USO Daily Chart: Crude Oil is making a comeback, but we expect it to stall at overhead resistance as production is going to be increased within the U.S. very soon (if not already). The PMO is still in decline and the RSI is negative so the technicals are still swaying bearish. Stochastics have also topped in negative territory.
Good Luck & Good Trading!
Erin Swenlin and Carl Swenlin
Technical Analysis is a windsock, not a crystal ball. --Carl Swenlin
(c) Copyright 2025 DecisionPoint.com
Disclaimer: This blog is for educational purposes only and should not be construed as financial advice. The ideas and strategies should never be used without first assessing your own personal and financial situation, or without consulting a financial professional. Any opinions expressed herein are solely those of the author, and do not in any way represent the views or opinions of any other person or entity.
DecisionPoint is not a registered investment advisor. Investment and trading decisions are solely your responsibility. DecisionPoint newsletters, blogs or website materials should NOT be interpreted as a recommendation or solicitation to buy or sell any security or to take any specific action.
NOTE: The signal status reported herein is based upon mechanical trading model signals, specifically, the DecisionPoint Trend Model. They define the implied bias of the price index based upon moving average relationships, but they do not necessarily call for a specific action. They are information flags that should prompt chart review. Further, they do not call for continuous buying or selling during the life of the signal. For example, a BUY signal will probably (but not necessarily) return the best results if action is taken soon after the signal is generated. Additional opportunities for buying may be found as price zigzags higher, but the trader must look for optimum entry points. Conversely, exit points to preserve gains (or minimize losses) may be evident before the model mechanically closes the signal.
Helpful DecisionPoint Links:
DecisionPoint Alert Chart List
DecisionPoint Golden Cross/Silver Cross Index Chart List
DecisionPoint Sector Chart List
Price Momentum Oscillator (PMO)