
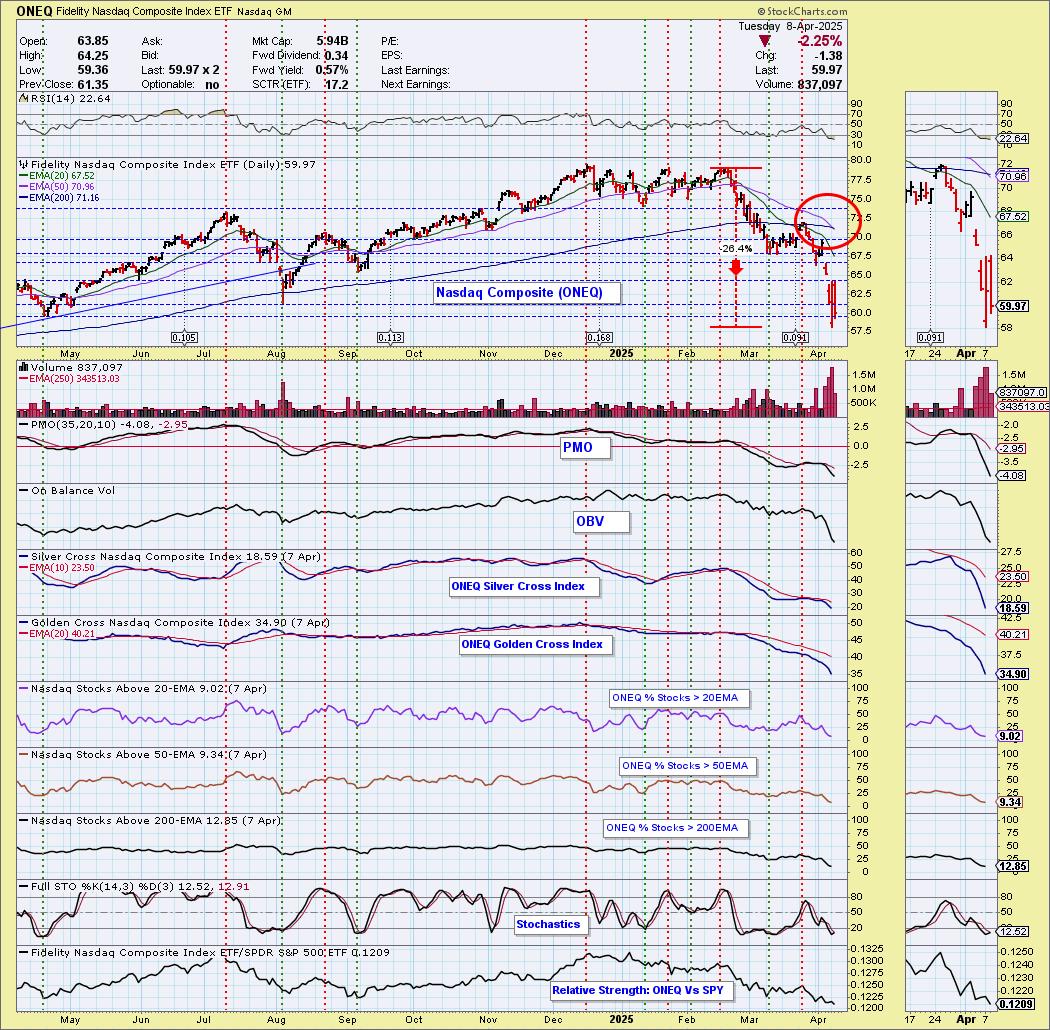
Today the Nasdaq Composite ETF (ONEQ) 50-day EMA crossed down through the 200-day EMA (Death Cross), generating an IT Trend Model SELL Signal. Support was violated but ultimately it did close above it. The decline has been overdone, but we don't think it is through falling yet. Probably will see a snapback of some sort. Participation is oversold and we do see that Stochastics tipped upward. We wouldn't count on the bear market being done, but certainly it is due for some kind of snapback.
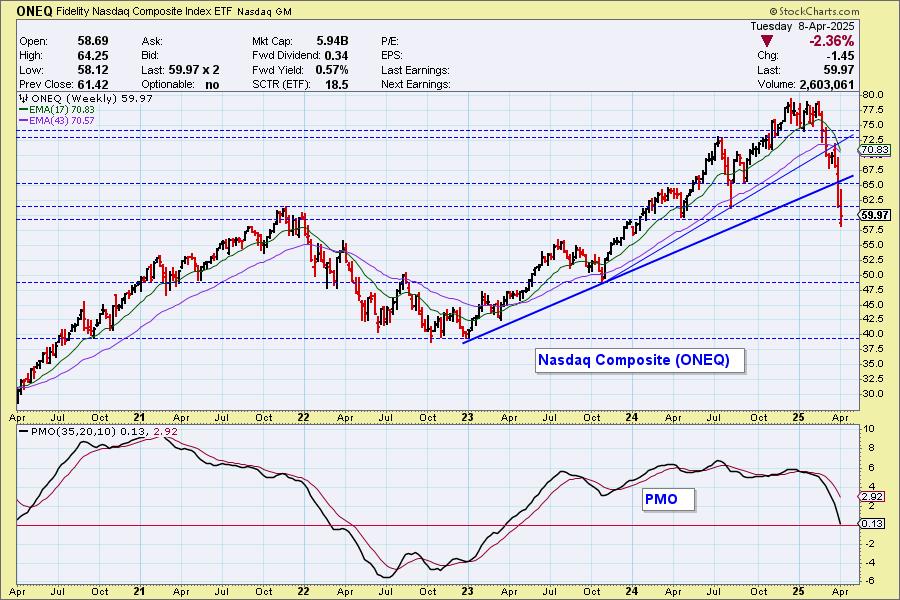
The long-term rising trend has been violated and we can see that this is an important support zone. However, given the very negative weekly PMO we don't see this as being done yet.
__________
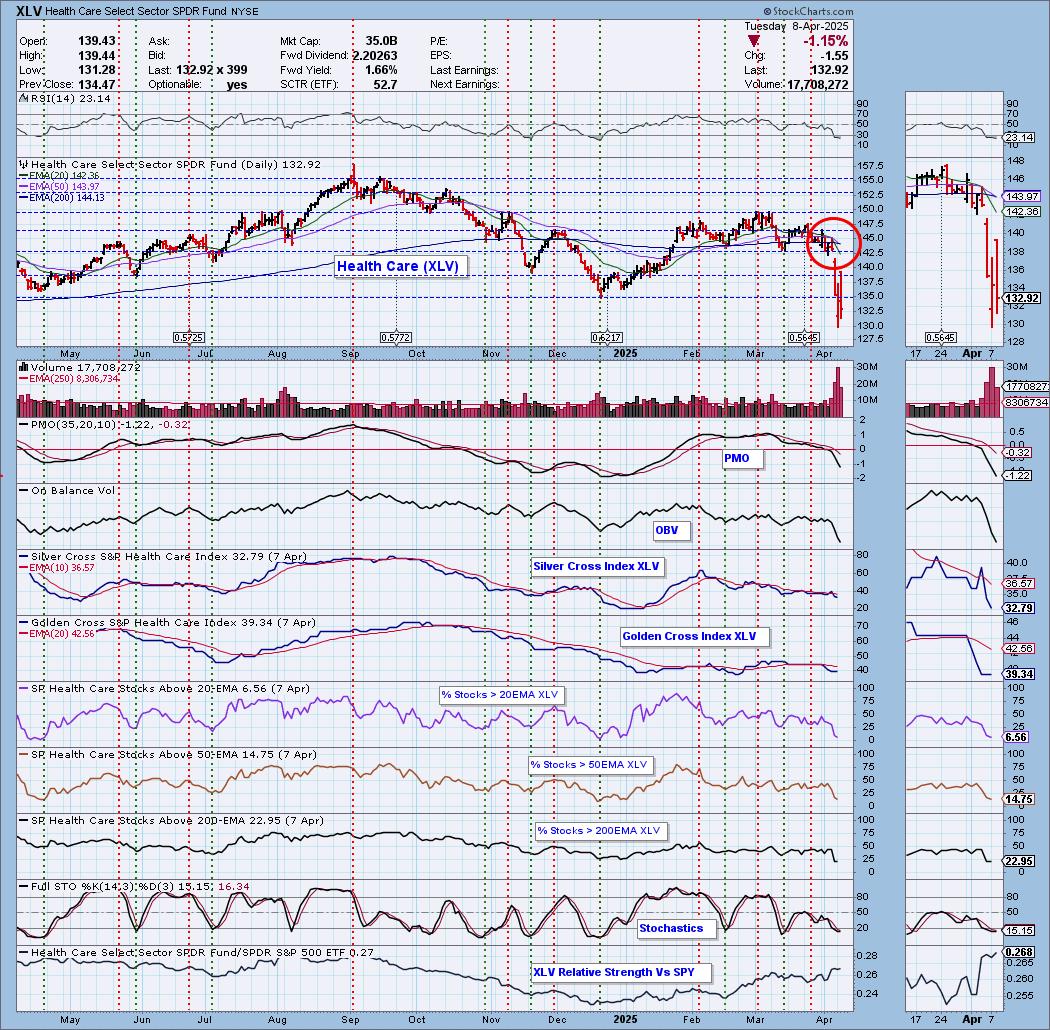
Also today, the Health Care ETF (XLV) 50-day EMA crossed down through the 200-day EMA (Death Cross), generating an IT Trend Model SELL Signal. XLV lost strong support and now none is visible on the daily chart. Participation is oversold, but could certainly see lower numbers. Stochastics are still falling so this decline doesn't look finished yet.
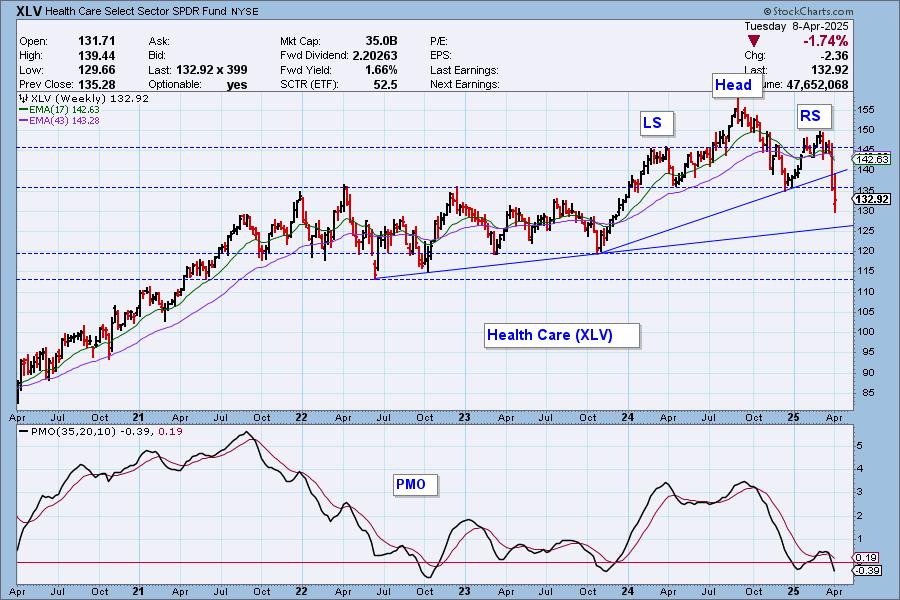
We have a clear bearish head and shoulders pattern on the weekly chart and it has been confirmed with the drop below the neckline of the pattern. There is rising bottoms support arriving soon so maybe we'll see a bounce near that area. The weekly PMO is very negative so we doubt this decline is finished.
__________
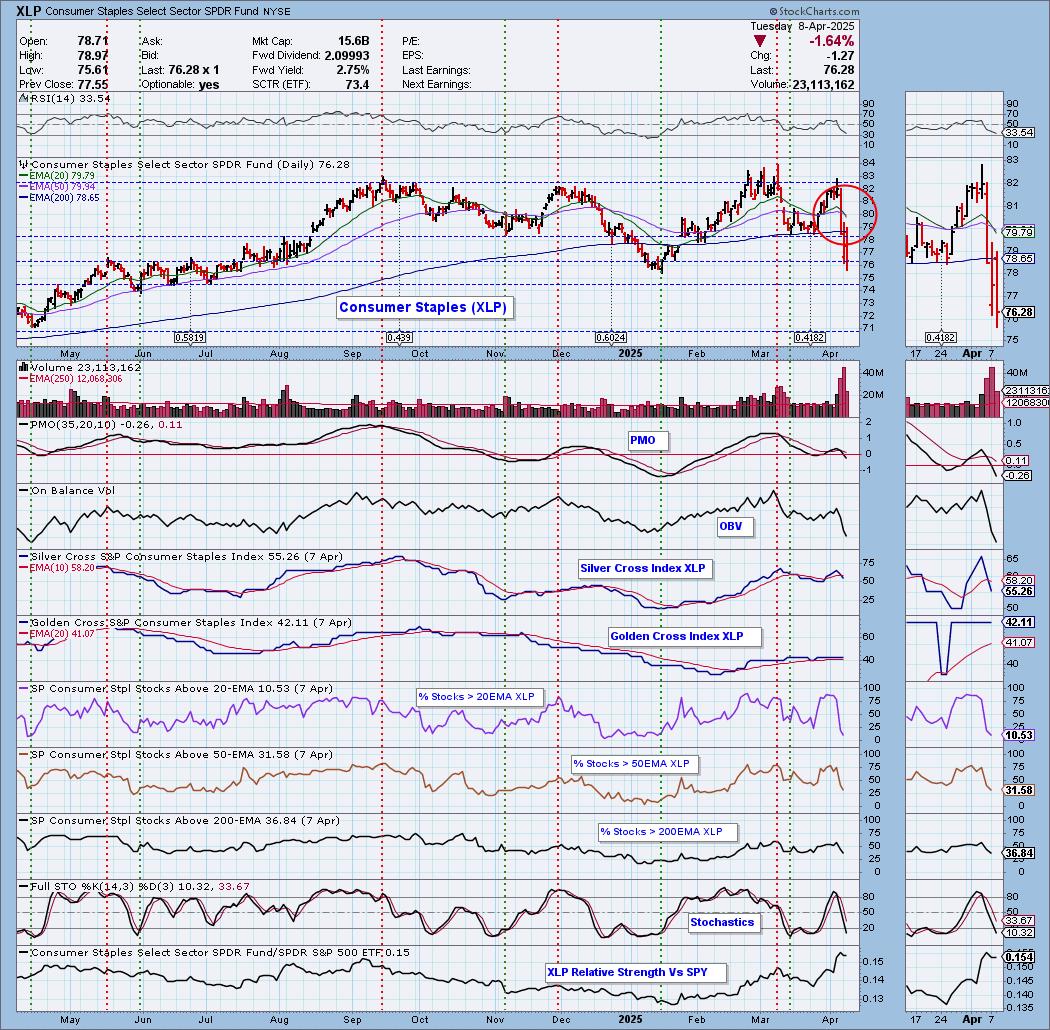
Finally, the Consumer Staples ETF (XLP) 20-day EMA crossed down through the 50-day EMA (Dark Cross) above the 200-day EMA, generating an IT Trend Model NEUTRAL Signal. XLP is the only sector that hasn't lost near-term support. It is certainly on its way. We could say that there is a double top on the right side of the chart and that implies we'll see price drop further from here. Participation is slim, but could still move downward from here. Stochastics look very negative and the Silver Cross Index just dropped below its signal line giving XLP a bearish IT Bias. There is likely more downside to absorb.
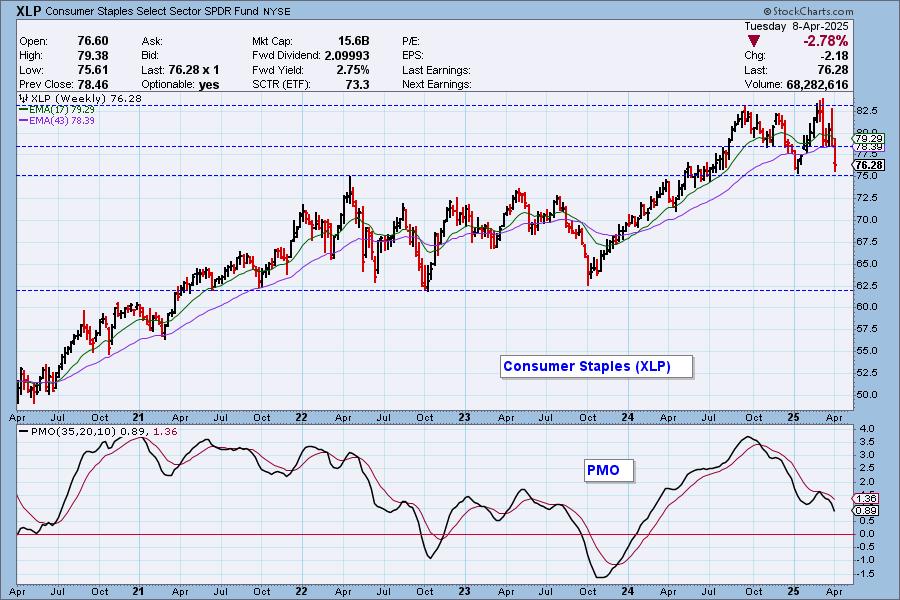
We can see a somewhat messy bearish double top on the weekly chart. It is sitting on very important support right now so this is where we need to see a reversal. The problem is the very negative PMO which does seem to imply this support level will be broken.
The DecisionPoint Alert Weekly Wrap presents an end-of-week assessment of the trend and condition of the Stock Market, the U.S. Dollar, Gold, Crude Oil, and Bonds. The DecisionPoint Alert daily report (Monday through Thursday) is abbreviated and gives updates on the Weekly Wrap assessments.
MARKET/INDUSTRY GROUP/SECTOR INDEXES
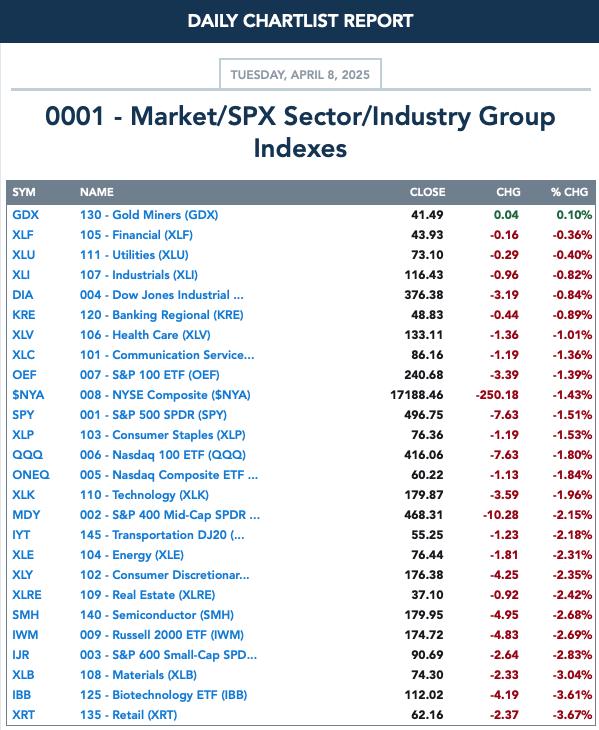
CLICK HERE for Carl's annotated Market Index, Sector, and Industry Group charts.
THE MARKET (S&P 500)
IT Trend Model: NEUTRAL as of 3/4/2025
LT Trend Model: BUY as of 3/29/2023
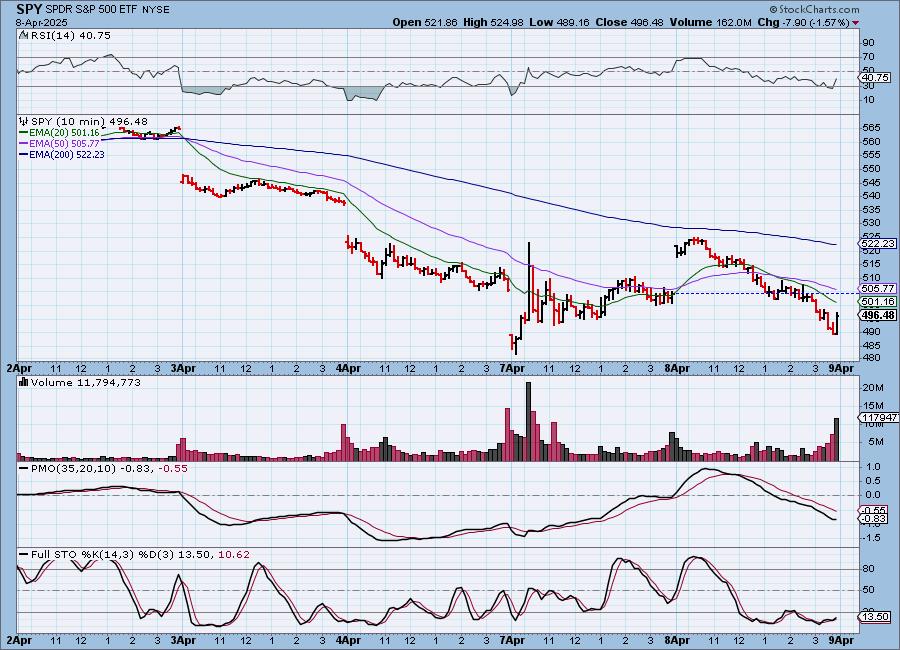
SPY 10-Minute Chart: Another volatile trading day. It started off well enough, but sunk all day long into negative territory. The 10-minute PMO does look interested in rising again. Stochastics are still very weak below 20, but are rising again.
SPY Daily Chart: It appeared on the open that we were going to see a nice snapback rally, but hopes were dashed as the trading saw continual decline. Price was unable to get back into the declining trend channel. One bright spot is that the RSI is oversold and that often times leads to an upside reversal. The PMO still looks negative as it falls.
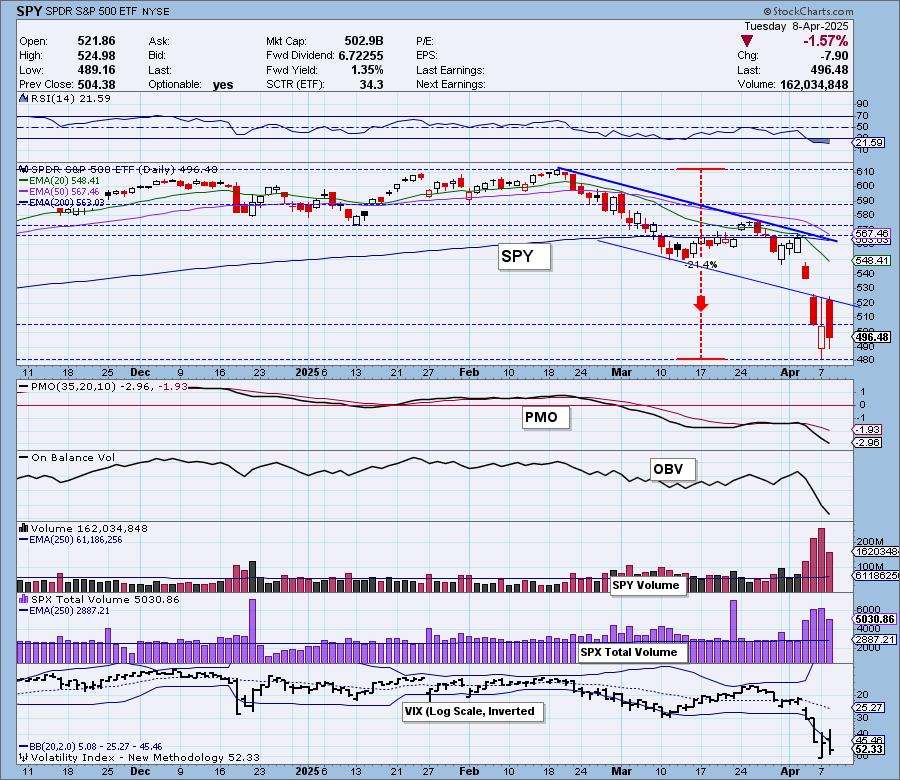
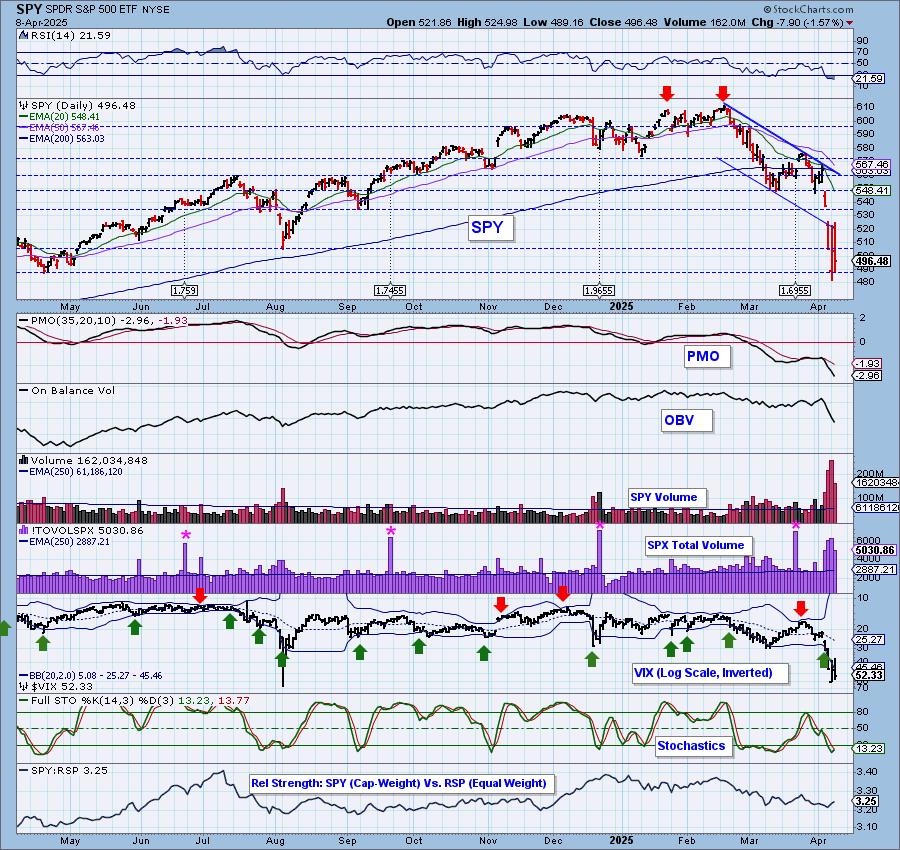
The VIX continues to puncture its lower Bollinger Band on the inverted scale and that does imply we could get an upside reversal off these very oversold readings. Stochastics did tip up, but don't look particularly bullish as they are still reading below 20.
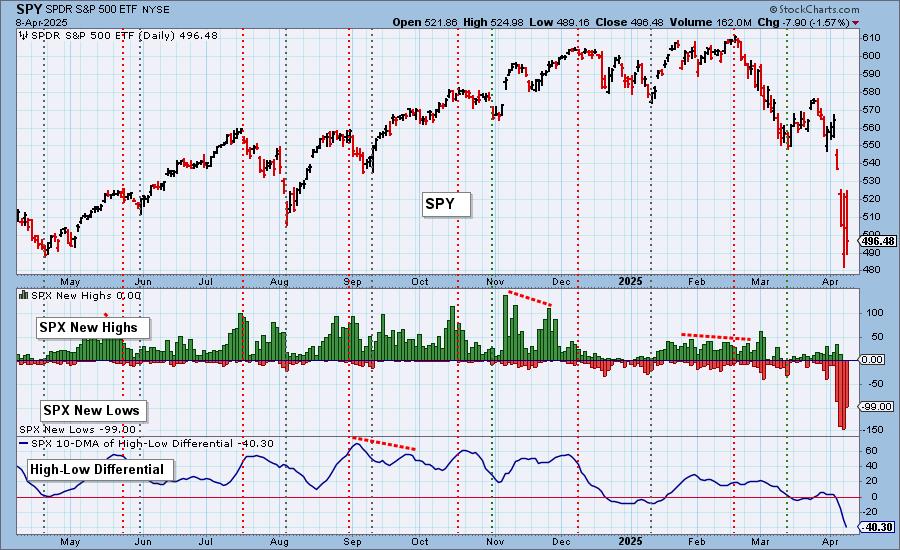
S&P 500 New 52-Week Highs/Lows: It was another day of no New Highs. We did see a contraction in New Lows, but there were plenty of them. The High-Low Differential is oversold by a mile. It doesn't usually see readings this low. The last time it was at this level was back in 2022. They were even lower than this. Remember oversold conditions in a bear market are thin ice, hard to build on.
Climax* Analysis: There were unanimous and strong climax readings today on the four relevant indicators, giving us another downside exhaustion climax. SPX Total Volume was 174% of the one-year daily average volume, which confirms the climax day and also implies a blowout. It tells us to look for an upside reversal, but, considering today's downside reversal, we're not so sure about that.
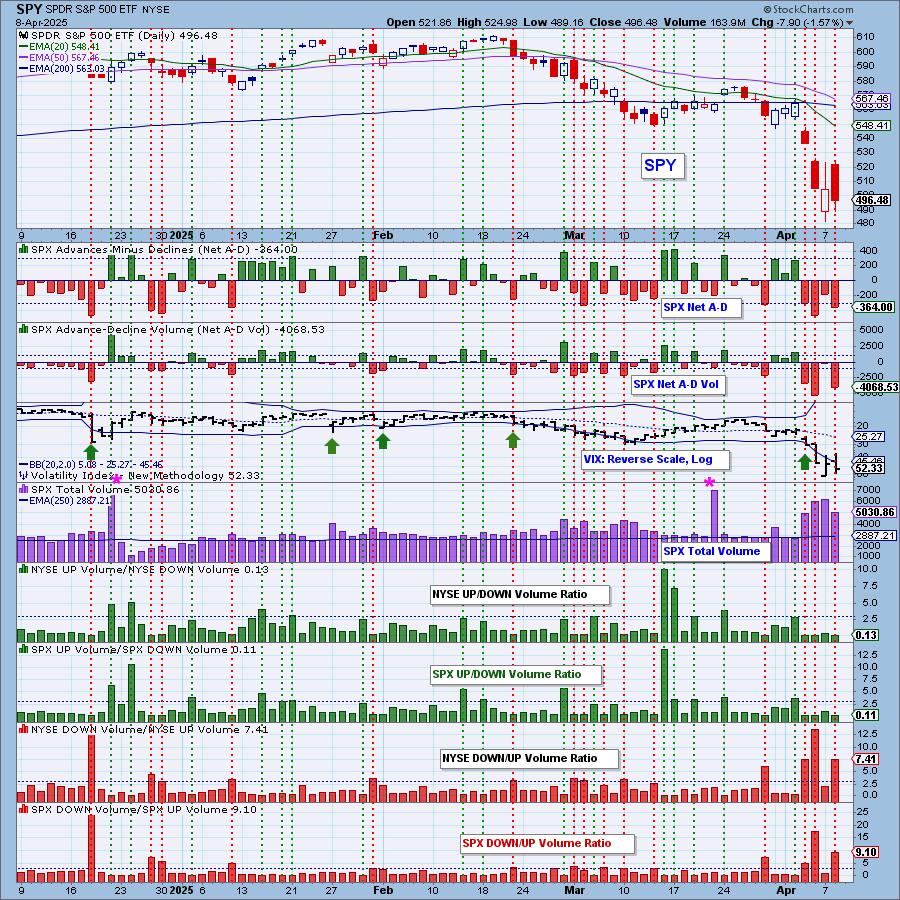
*A climax is a one-day event when market action generates very high readings in, primarily, breadth and volume indicators. We also include the VIX, watching for it to penetrate outside the Bollinger Band envelope. The vertical dotted lines mark climax days -- red for downside climaxes, and green for upside. Climaxes are at their core exhaustion events; however, at price pivots they may be initiating a change of trend.
Short-Term Market Indicators: The short-term market trend is DOWN and the condition is OVERSOLD.
The Swenlin Trading Oscillators (STOs) are now in oversold territory, but we've certainly see them move lower than this throughout the history of the indicator, especially in bear markets. Participation is nearly zero for stocks above their 20-day EMA. A mere 1% of stocks have rising momentum.
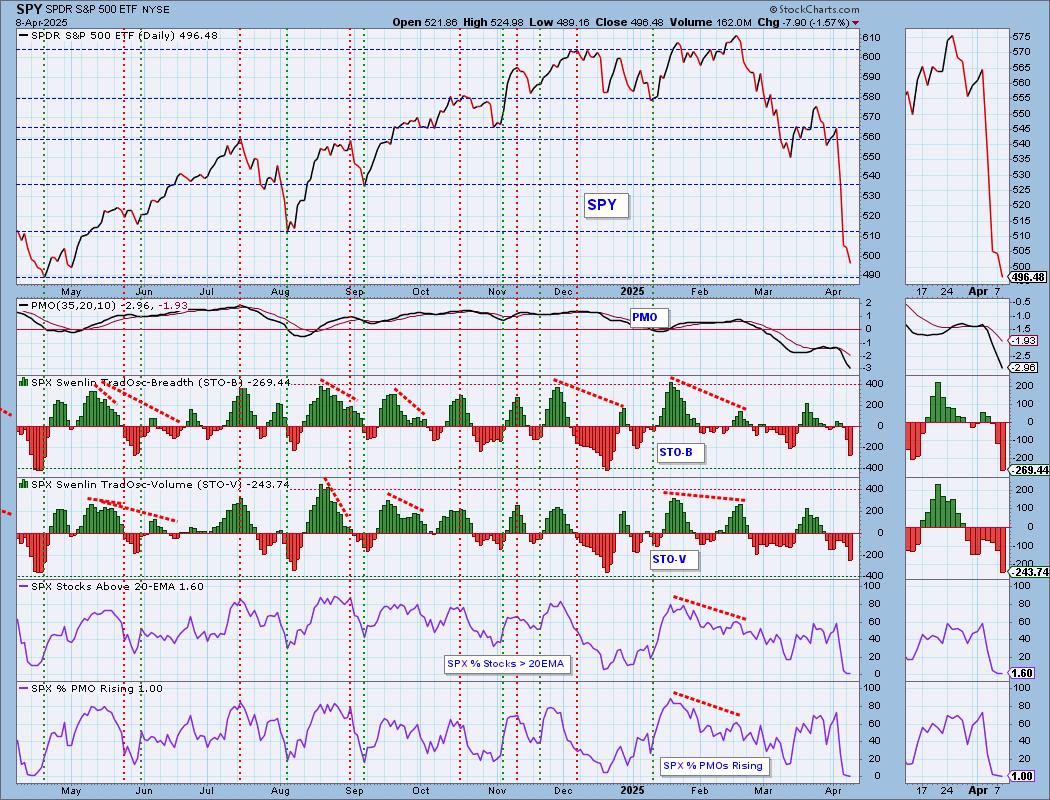
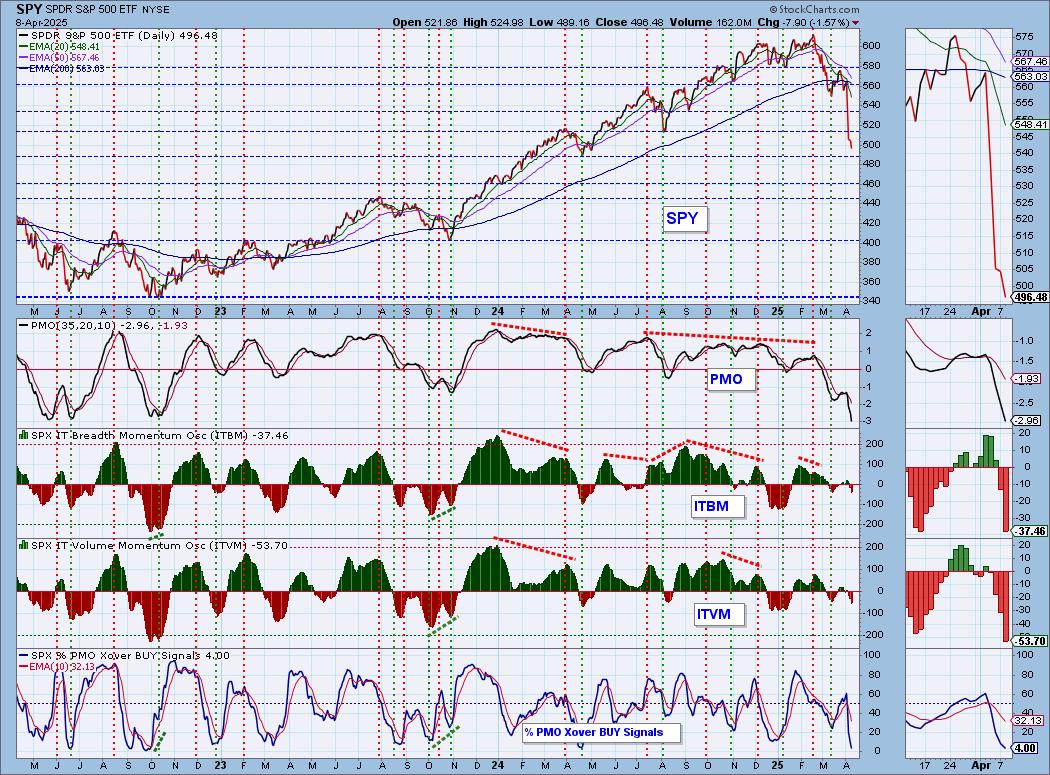
Intermediate-Term Market Indicators: The intermediate-term market trend is DOWN and the condition is NEUTRAL.
The ITBM and ITVM were much lower on the day. We only have 4% of stocks with PMO BUY Signals. The index is struggling in a big way and it will be tough to turn it around.
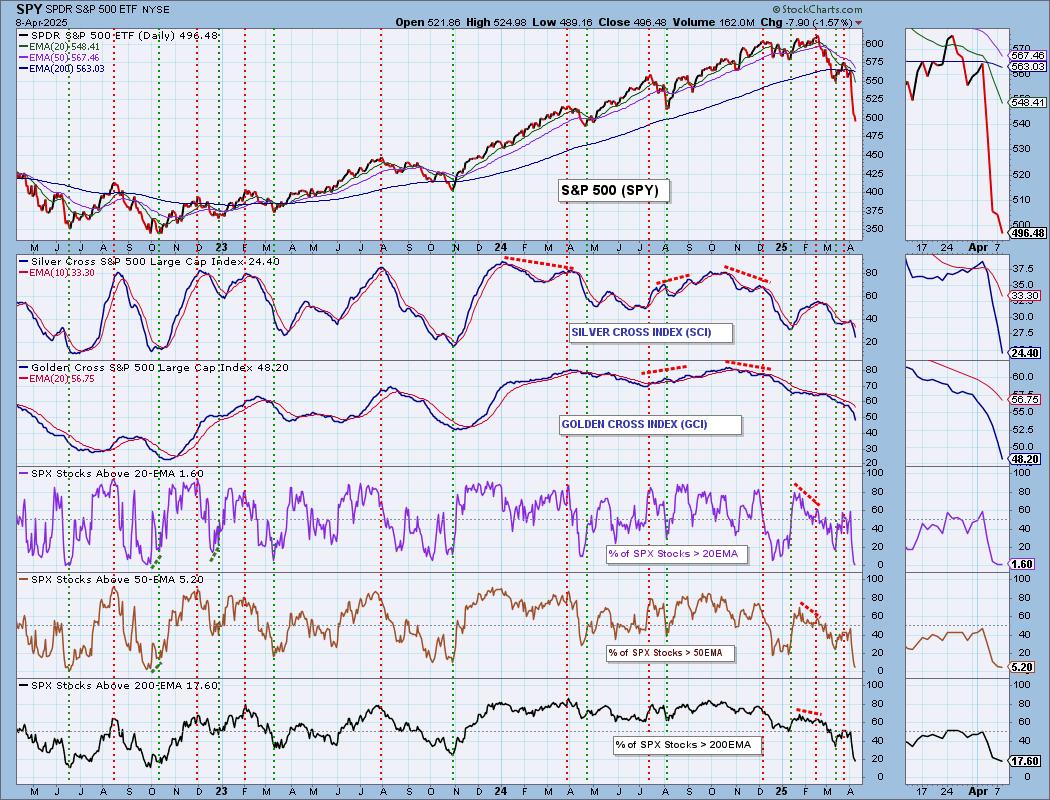
PARTICIPATION CHART (S&P 500): The following chart objectively shows the depth and trend of participation for the SPX in two time frames.
- Intermediate-Term - the Silver Cross Index (SCI) shows the percentage of SPX stocks on IT Trend Model BUY signals (20-EMA > 50-EMA). The opposite of the Silver Cross is a "Dark Cross" -- those stocks are, at the very least, in a correction.
- Long-Term - the Golden Cross Index (GCI) shows the percentage of SPX stocks on LT Trend Model BUY signals (50-EMA > 200-EMA). The opposite of a Golden Cross is the "Death Cross" -- those stocks are in a bear market.
The market bias is BEARISH in the intermediate and long terms.
Participation is definitely oversold now, but note that the Silver Cross Index and Golden Cross Index are not oversold yet. There is more damage to be done before we start looking for a meaningful rally. Both the Silver Cross Index and the Golden Cross Index are below their signal lines so the IT and LT Biases are BEARISH.
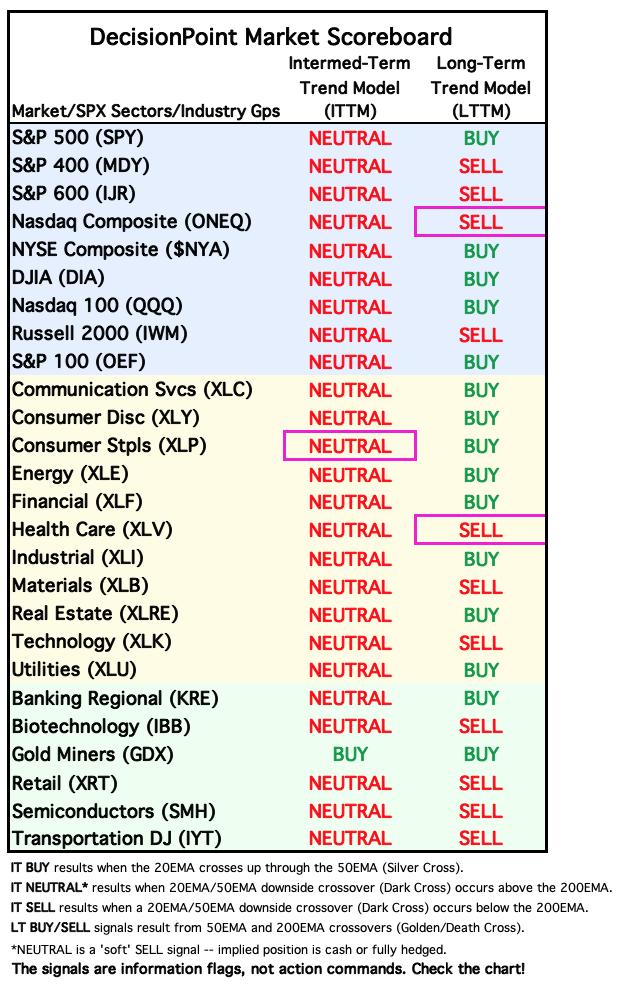
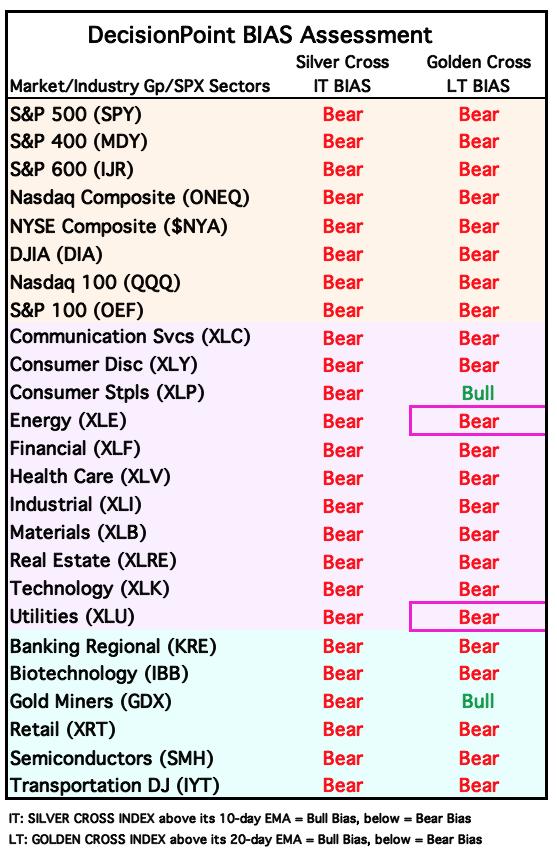
BIAS Assessment: The following table expresses the current BIAS of various price indexes based upon the relationship of the Silver Cross Index to its 10-day EMA (intermediate-term), and of the Golden Cross Index to its 20-day EMA (long-term). When the Index is above the EMA it is bullish, and it is bearish when the Index is below the EMA. The BIAS does not imply that any particular action should be taken. It is information to be used in the decision process.
The items with highlighted borders indicate that the BIAS changed today.
*****************************************************************************************************
CONCLUSION: We thought that yesterday's downside exhaustion climax was playing out as expected on the open today, but it didn't last. Tariffs are certainly to blame for being the catalyst to lower prices, but ultimately this market was overvalued, in fact, the most overvalued in history. The bear market is upon us so we need to remember bear market rules. Oversold indicators do leave us hopeful, but those conditions can persist and are thin ice. We would look for some kind of snapback, but investors are still concerned about these tariffs and we don't see much that will alleviate this. We wouldn't be piling in even on a rally as it isn't likely to last under these conditions.
Erin is 10% long, 0% short. (This is intended as information, not a recommendation.)
*****************************************************************************************************
CALENDAR

BITCOIN
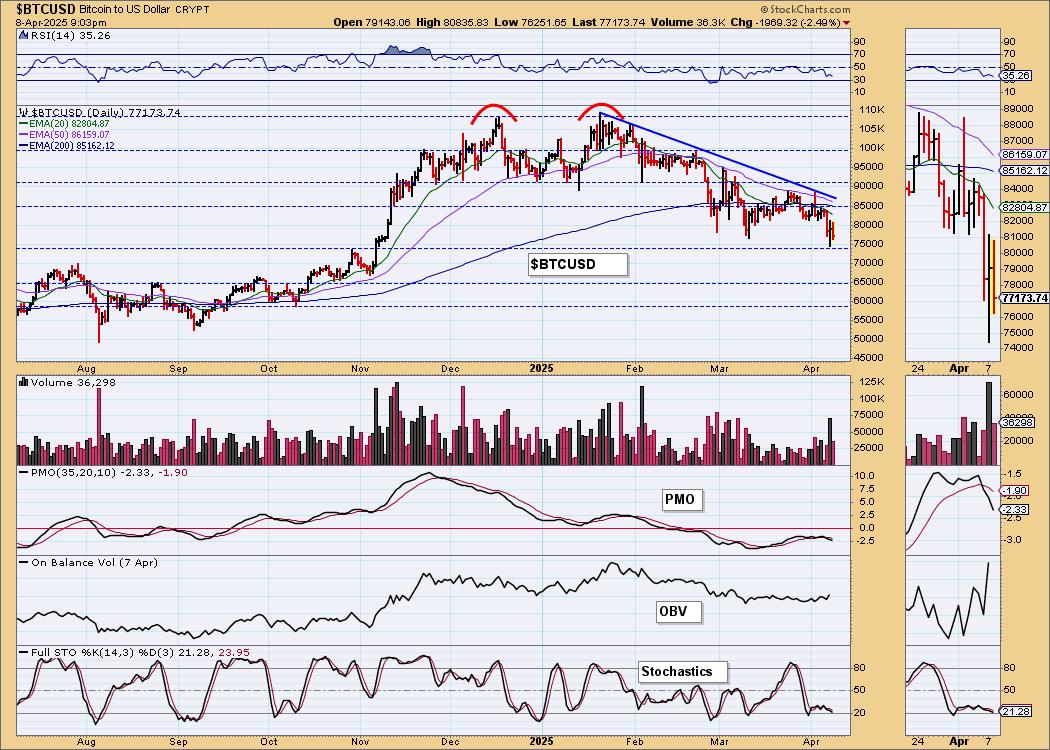
Bitcoin remains in a declining trend and it isn't really showing any signs that it will turn it around. We do see price on support right now, but it doesn't look that sturdy. The PMO has topped beneath the zero line and is on a Crossover SELL Signal. Stochastics are very negative and showing no signs that they'll perk up. We think this support level will be broken.
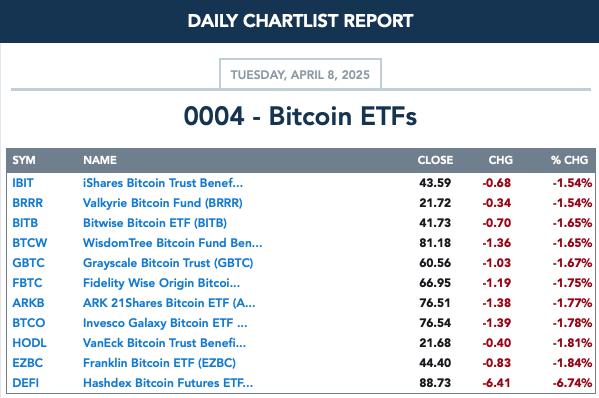
BITCOIN ETFs
INTEREST RATES
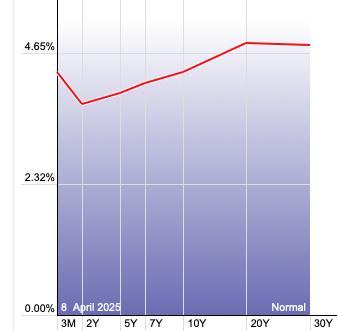
Long-term yields were higher on the day while most shorter-term yields were down. We are expecting them to come down, but we notice some declining trends are being challenged. We would expect to see a flight to Bonds that would bring rates down, but no such luck.
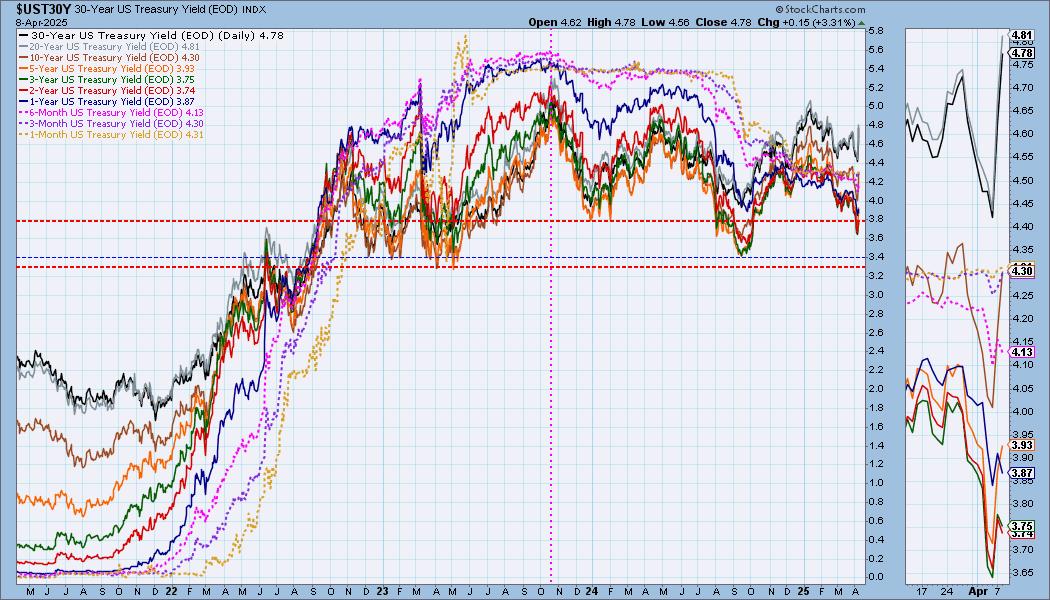
The Yield Curve Chart from StockCharts.com shows us the inversions taking place. The red line should move higher from left to right. Inversions are occurring where it moves downward.
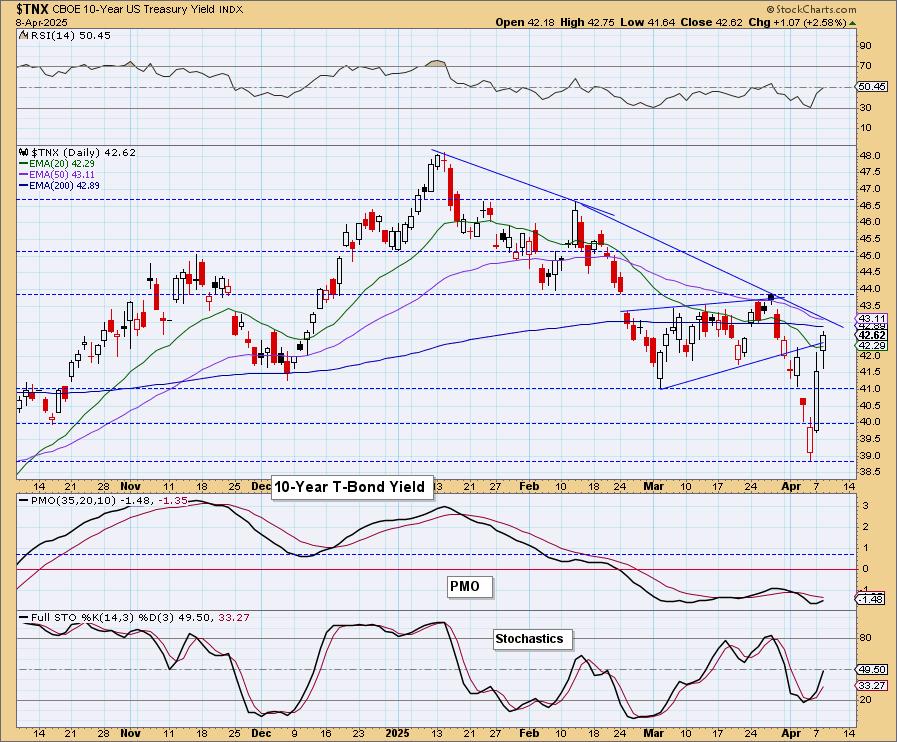
10-YEAR T-BOND YIELD
Despite the big rebound, the declining trend is still intact and we are counting on it to hold for now. The 200-day EMA is now being reached as resistance as well. Still, the indicators are bullish so we can't rule out a breakout.

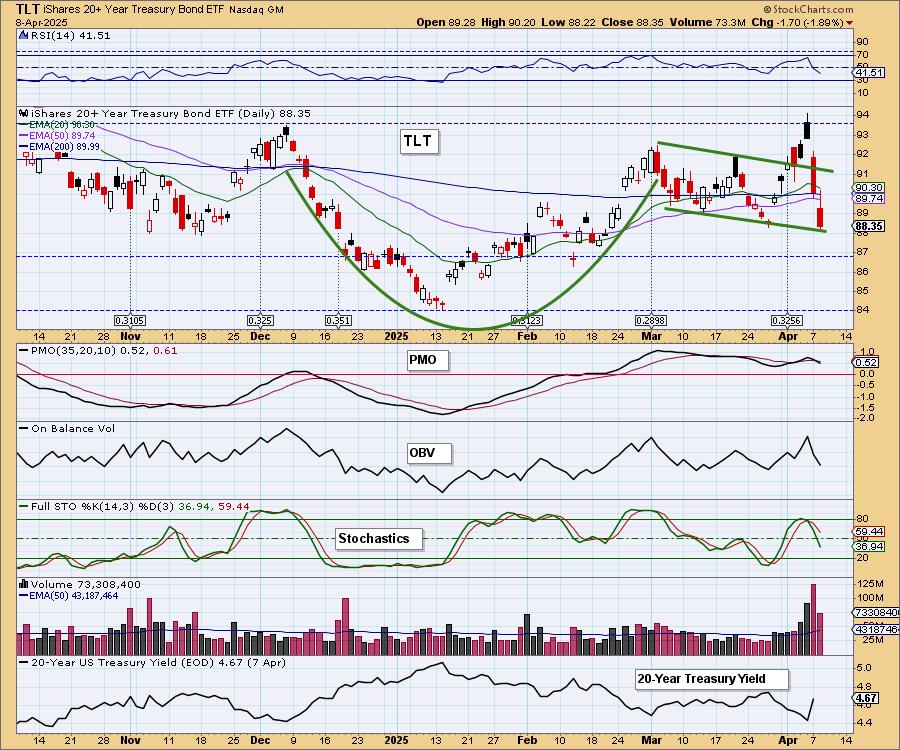
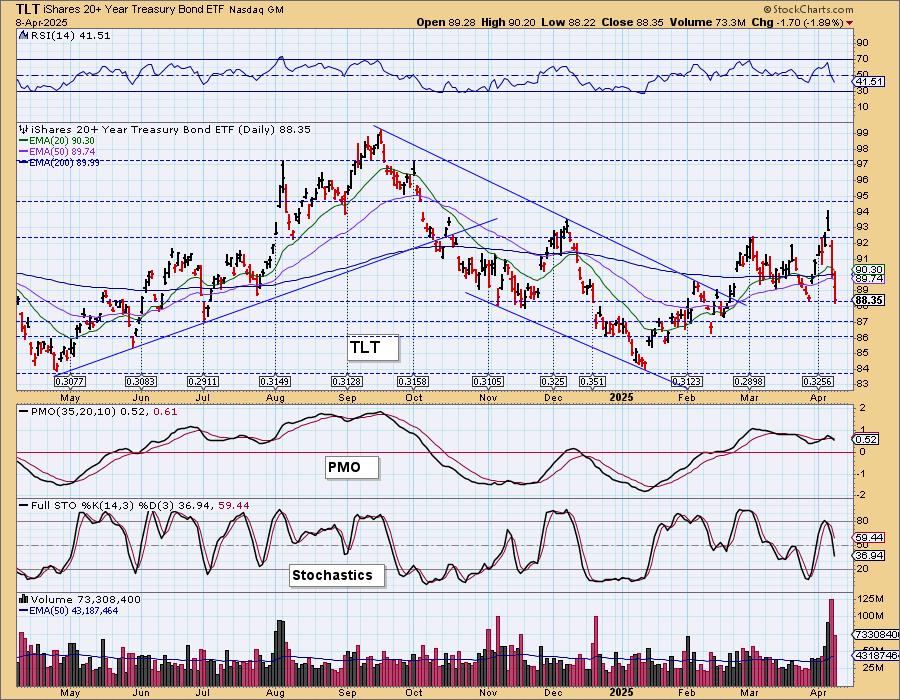
BONDS (TLT)
IT Trend Model: BUY as of 2/25/2025
LT Trend Model: SELL as of 12/13/2024
TLT Daily Chart: With yields rocketing higher, TLT was caught in the crossfire. The indicators look very bearish right now so this bullish cup with handle pattern is busting again. We're still cautiously bullish on Bonds, but have to admit the indicators look terrible. The 20-year yield is about to reach its declining tops trendline and that is where we would look for a rally in Bonds. For now support does look safe at 87.
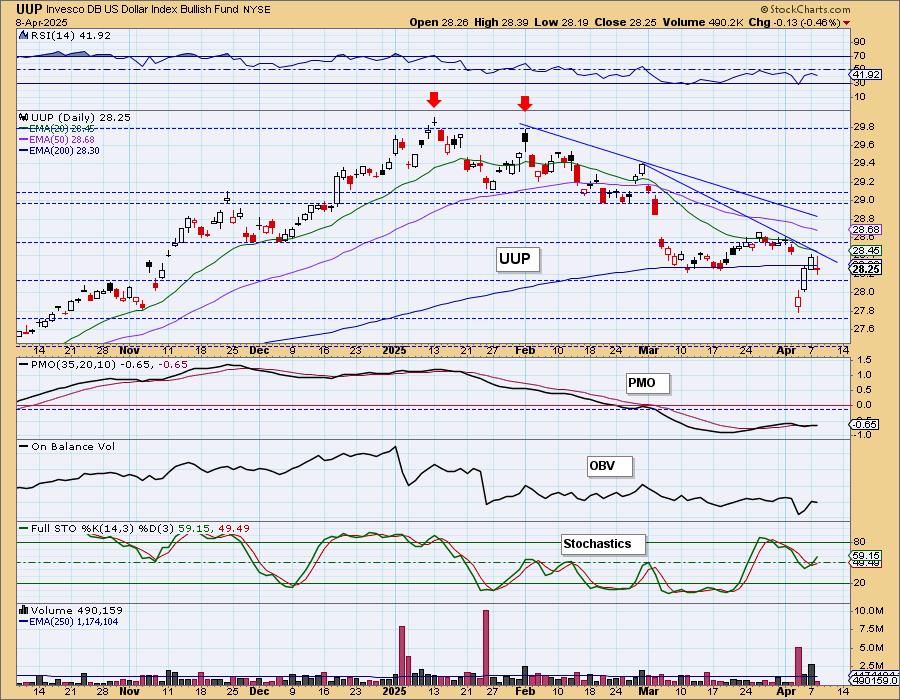
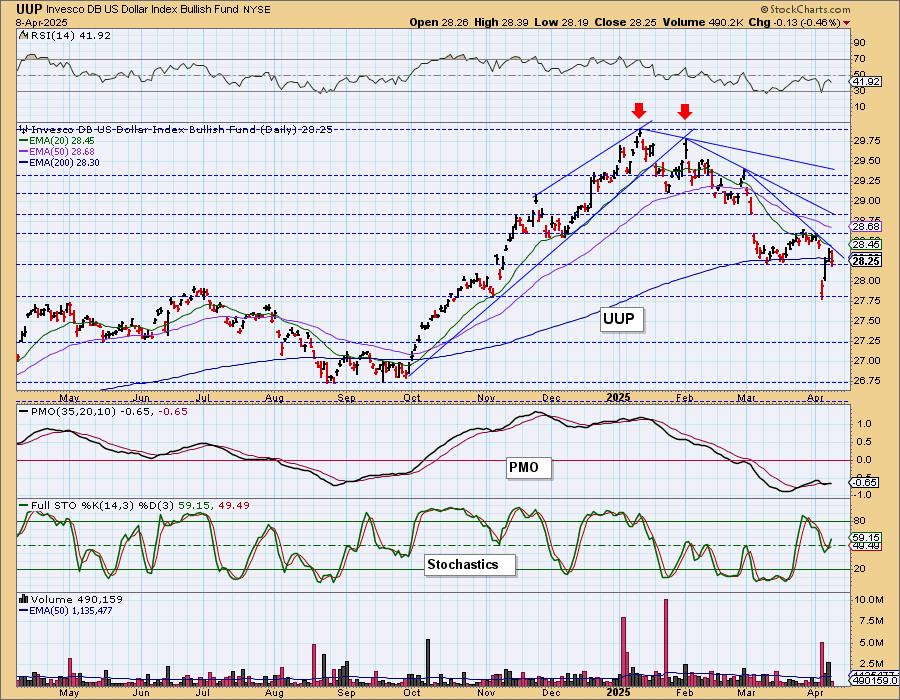
DOLLAR (UUP)
IT Trend Model: NEUTRAL as of 3/5/2025
LT Trend Model: BUY as of 5/25/2023
UUP Daily Chart: The Dollar hit the declining tops trendline and was turned away. However, we like what we're seeing on Stochastics and technically the PMO is crossing over its signal line. It isn't a huge vote of confidence as the PMO is below the zero line, but it does seem to suggest we'll see a breakout from the declining trend.
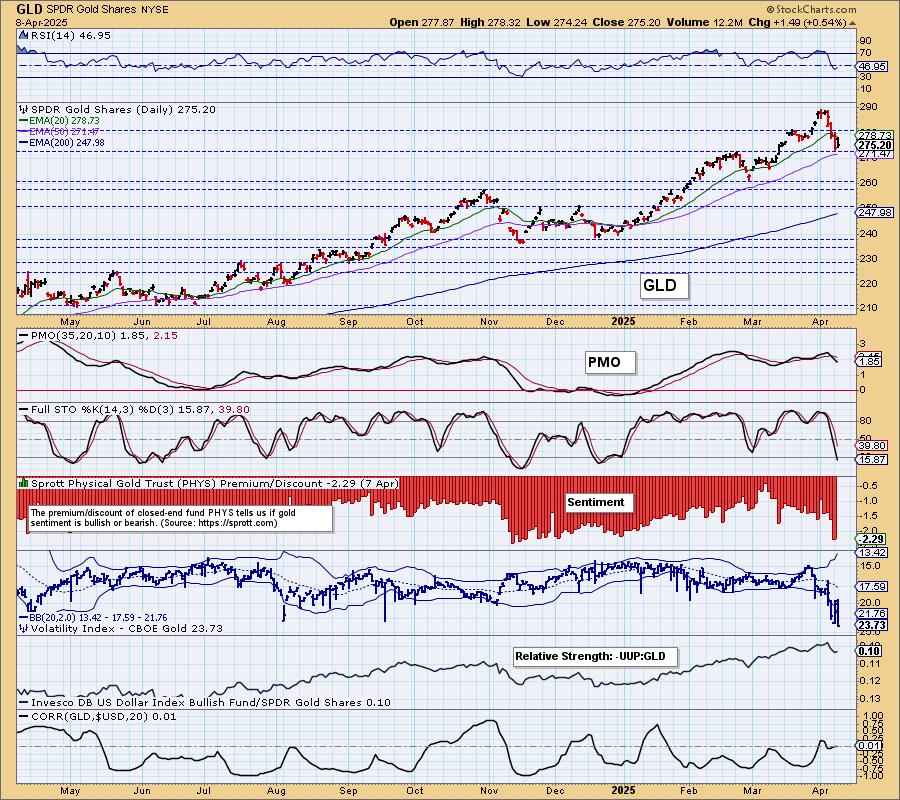
GOLD
IT Trend Model: BUY as of 1/10/2025
LT Trend Model: BUY as of 10/20/2023
GLD Daily Chart: Gold managed a small rally on the Dollar's decline. It is clinging to its rising bottoms trendline. Given the negative RSI and falling PMO and Stochastics, we don't think the rising trend will hold. We're looking for Gold to pullback to 265 or 260.
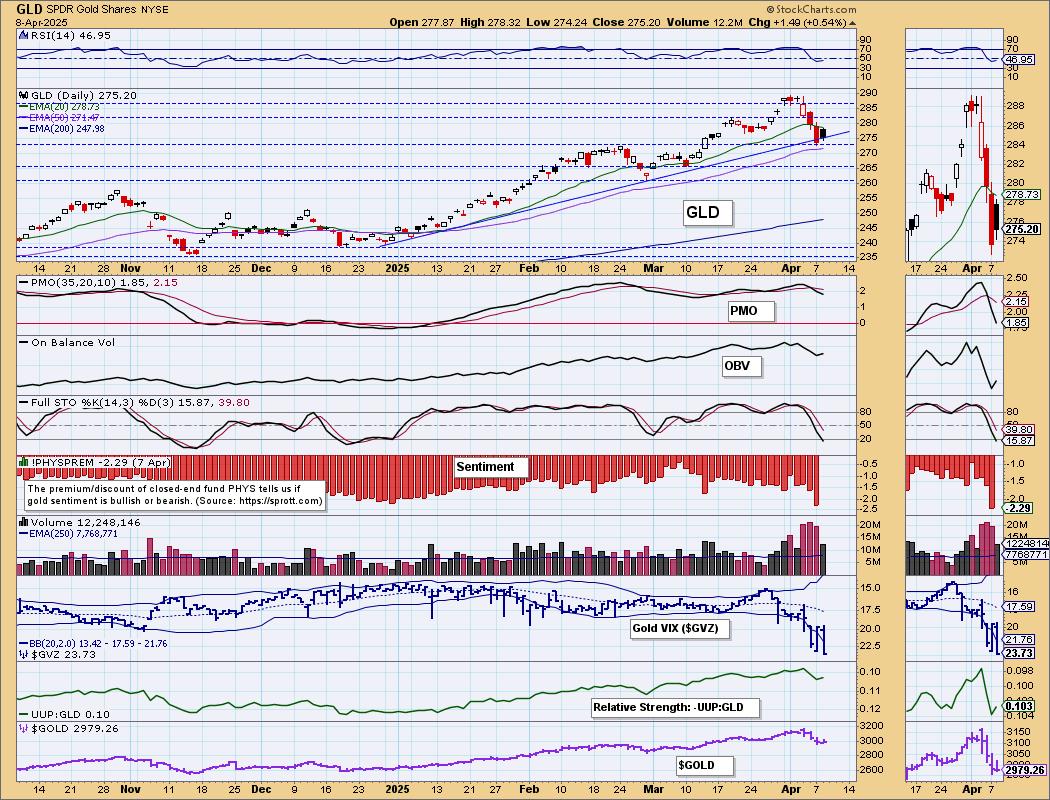
Relative strength to the Dollar is deteriorating and this will cause more trouble for Gold.
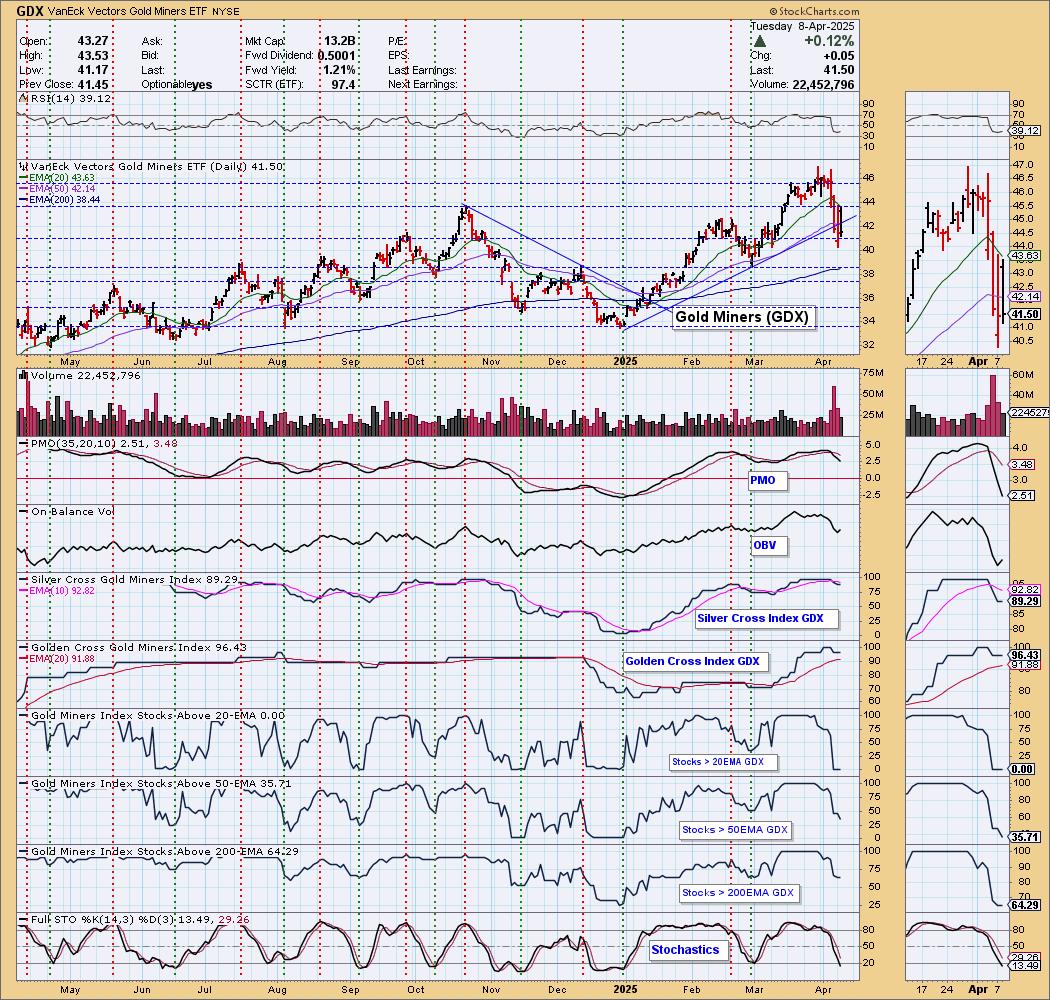
GOLD MINERS (GDX) Daily Chart: Yesterday's comments still apply:
"Being bearish on Gold means being bearish on Gold Miners which are highly sensitive to Gold prices. They are pulling back and have lost their rising trend. Participation was sucked out of the group and the Silver Cross Index has had a Bearish Shift across the signal line. We would look for a test at the early March low. We don't think it is out of the question that we could see it drop further from there. A market reversal could offer them an opportunity to rally, but Gold really needs to be on their side to get back to previous highs."
CRUDE OIL (USO)
IT Trend Model: NEUTRAL as of 2/27/2025
LT Trend Model: SELL as of 3/18/2025
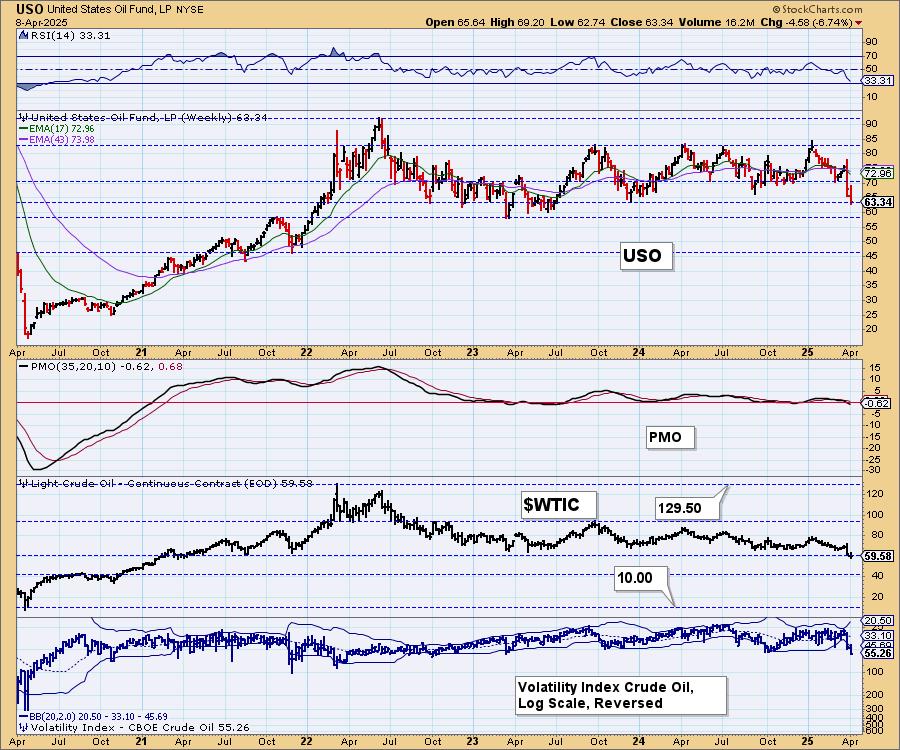
USO Daily Chart: The sell-off in Crude continued today. The administration now seems to be applying their efforts to bring down energy prices and we think in general they will be successful. The RSI is now oversold so it does seem to be the time to look for some kind of bounce. The Crude volatility index ($OVX) is below its lower Bollinger Band again and that could also work in its favor.
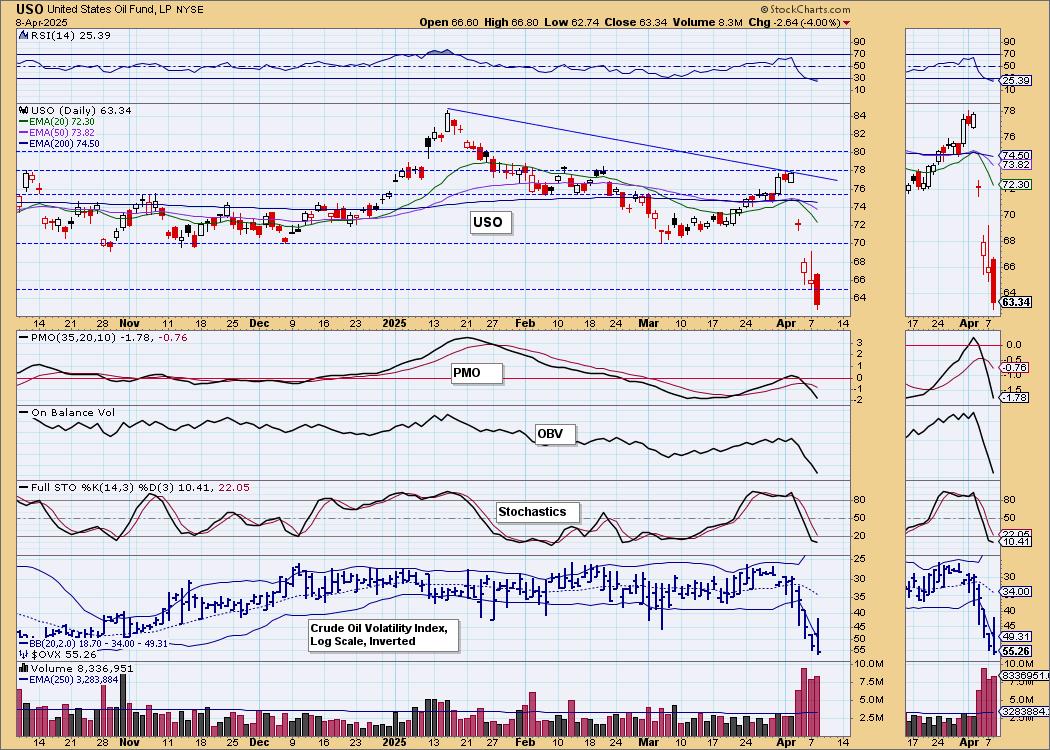
It has dropped below important support at the September low which is another reason to look for some kind of bounce.
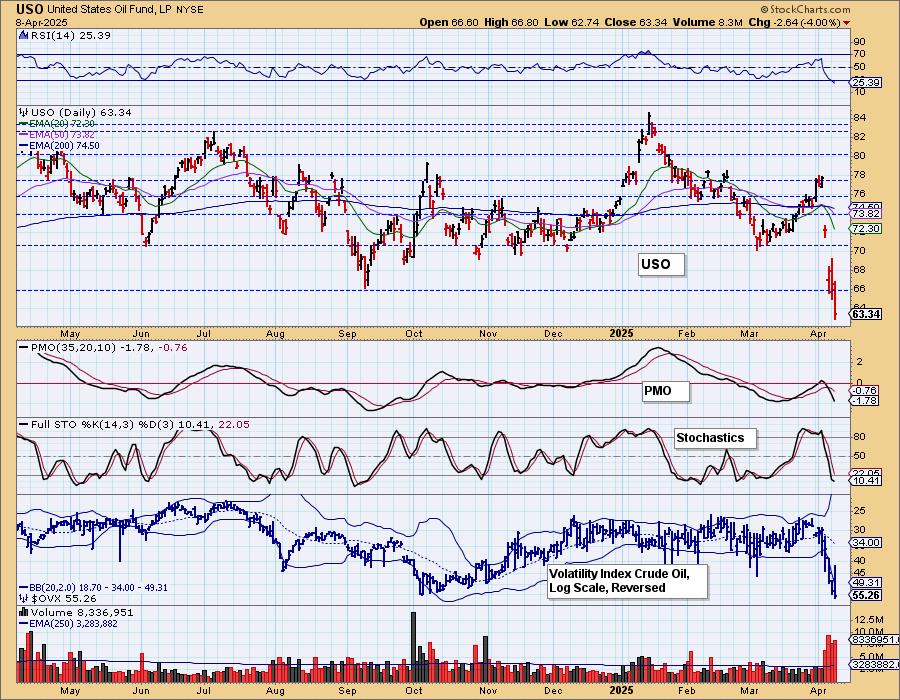
We are also seeing support available in the long-term trading range where a bounce could be had.
Good Luck & Good Trading!
Erin Swenlin and Carl Swenlin
Technical Analysis is a windsock, not a crystal ball. --Carl Swenlin
(c) Copyright 2025 DecisionPoint.com
Disclaimer: This blog is for educational purposes only and should not be construed as financial advice. The ideas and strategies should never be used without first assessing your own personal and financial situation, or without consulting a financial professional. Any opinions expressed herein are solely those of the author, and do not in any way represent the views or opinions of any other person or entity.
DecisionPoint is not a registered investment advisor. Investment and trading decisions are solely your responsibility. DecisionPoint newsletters, blogs or website materials should NOT be interpreted as a recommendation or solicitation to buy or sell any security or to take any specific action.
NOTE: The signal status reported herein is based upon mechanical trading model signals, specifically, the DecisionPoint Trend Model. They define the implied bias of the price index based upon moving average relationships, but they do not necessarily call for a specific action. They are information flags that should prompt chart review. Further, they do not call for continuous buying or selling during the life of the signal. For example, a BUY signal will probably (but not necessarily) return the best results if action is taken soon after the signal is generated. Additional opportunities for buying may be found as price zigzags higher, but the trader must look for optimum entry points. Conversely, exit points to preserve gains (or minimize losses) may be evident before the model mechanically closes the signal.
Helpful DecisionPoint Links:
DecisionPoint Alert Chart List
DecisionPoint Golden Cross/Silver Cross Index Chart List
DecisionPoint Sector Chart List
Price Momentum Oscillator (PMO)