
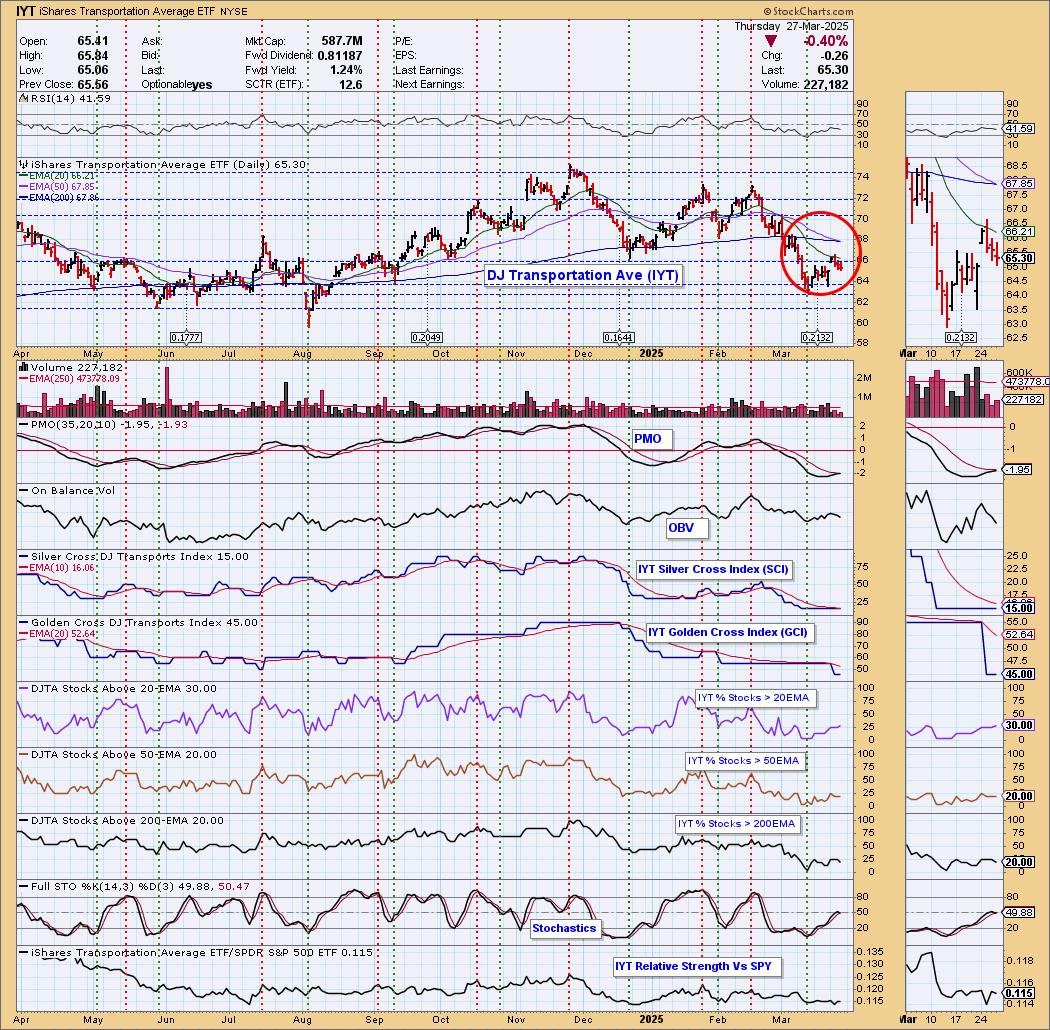
Today the Dow Jones Transportation Average ETF (IYT) 50-day EMA crossed down through the 200-day EMA (Death Cross), generating an LT Trend Model SELL Signal. Price is bouncing off support, but we see a bearish reverse flag formation that could spell trouble. The PMO is nearing a Crossover BUY Signal but it is well below the zero line so there is still weakness visible. Participation is unhealthy, well below our bullish 50% threshold. We expect this rally will run out of steam.
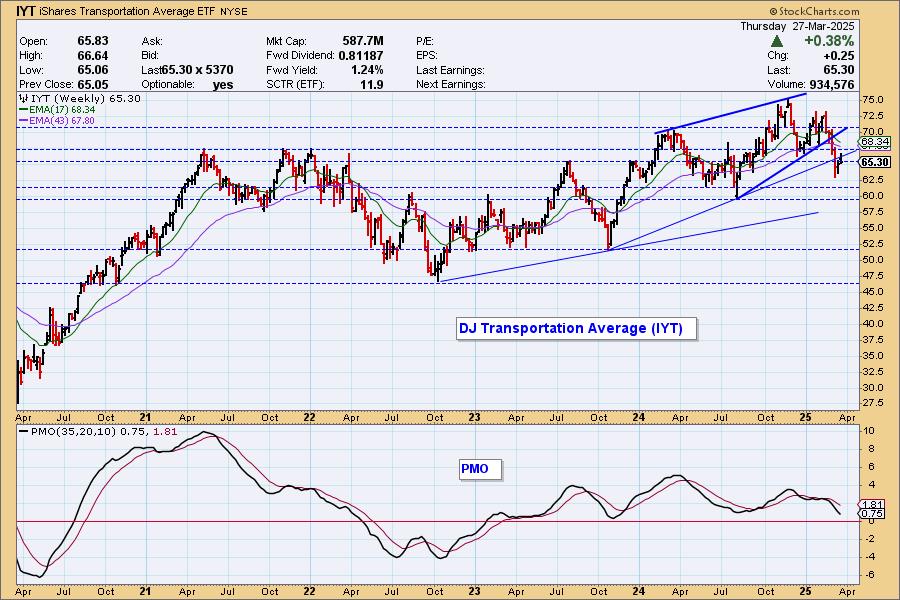
We have a breakdown out of two rising wedges. We see a possible double top formation that has technically been confirmed with the loss of support at the 2024 low. The weekly PMO is declining suggesting we may see a test of the 2023 low.
The DecisionPoint Alert Weekly Wrap presents an end-of-week assessment of the trend and condition of the Stock Market, the U.S. Dollar, Gold, Crude Oil, and Bonds. The DecisionPoint Alert daily report (Monday through Thursday) is abbreviated and gives updates on the Weekly Wrap assessments.
Watch the latest episode of DecisionPoint on our YouTube channel here!
MARKET/INDUSTRY GROUP/SECTOR INDEXES
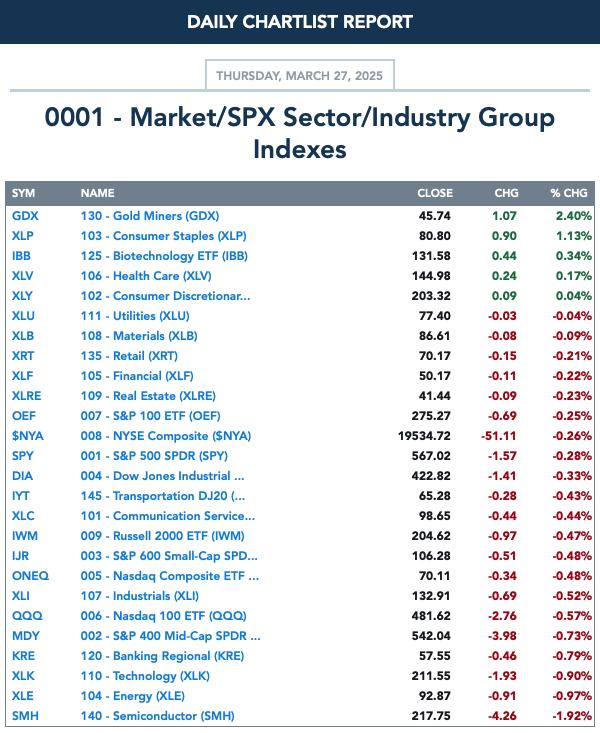
CLICK HERE for Carl's annotated Market Index, Sector, and Industry Group charts.
THE MARKET (S&P 500)
IT Trend Model: NEUTRAL as of 3/4/2025
LT Trend Model: BUY as of 3/29/2023
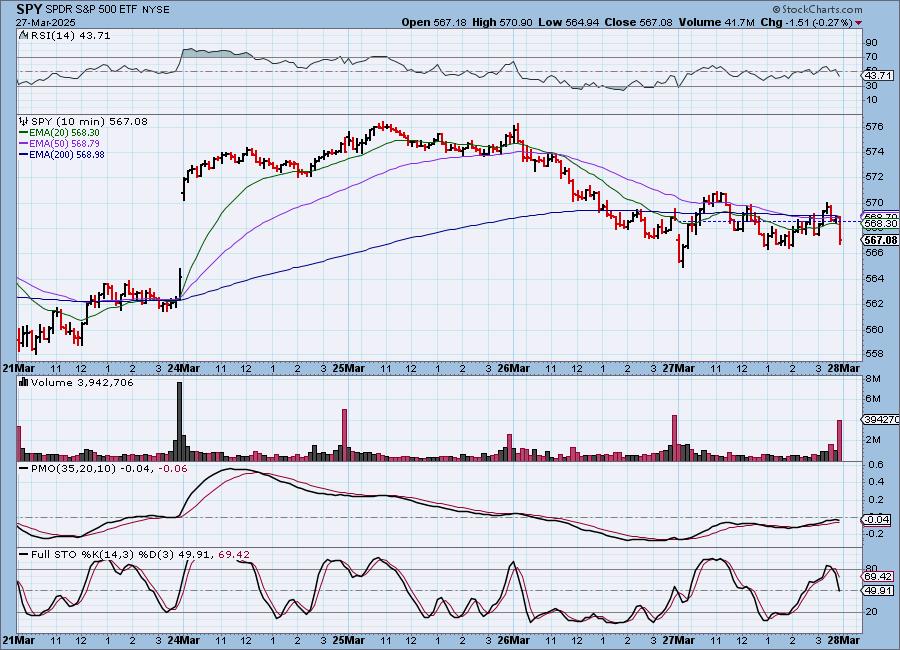
SPY 10-Minute Chart: Price spent the day churning back and forth, but the last ten minutes saw a steep drop that took out the late day rising trend. Stochastics look very negative going into trading tomorrow.
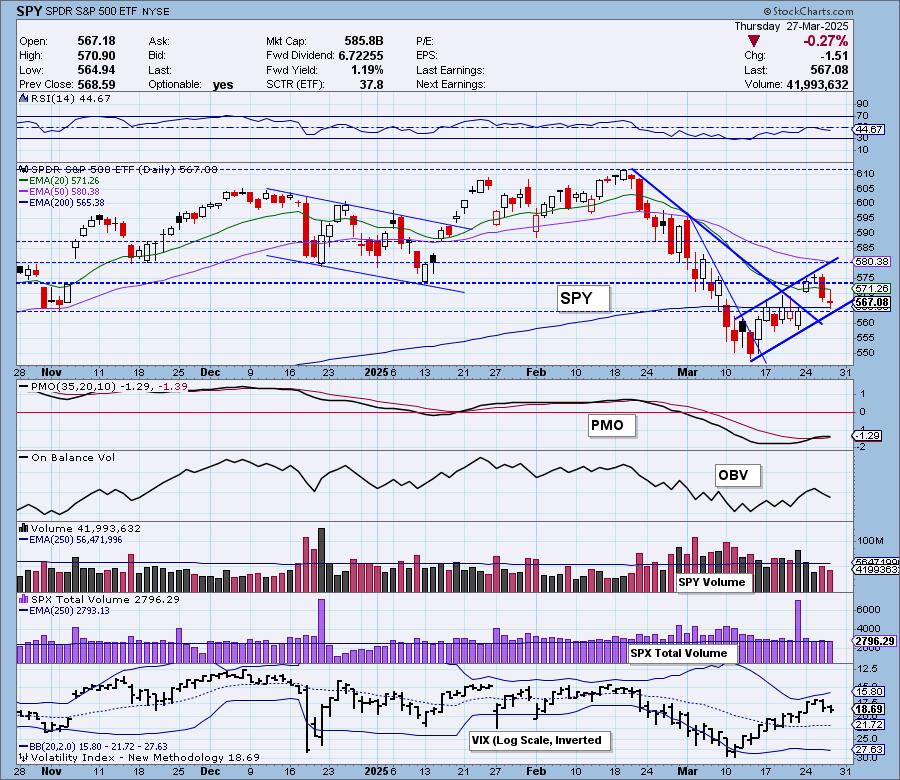
SPY Daily Chart: You can see a large bearish reverse flag that does tell us to expect a breakdown soon. The rising trend is already vulnerable. The PMO is still technically rising, but it looks toppy well beneath the zero line so we should think of this as diminishing weakness, not necessarily new strength.
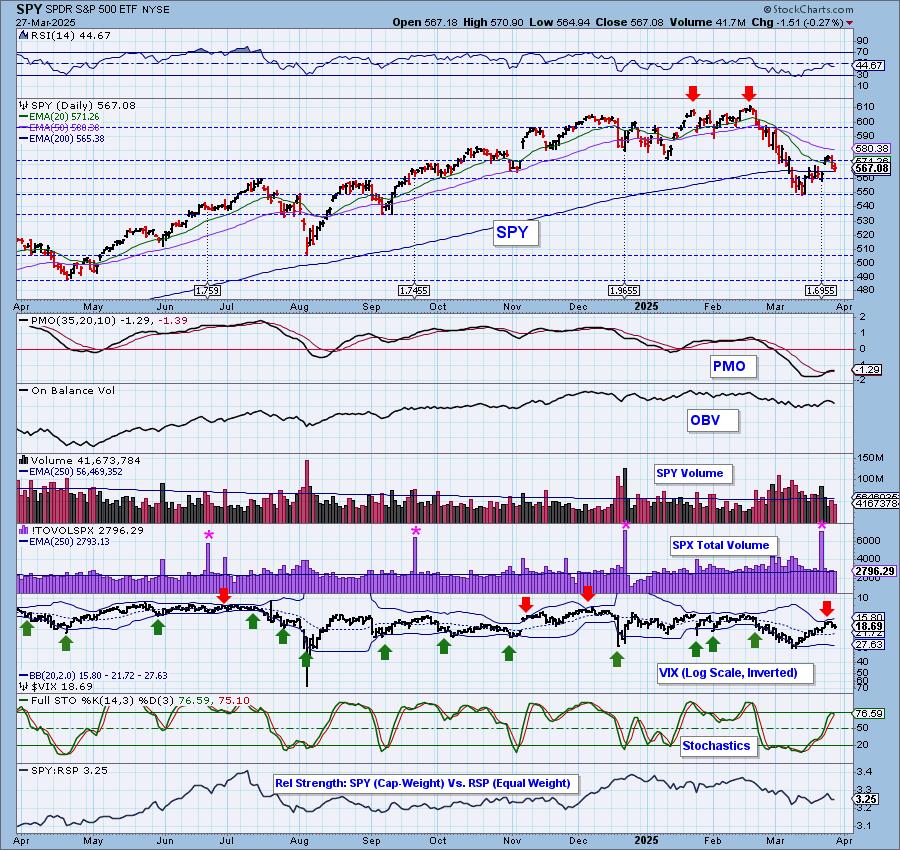
Investors are getting more negative on the market based on the retreating VIX on our inverted scale. It is still above the moving average which is somewhat positive under the circumstances. Stochastics have topped before getting above 80 so weakness may be coming in. Mega-caps appear to be traveling inline with equal-weight RSP. We need them to outperform to keep the index elevated.

Here is the latest recording from 3/24. Click HERE to get to our video list.:
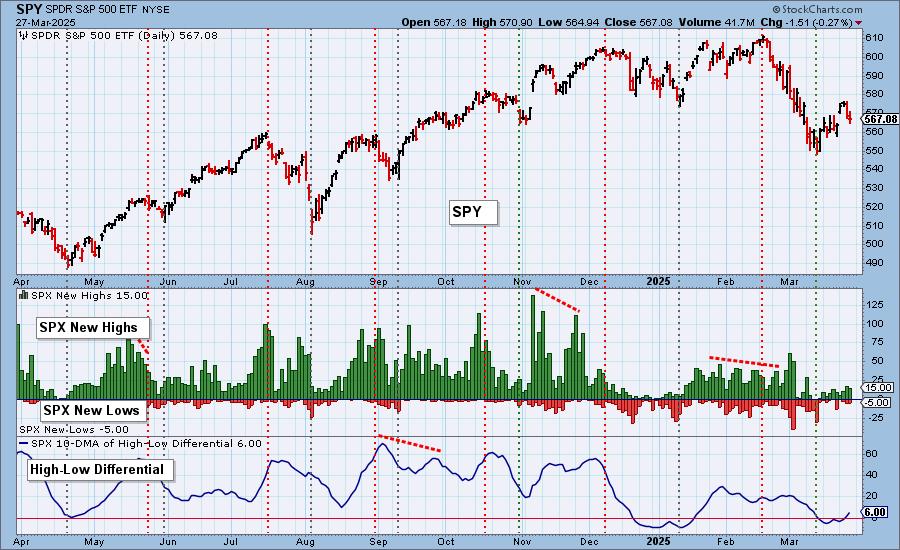
S&P 500 New 52-Week Highs/Lows: New Highs were still visible on today's decline so there are some winners out there. New Lows were not that prevalent. We like that the High-Low Differential is back on the rise.
Climax* Analysis: There were no climax readings today.
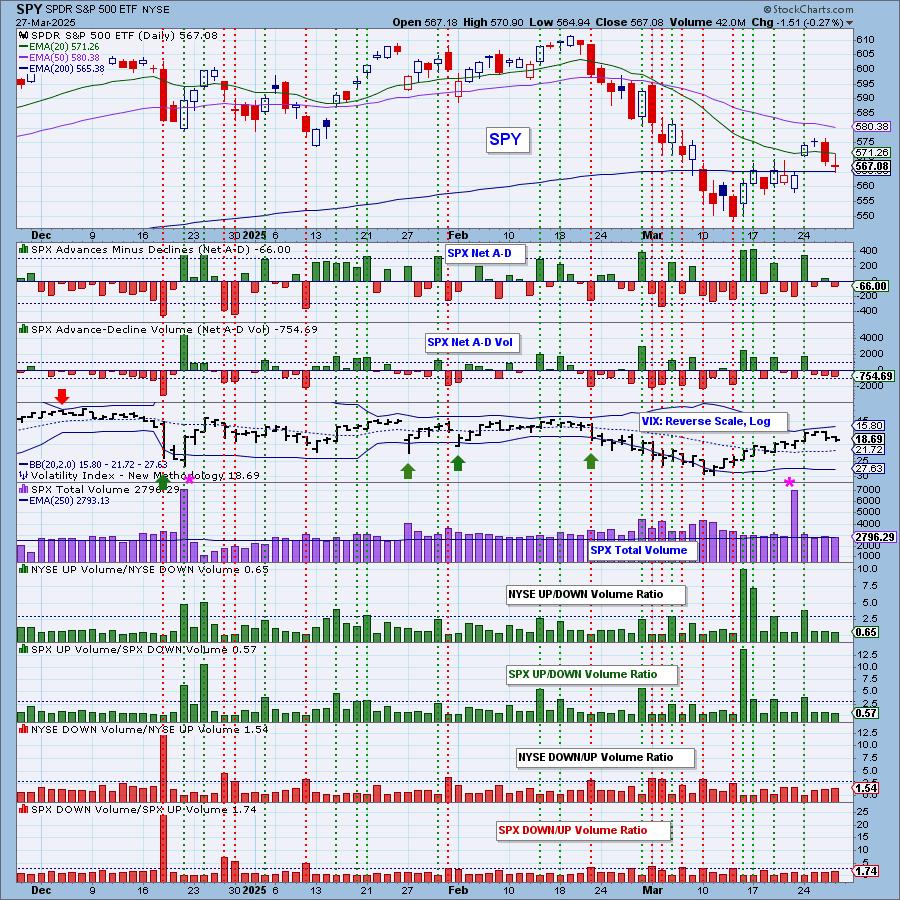
*A climax is a one-day event when market action generates very high readings in, primarily, breadth and volume indicators. We also include the VIX, watching for it to penetrate outside the Bollinger Band envelope. The vertical dotted lines mark climax days -- red for downside climaxes, and green for upside. Climaxes are at their core exhaustion events; however, at price pivots they may be initiating a change of trend.
Short-Term Market Indicators: The short-term market trend is UP and the condition is NEUTRAL.
The Swenlin Trading Oscillators (STOs) fell again today which suggests to us this rally is very vulnerable. Participation edged lower as we would expect on a decline. We lost some rising momentum internally.
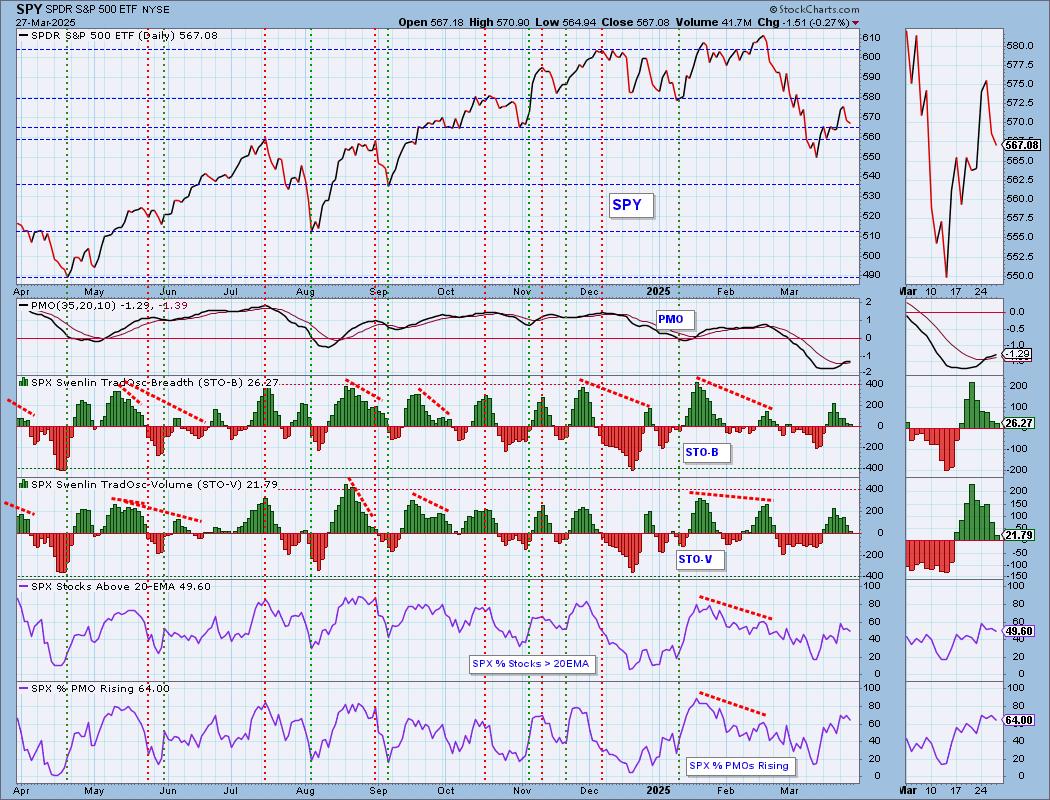
Intermediate-Term Market Indicators: The intermediate-term market trend is UP and the condition is NEUTRAL.
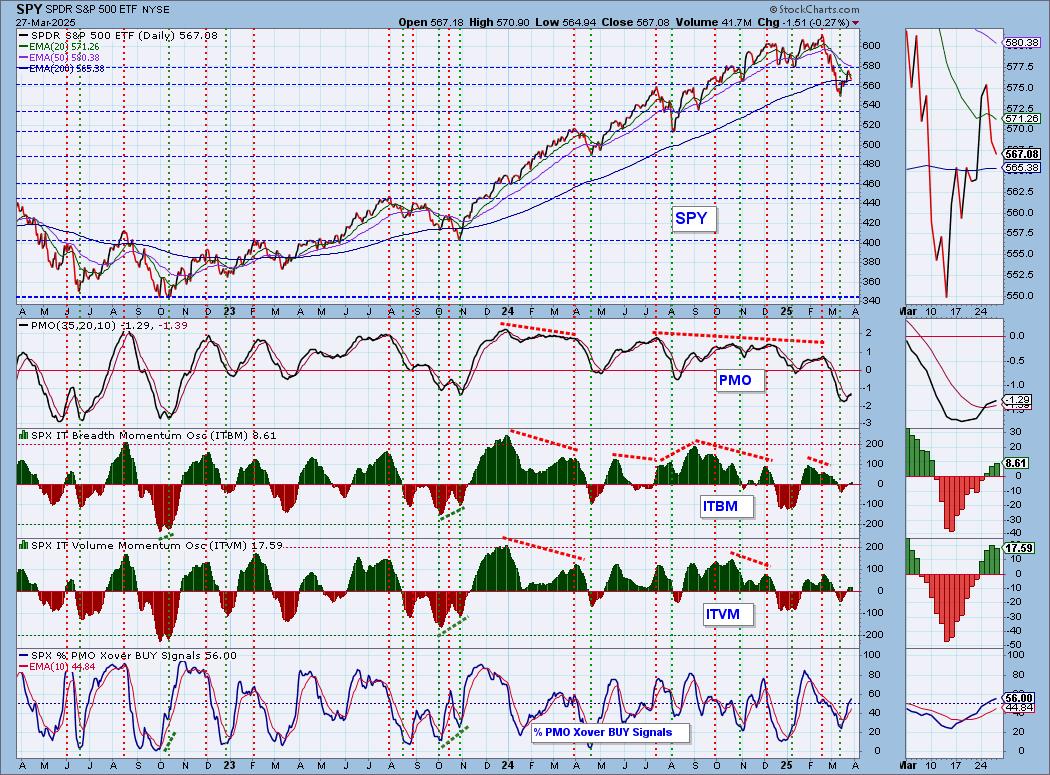
The ITVM topped today while the ITBM kept on rising. This deterioration is not welcome and could suggest the decline could continue into next week. We are seeing more PMO BUY Signals and that could continue since we still have more rising PMOs than PMO BUY Signals.
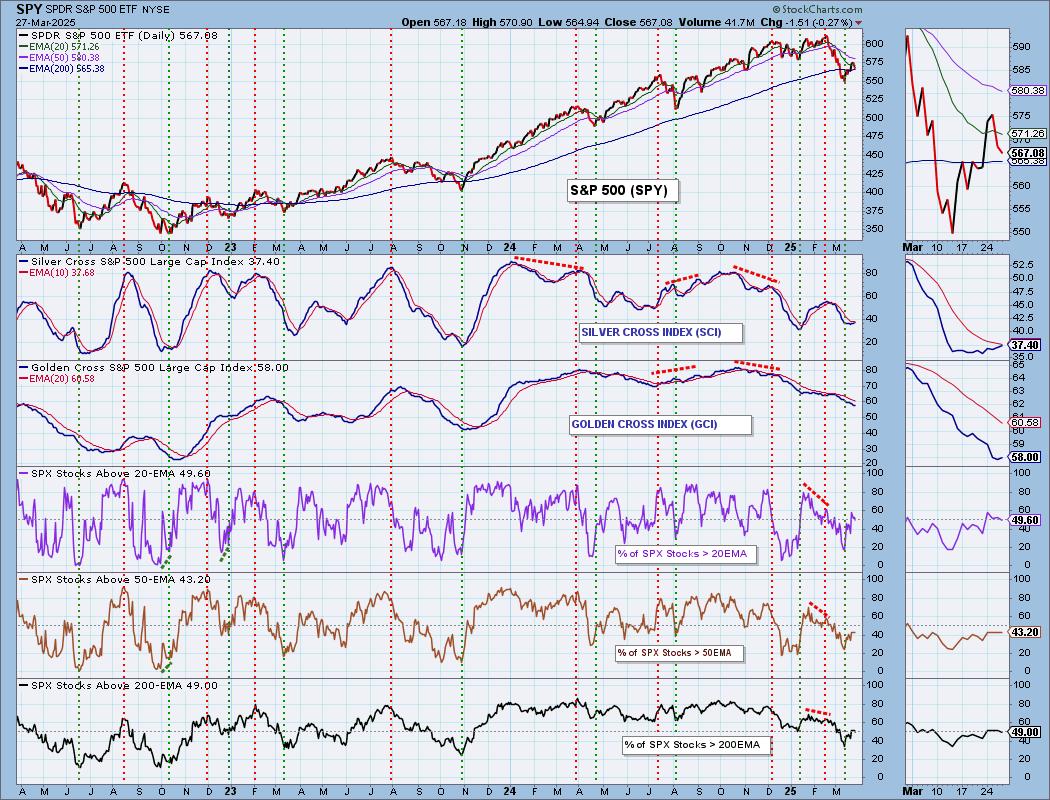
PARTICIPATION CHART (S&P 500): The following chart objectively shows the depth and trend of participation for the SPX in two time frames.
- Intermediate-Term - the Silver Cross Index (SCI) shows the percentage of SPX stocks on IT Trend Model BUY signals (20-EMA > 50-EMA). The opposite of the Silver Cross is a "Dark Cross" -- those stocks are, at the very least, in a correction.
- Long-Term - the Golden Cross Index (GCI) shows the percentage of SPX stocks on LT Trend Model BUY signals (50-EMA > 200-EMA). The opposite of a Golden Cross is the "Death Cross" -- those stocks are in a bear market.
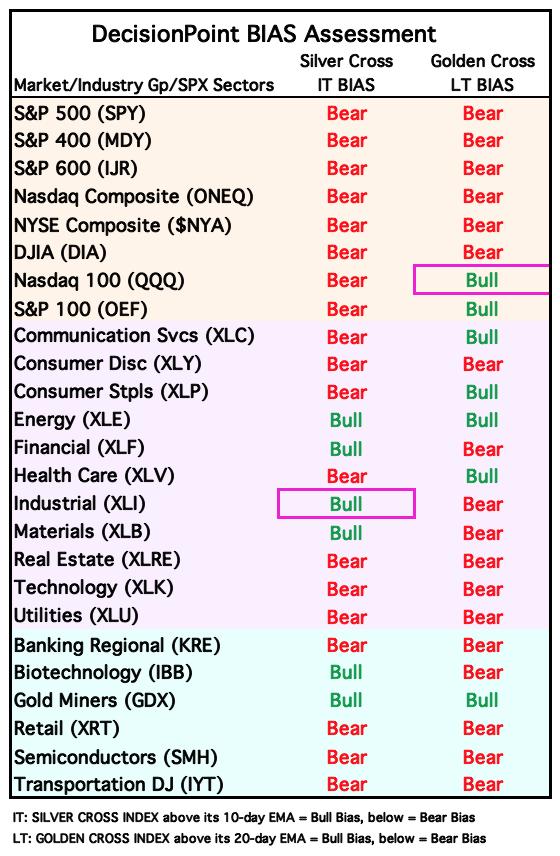
The market bias is BEARISH in the intermediate and long terms.
Participation is now below our 50% bullish threshold as is the Silver Cross Index. On the bright side the Silver Cross Index is rising again and could see a Bullish Shift soon. A move above the signal line would change the IT Bias to Bullish. It is still below it right now so the IT Bias is still BEARISH. The Golden Cross Index did turn up today, but that isn't likely to last as we have fewer stocks above the 200-day EMA. The Golden Cross Index is below its signal line so the LT Bias is still BEARISH.
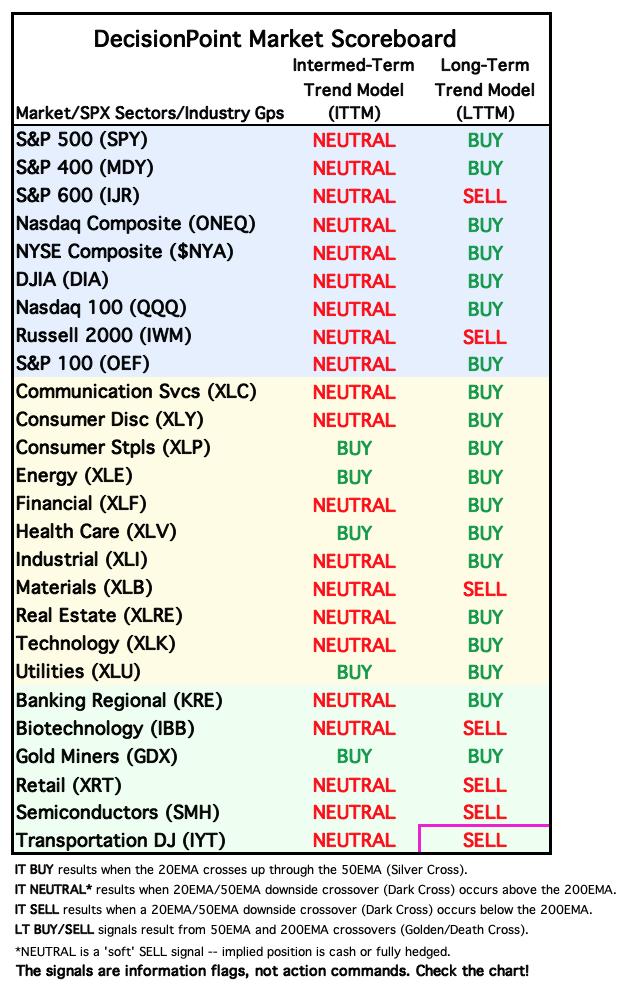
BIAS Assessment: The following table expresses the current BIAS of various price indexes based upon the relationship of the Silver Cross Index to its 10-day EMA (intermediate-term), and of the Golden Cross Index to its 20-day EMA (long-term). When the Index is above the EMA it is bullish, and it is bearish when the Index is below the EMA. The BIAS does not imply that any particular action should be taken. It is information to be used in the decision process.
The items with highlighted borders indicate that the BIAS changed today.
*****************************************************************************************************
CONCLUSION: The market spent the day churning back and forth. We see a bearish reverse flag on the chart and that pattern implies a breakdown out of the small rising trend the market has managed to form. The ITVM turned down and STOs continue lower. This rally seems highly vulnerable and with tariffs on the agenda for Tuesday, we have a feeling that will be the tipping point. If mega-caps don't pick up the slack, the market is doomed to slide lower and based on a quick review of the Magnificent Seven, they aren't particularly bullish right now. Protect your gains and honor your stops. We expect a bumpy road ahead. PCE will be released tomorrow so we could see some volatility.
Erin is 15% long, 0% short. (This is intended as information, not a recommendation.)
*****************************************************************************************************
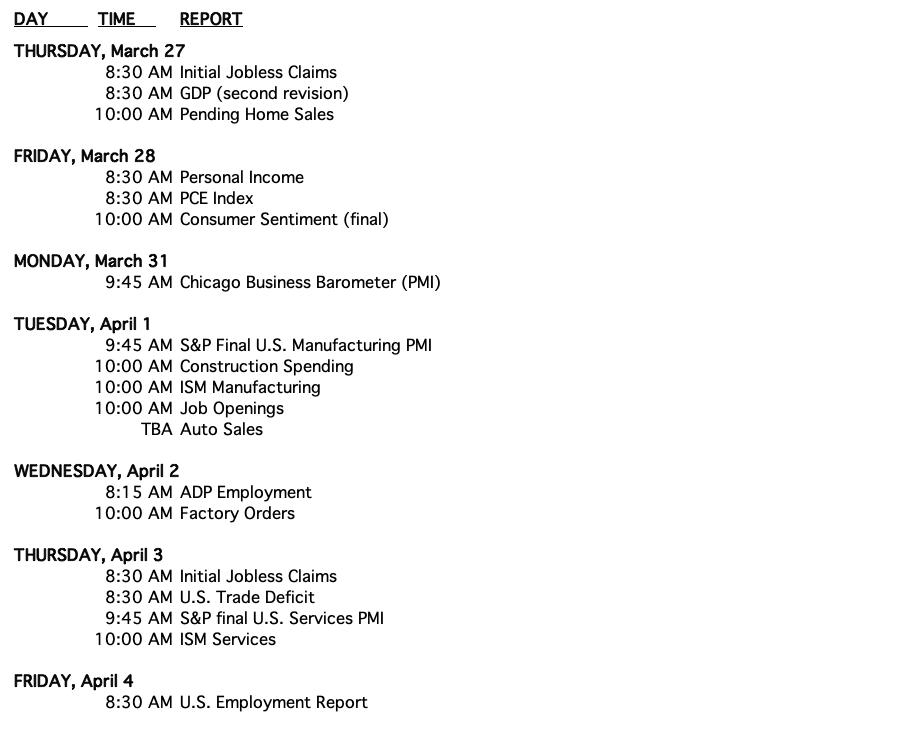
CALENDAR
Have you subscribed the DecisionPoint Diamonds yet? DP does the work for you by providing handpicked stocks/ETFs from exclusive DP scans! Add it with a discount! Contact support@decisionpoint.com for more information!
BITCOIN
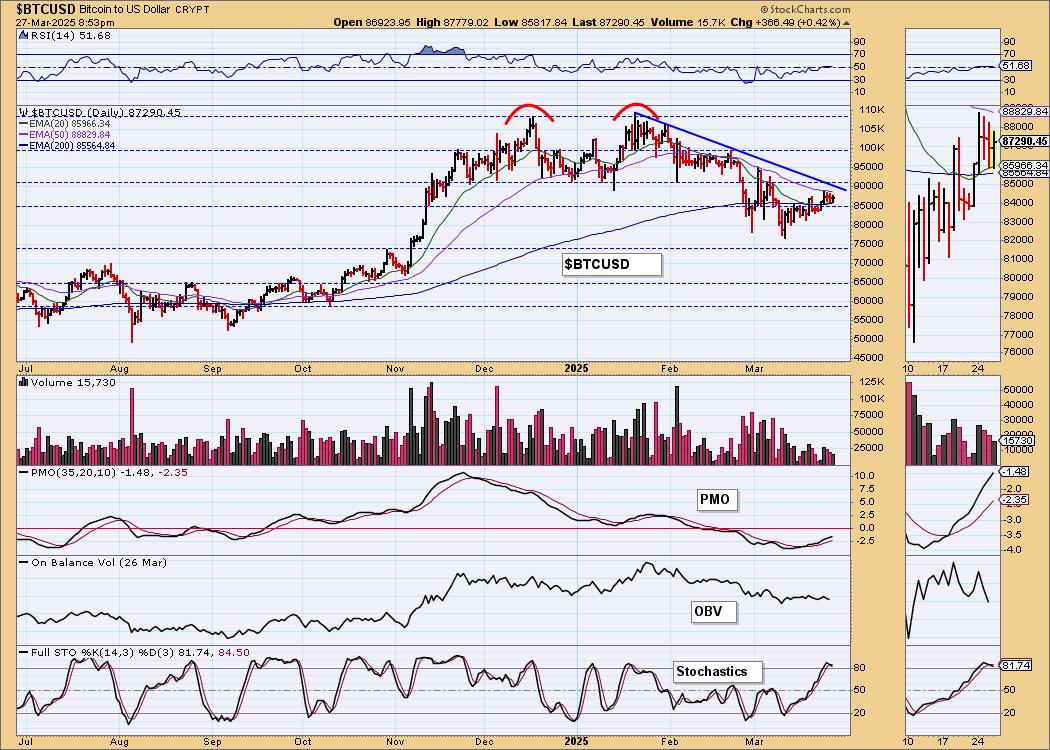
Yesterday's comments still apply:
"Bitcoin is struggling to get out of its declining trend. The indicators are suggesting it will happen as the RSI just moved into positive territory and the PMO is rising. Stochastics did tick down which isn't encouraging, but they are still holding above 80 so there is some internal strength to be had. We're cautiously bullish."
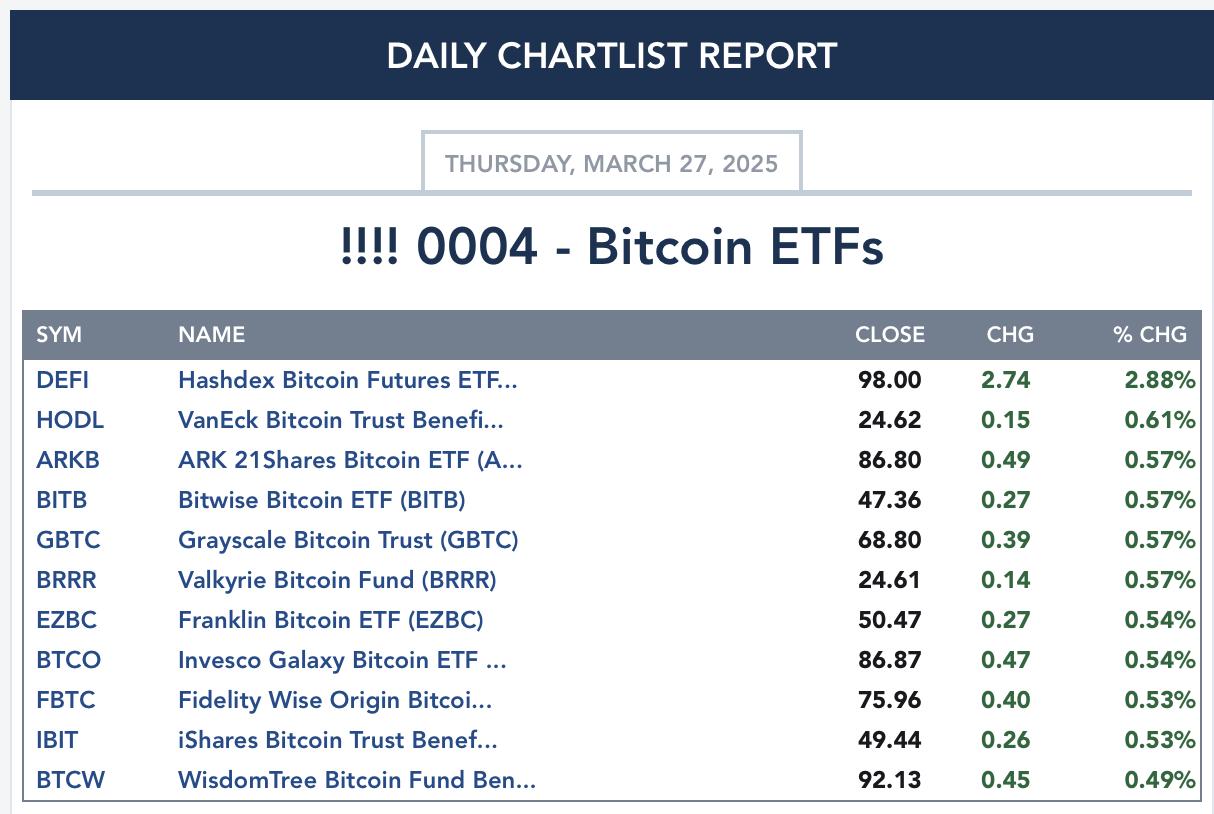
BITCOIN ETFs
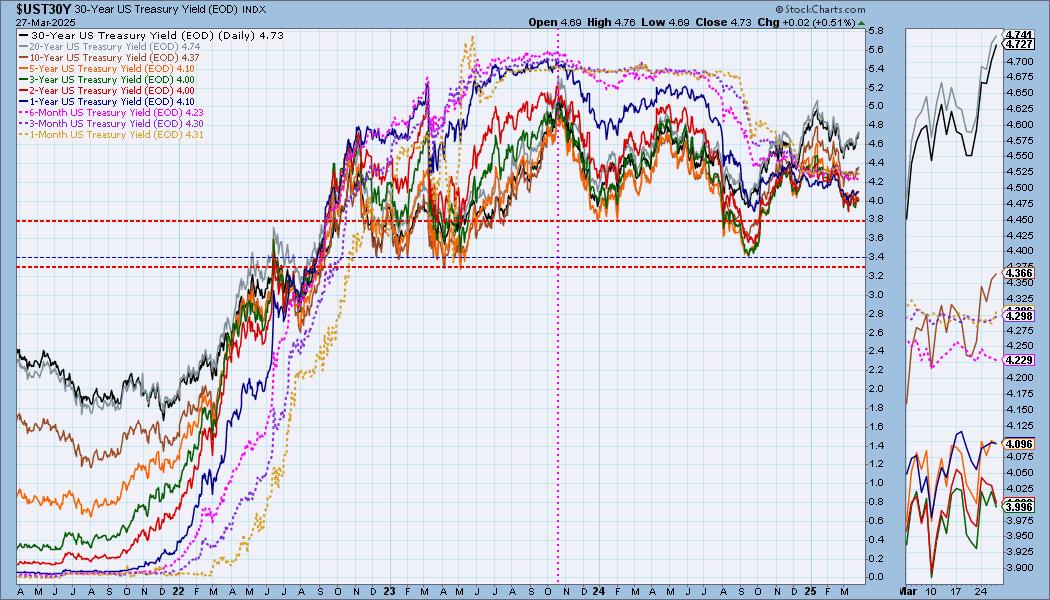
INTEREST RATES
Long-term yields are preserving their rising trends with some nearing breakouts from declining trends. We are looking for them to continue rising while we expect short-term yields to keep churning mostly sideways.
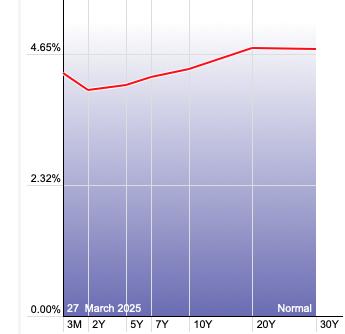
The Yield Curve Chart from StockCharts.com shows us the inversions taking place. The red line should move higher from left to right. Inversions are occurring where it moves downward.
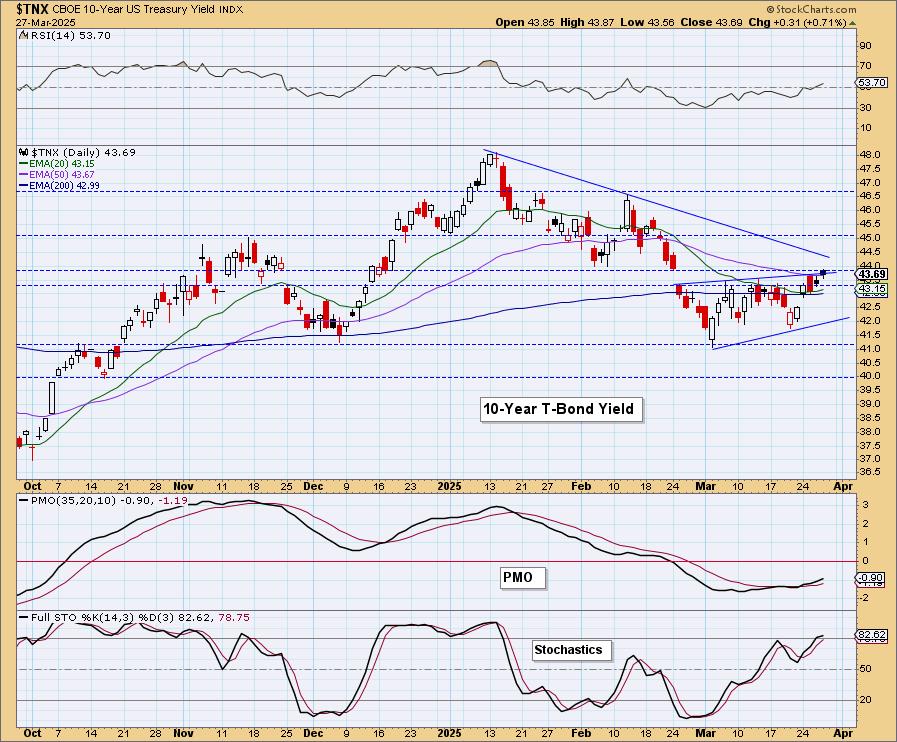
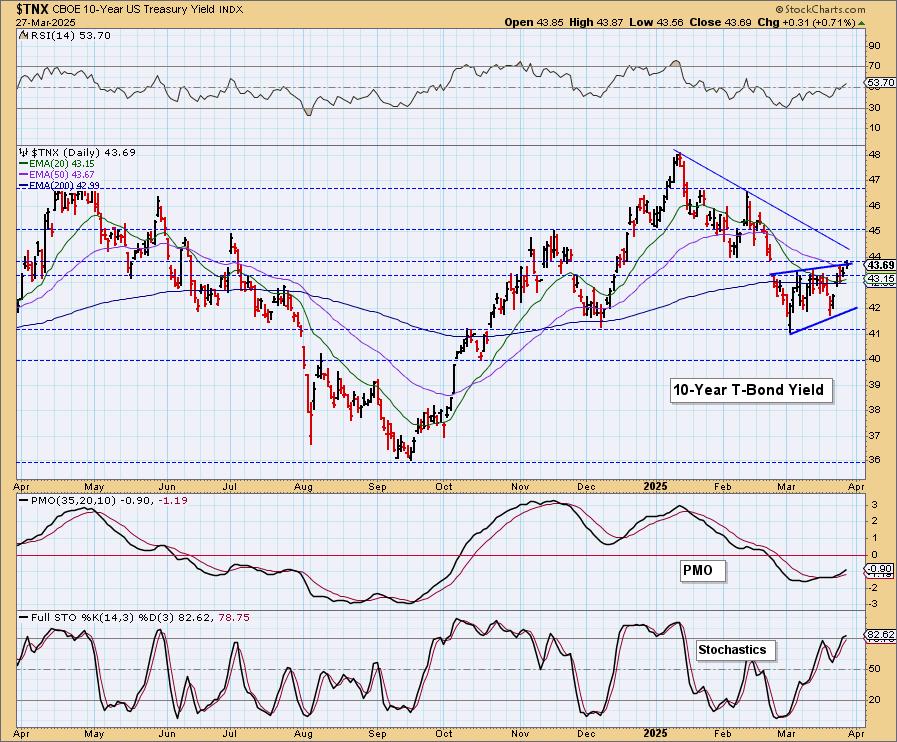
10-YEAR T-BOND YIELD
$TNX nearly broke out of the bearish rising wedge, but instead fell intraday to close right on the top of the pattern. We are expecting it to rise from here and take on the declining trend in spite of the wedge. The RSI just moved into positive territory and the PMO is rising on a Crossover BUY Signal. Stochastics are also above 80.
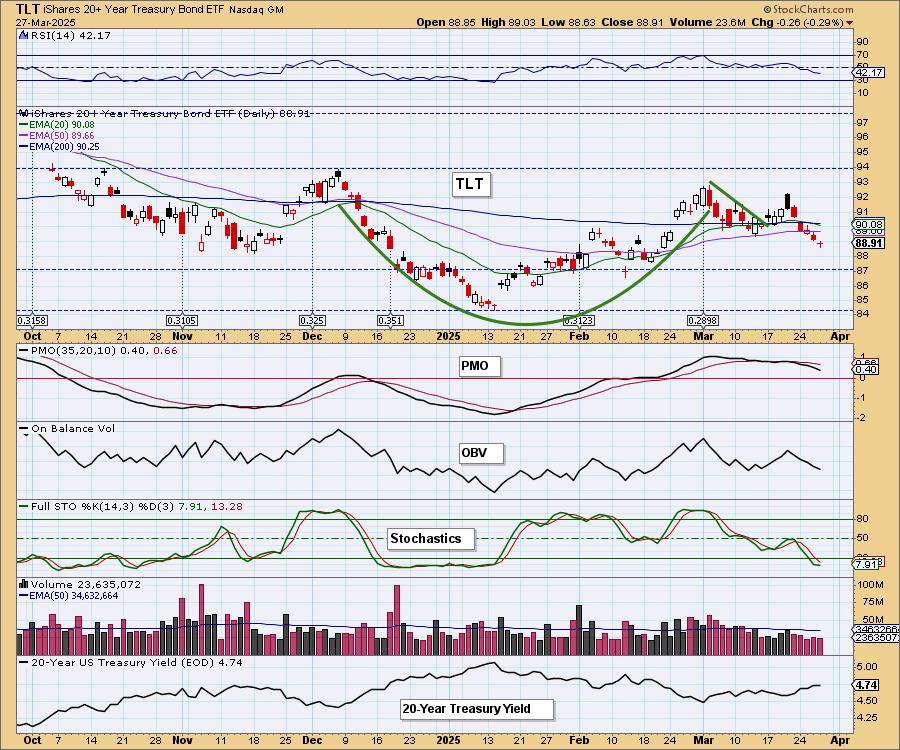
BONDS (TLT)
IT Trend Model: BUY as of 2/25/2025
LT Trend Model: SELL as of 12/13/2024
TLT Daily Chart: It appears that the handle on the bullish cup with handle pattern is being extended further. However, with yields looking very bullish and seeing a bearish double top within the handle, we wouldn't be surprised if the decline brings price down to the 87 level.
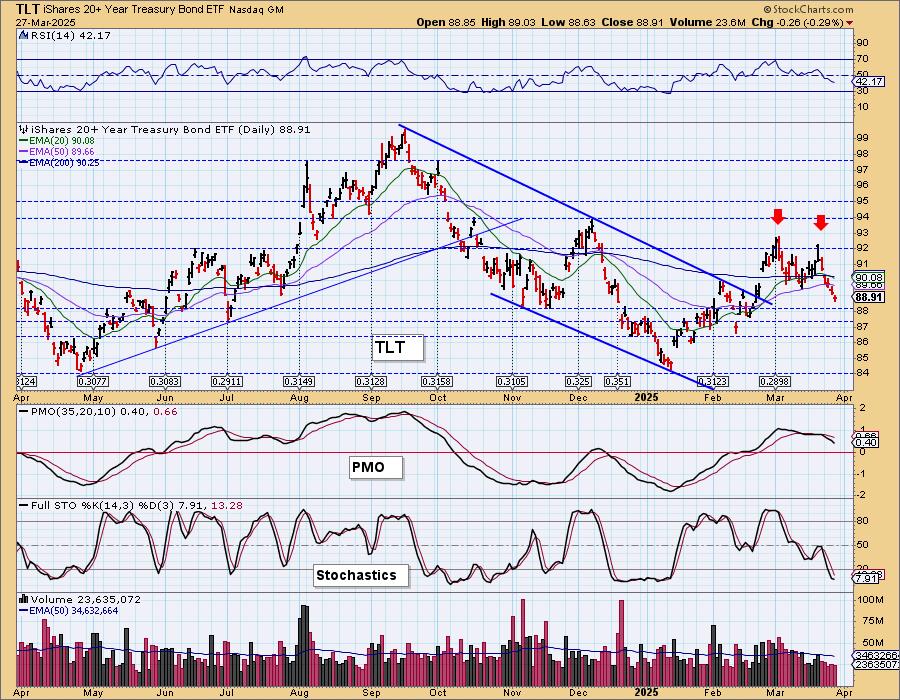
Here's the double top annotated. The RSI is negative and the PMO is in decline with Stochastics below 20. None of this supports higher prices here.
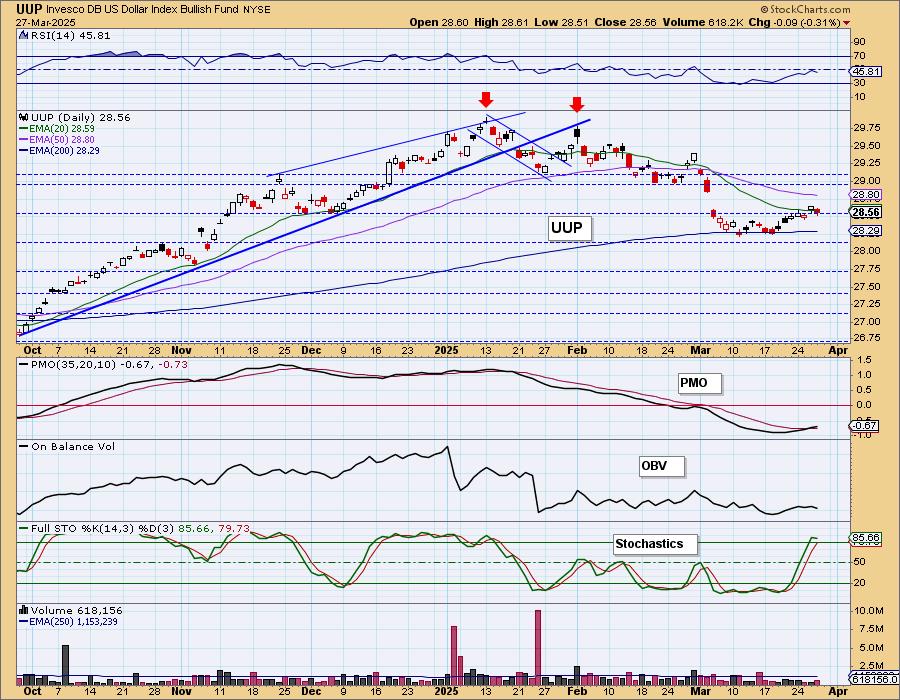
DOLLAR (UUP)
IT Trend Model: NEUTRAL as of 3/5/2025
LT Trend Model: BUY as of 5/25/2023
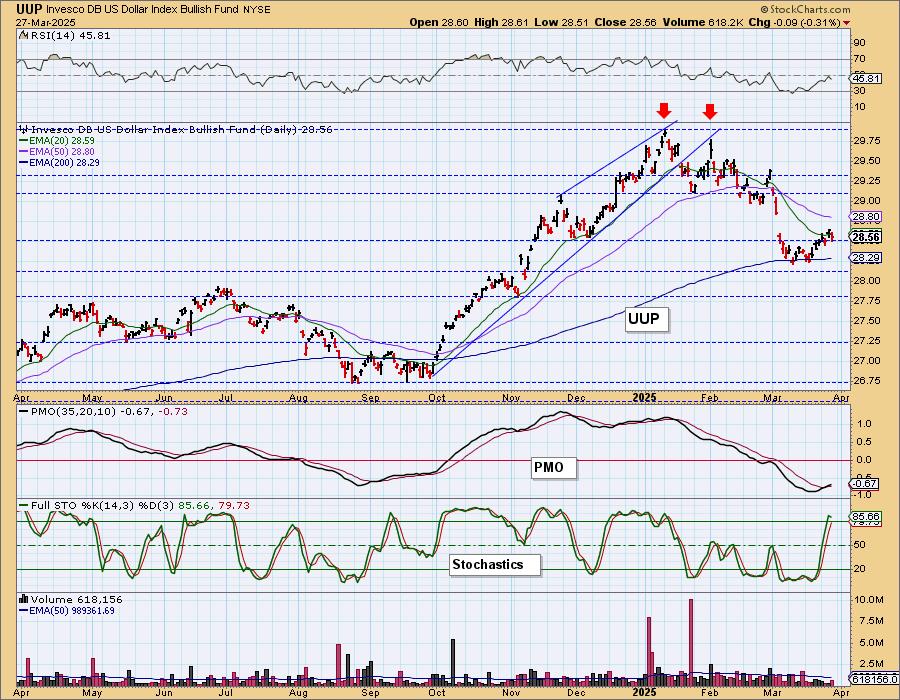
UUP Daily Chart: The Dollar was down slightly today, but we still see this as a positive bottoming formation. The RSI is still negative so we don't have a completely bullish setup here, but given the PMO is rising on a Crossover BUY Signal and Stochastics are above 80, we are looking for a little more rally here.
GOLD
IT Trend Model: BUY as of 1/10/2025
LT Trend Model: BUY as of 10/20/2023
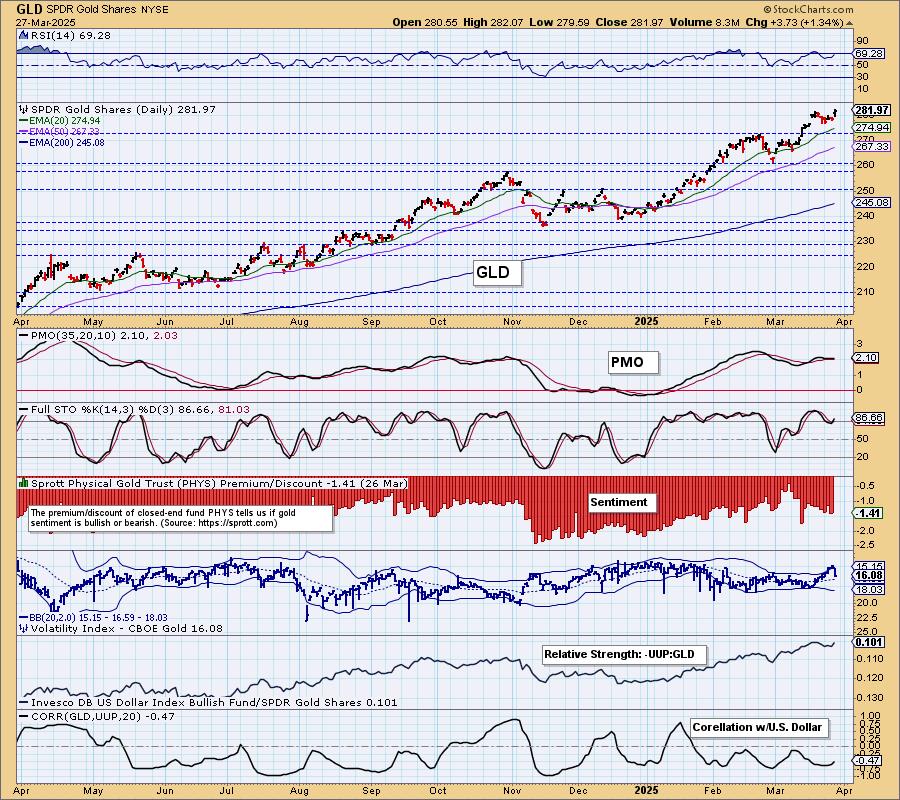
GLD Daily Chart: Gold won't quit! We saw another new all-time high logged today. This does look like a bullish flag formation. The PMO has surged above the signal line (bottom above the signal line) and Stochastics are rising above 80. The RSI is getting overbought and the Dollar does have some bullish indicators, but this sure looks good for more rally.
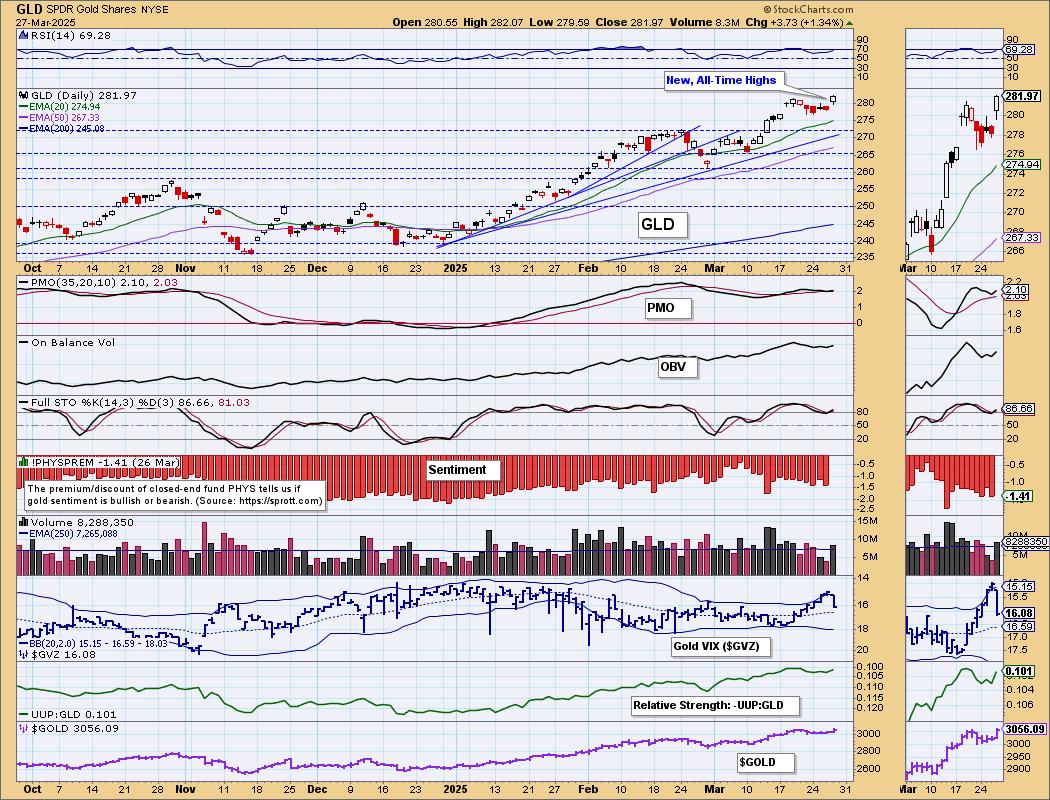
Relative strength against the Dollar is rising so we could see Gold continue to flourish even should the Dollar inch higher. The correlation is still negative though so a rise in the Dollar will still put some downside pressure on the metal.
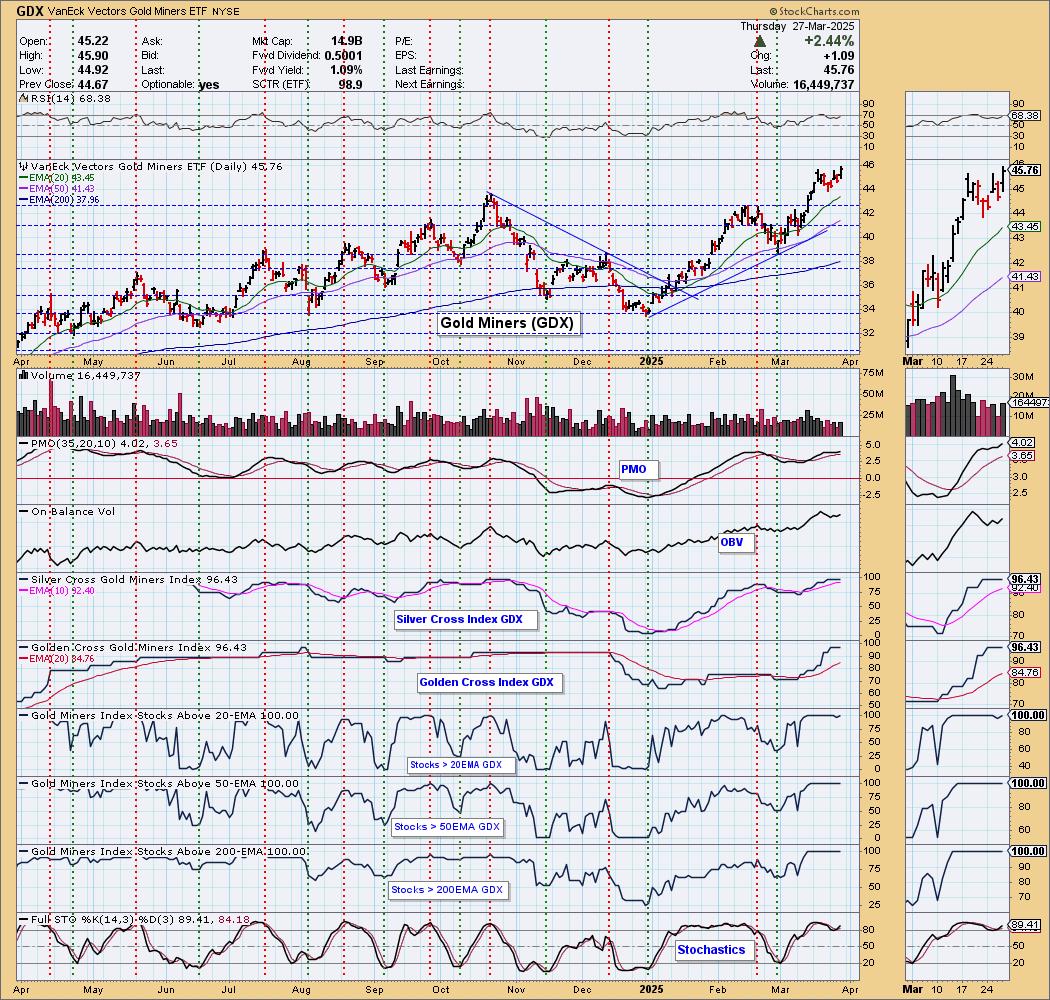
GOLD MINERS (GDX) Daily Chart: Gold Miners rallied strongly today alongside Gold. Like Gold, we see a bullish flag formation that could imply more upside ahead. Participation is incredibly strong and the Silver Cross Index is near 100%. It is getting overbought again, but with Gold making all-time highs again, we could see them rise even further. We have to wonder when we'll see a correction. They look awfully bullish right now.
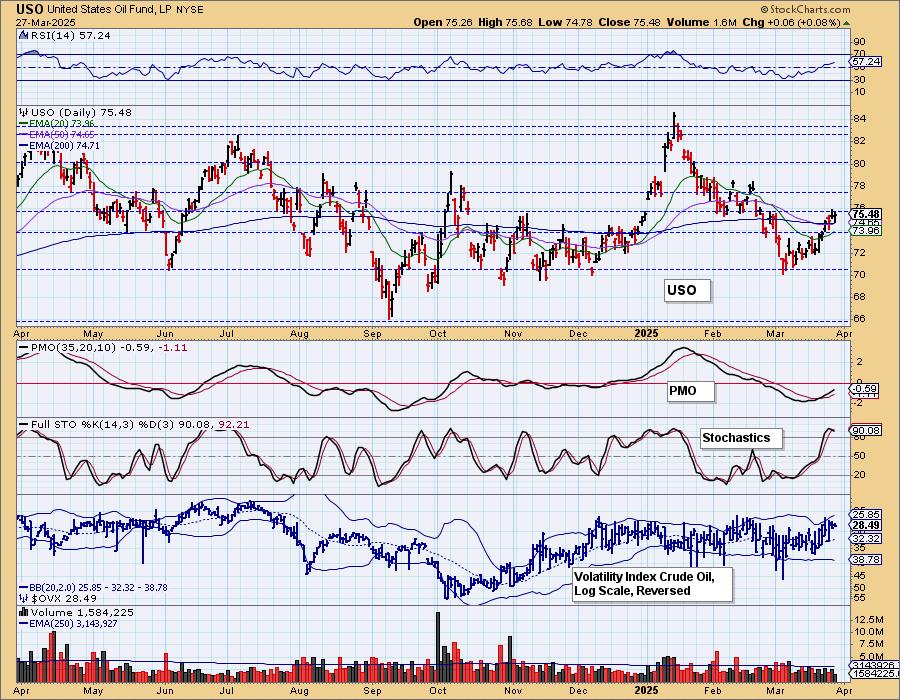
CRUDE OIL (USO)
IT Trend Model: NEUTRAL as of 2/27/2025
LT Trend Model: SELL as of 3/18/2025
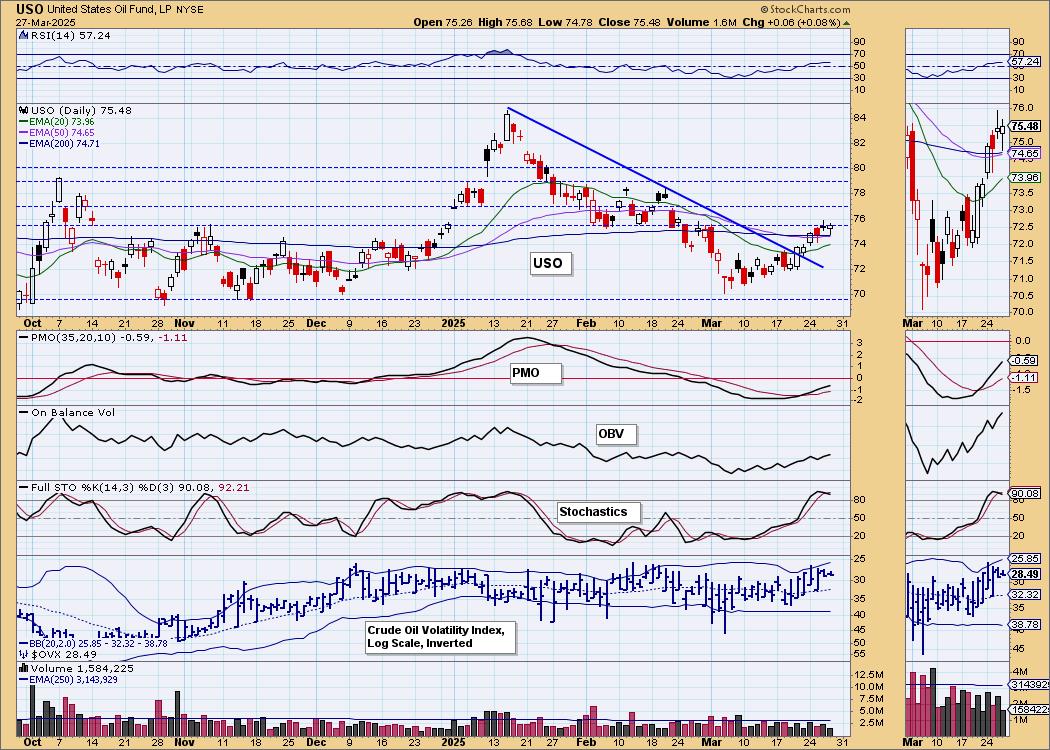
USO Daily Chart: Crude Oil hit overhead resistance and was unable to get above it today. It does look like we will get that breakout given positive indicators. The PMO is rising toward the zero line and Stochastics are above 80. At this point we'll look for more rally.
Good Luck & Good Trading!
Erin Swenlin and Carl Swenlin
Technical Analysis is a windsock, not a crystal ball. --Carl Swenlin
(c) Copyright 2025 DecisionPoint.com
Disclaimer: This blog is for educational purposes only and should not be construed as financial advice. The ideas and strategies should never be used without first assessing your own personal and financial situation, or without consulting a financial professional. Any opinions expressed herein are solely those of the author, and do not in any way represent the views or opinions of any other person or entity.
DecisionPoint is not a registered investment advisor. Investment and trading decisions are solely your responsibility. DecisionPoint newsletters, blogs or website materials should NOT be interpreted as a recommendation or solicitation to buy or sell any security or to take any specific action.
NOTE: The signal status reported herein is based upon mechanical trading model signals, specifically, the DecisionPoint Trend Model. They define the implied bias of the price index based upon moving average relationships, but they do not necessarily call for a specific action. They are information flags that should prompt chart review. Further, they do not call for continuous buying or selling during the life of the signal. For example, a BUY signal will probably (but not necessarily) return the best results if action is taken soon after the signal is generated. Additional opportunities for buying may be found as price zigzags higher, but the trader must look for optimum entry points. Conversely, exit points to preserve gains (or minimize losses) may be evident before the model mechanically closes the signal.
Helpful DecisionPoint Links:
DecisionPoint Alert Chart List
DecisionPoint Golden Cross/Silver Cross Index Chart List
DecisionPoint Sector Chart List
Price Momentum Oscillator (PMO)