
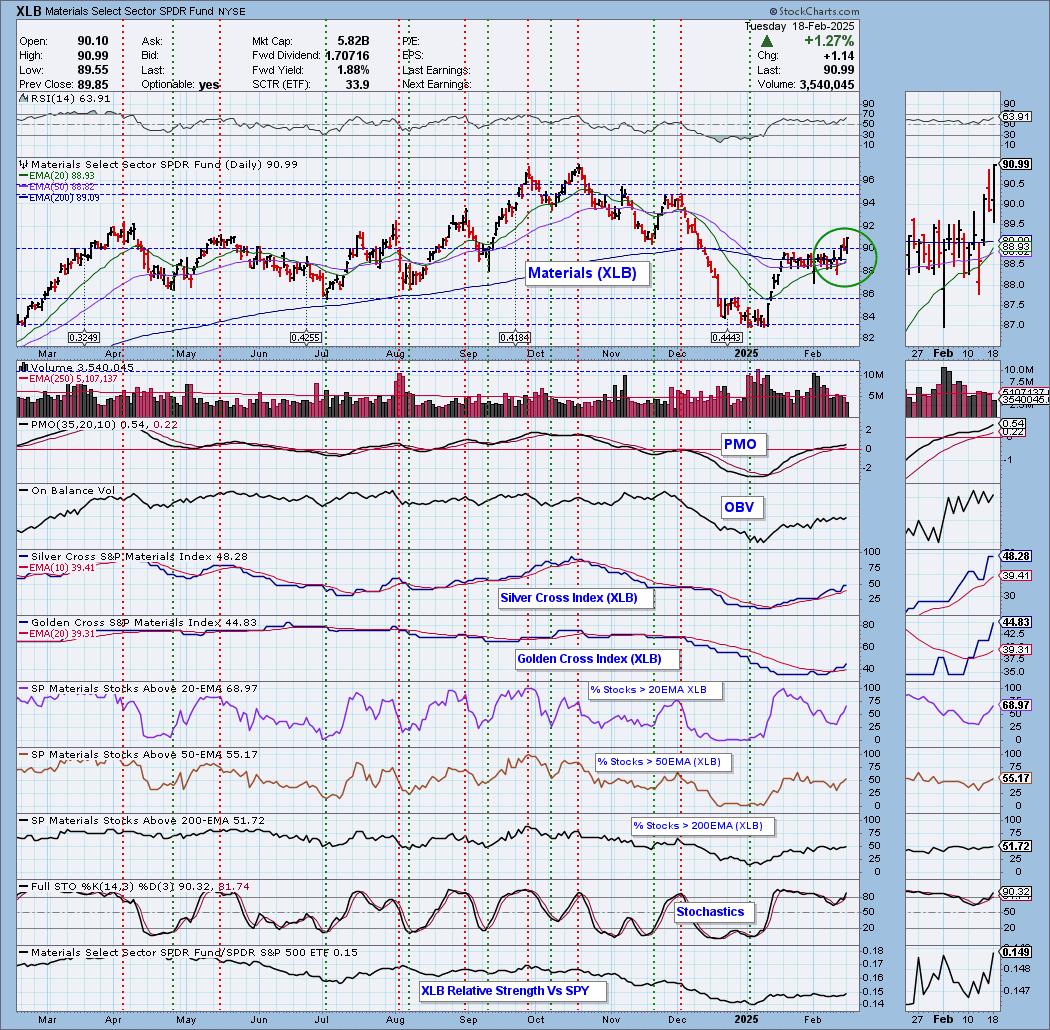
Today the Materials Sector ETF (XLB) 20-day EMA crossed up through the 50-day EMA (Silver Cross), generating an IT Trend Model BUY Signal. We have a nice breakout from a congested trading range. We are seeing excellent gains in participation and both the Golden and Silver Cross Indexes are above their signal lines. Stochastics look encouraging as well.
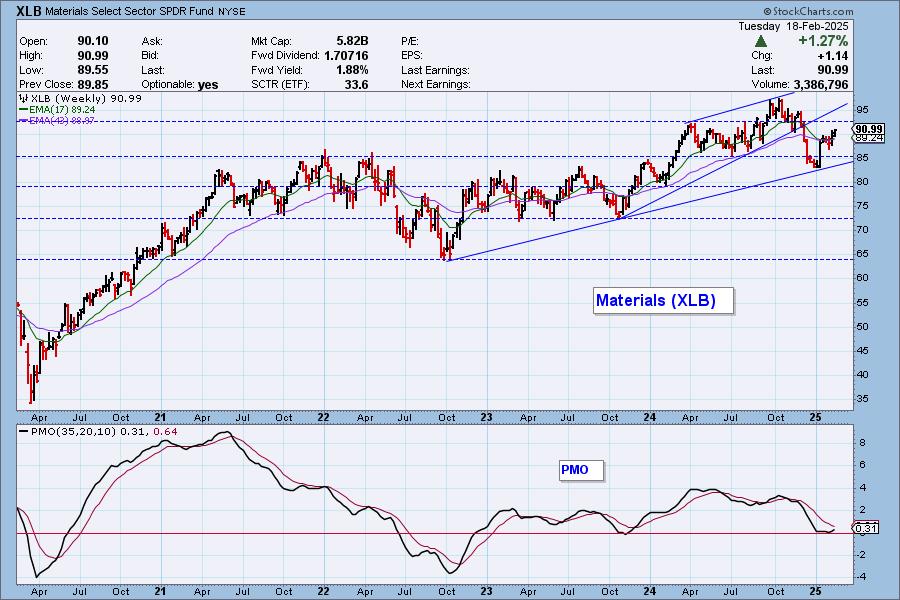
Price broke down from a bearish rising wedge and has now recaptured the prior rising trend. The weekly PMO is rising.
The DecisionPoint Alert Weekly Wrap presents an end-of-week assessment of the trend and condition of the Stock Market, the U.S. Dollar, Gold, Crude Oil, and Bonds. The DecisionPoint Alert daily report (Monday through Thursday) is abbreviated and gives updates on the Weekly Wrap assessments.
Watch the latest episode of DecisionPoint on our YouTube channel here!
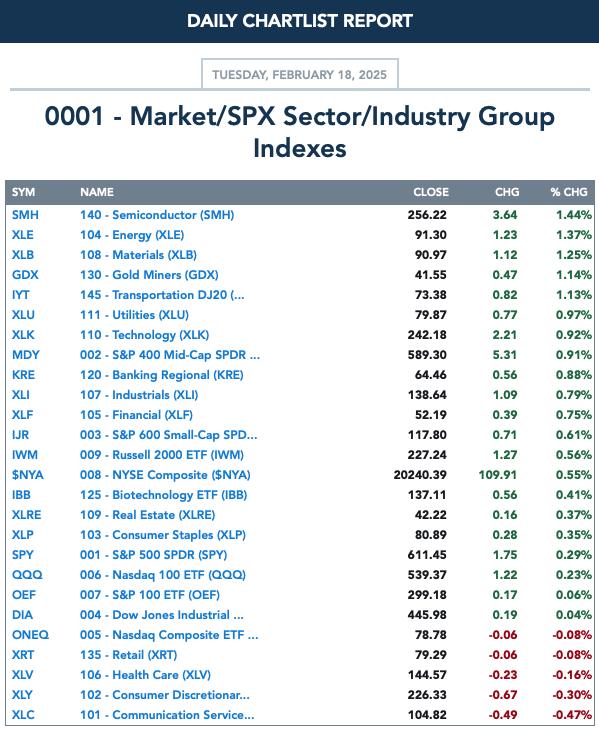
MARKET/INDUSTRY GROUP/SECTOR INDEXES
CLICK HERE for Carl's annotated Market Index, Sector, and Industry Group charts.
THE MARKET (S&P 500)
IT Trend Model: BUY as of 8/14/2024
LT Trend Model: BUY as of 3/29/2023
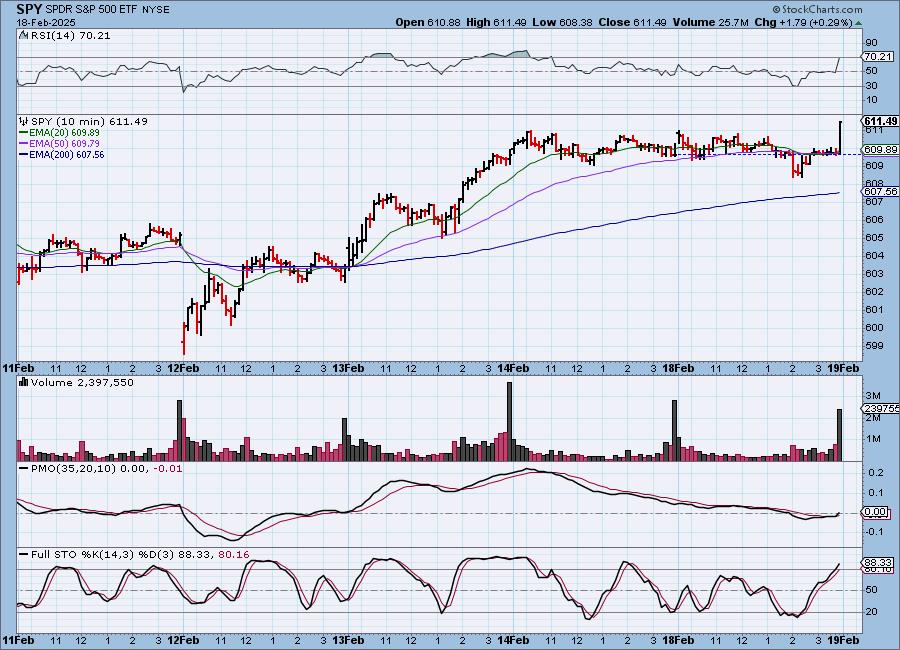
SPY 10-Minute Chart: Price didn't go anywhere but sideways with a hiccup after lunch. Interestingly there was a flurry of buying to end trading today. This pushed the 10-minute PMO higher.
SPY Daily Chart: A new all-time high was set today as price continues to make its way out of the prior declining trend. The RSI looks healthy in positive territory and not overbought. The PMO is still rising.
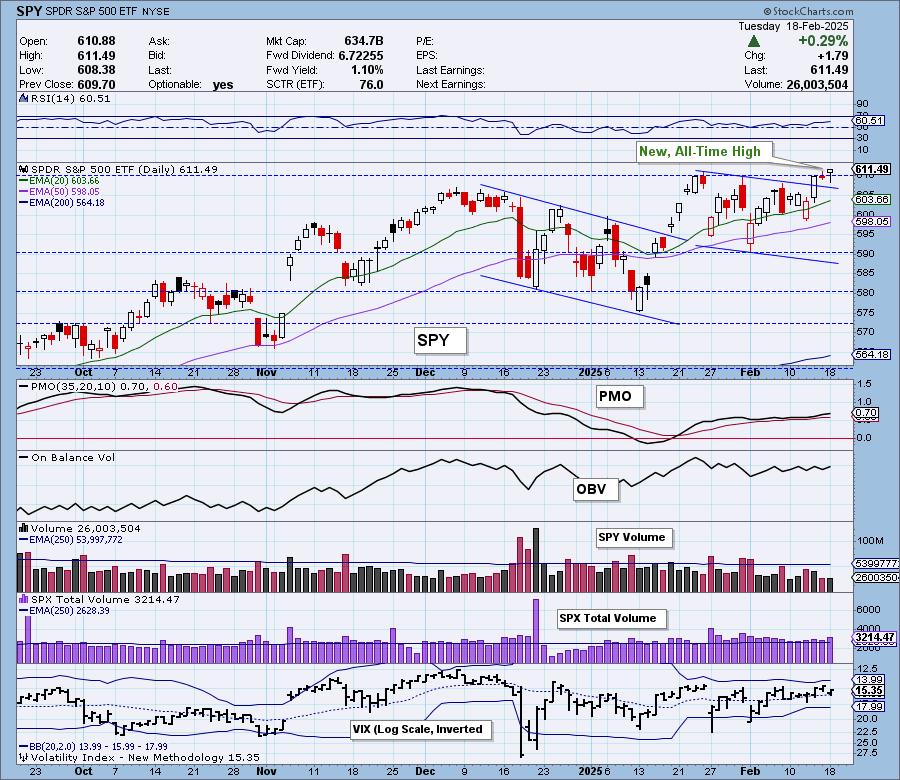
Volatility continues to be absent as the VIX Bollinger Bands continue to contract. Stochastics look very bullish rising above 80. We noticed today that the relative strength line to equal-weight RSP topped suggesting some weakness may be entering for mega-caps.

Here is the latest recording from 2/10 (No trading room 2/17). Click HERE to get to our video list.:
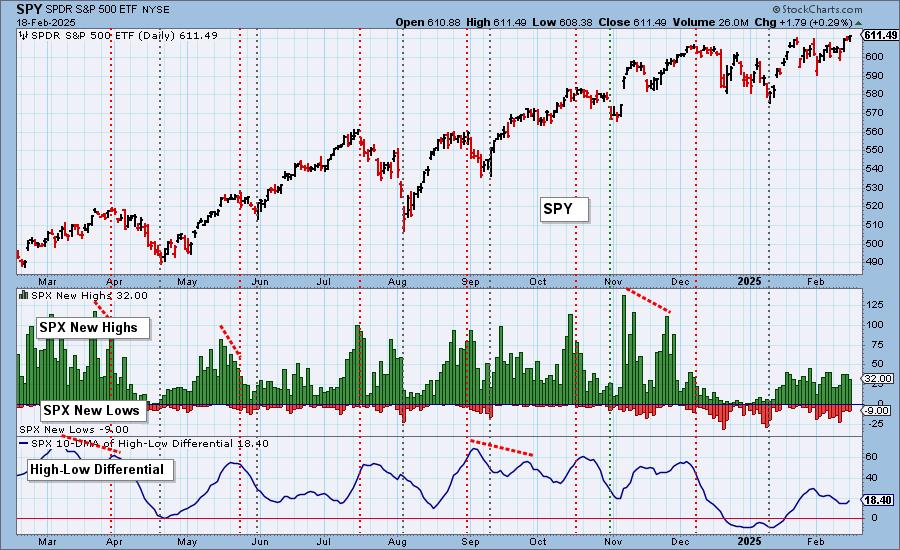
S&P 500 New 52-Week Highs/Lows: New Highs contracted on the rally and we did see an expansion of New Lows. Fortunately, the High-Low Differential is rising now.
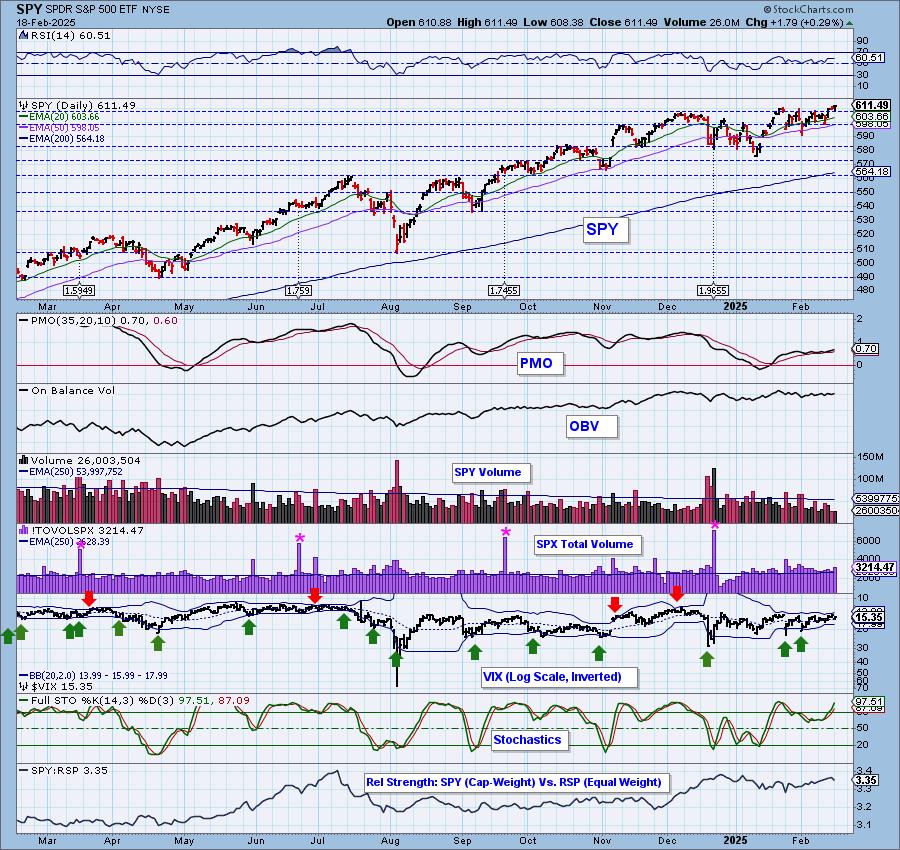
Climax* Analysis: There were two climax readings on the four relevant indicators, and SPX Total Volume was solidly above the one-year daily average volume, so we have an upside exhaustion climax. With the market slightly above the previous all-time highs, it is a bad time for exhaustion.
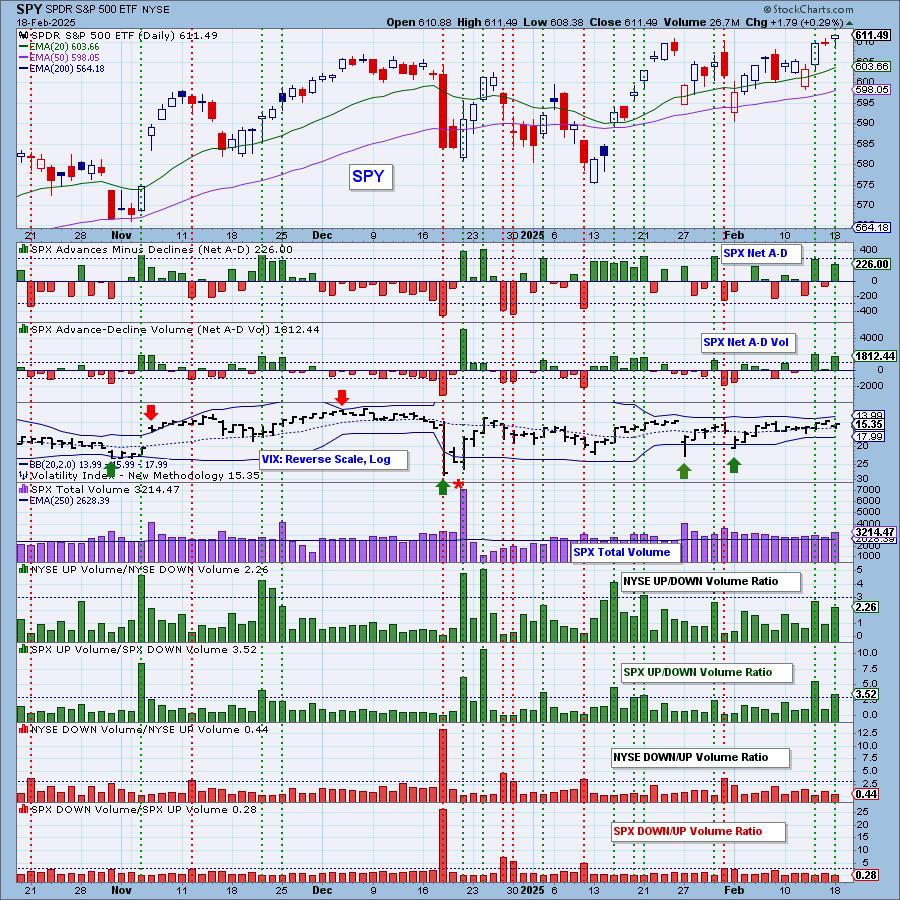
*A climax is a one-day event when market action generates very high readings in, primarily, breadth and volume indicators. We also include the VIX, watching for it to penetrate outside the Bollinger Band envelope. The vertical dotted lines mark climax days -- red for downside climaxes, and green for upside. Climaxes are at their core exhaustion events; however, at price pivots they may be initiating a change of trend.
Short-Term Market Indicators: The short-term market trend is UP and the condition is NEUTRAL.
The Swenlin Trading Oscillators (STOs) are both rising. The STO-B looks a bit healthier above the zero line. We are seeing a slight expansion in participation that does seem to be breaking from its current declining trend. We now have 60% of stocks showing rising momentum.
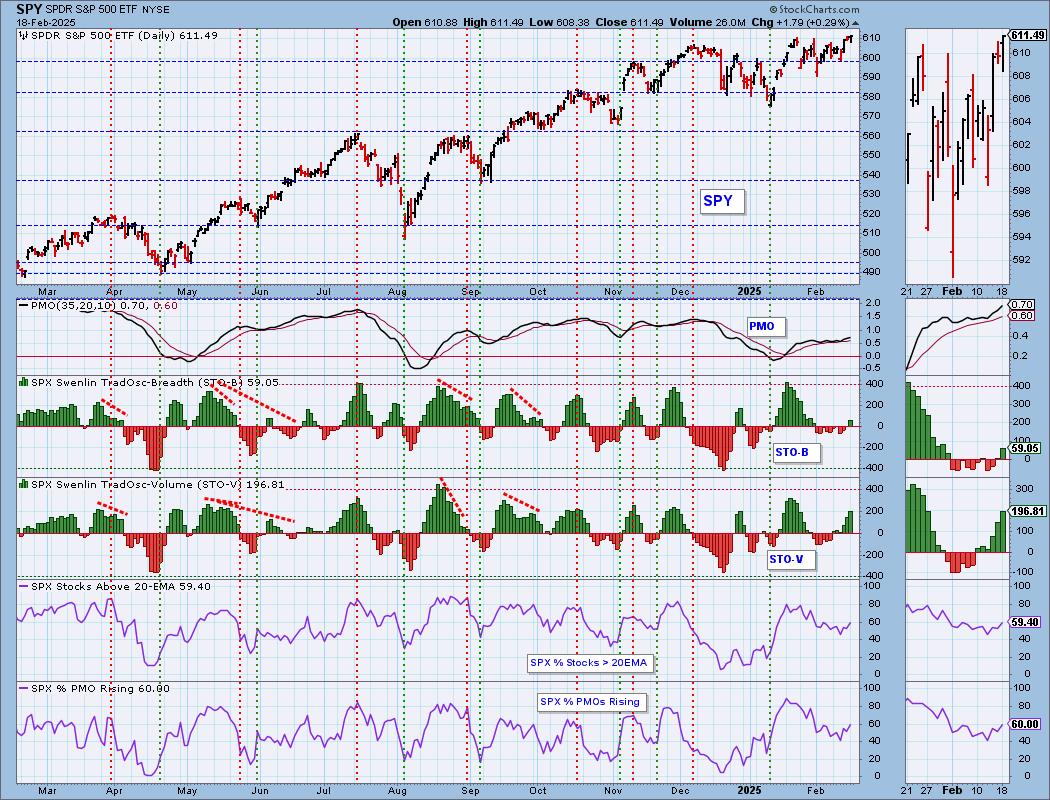
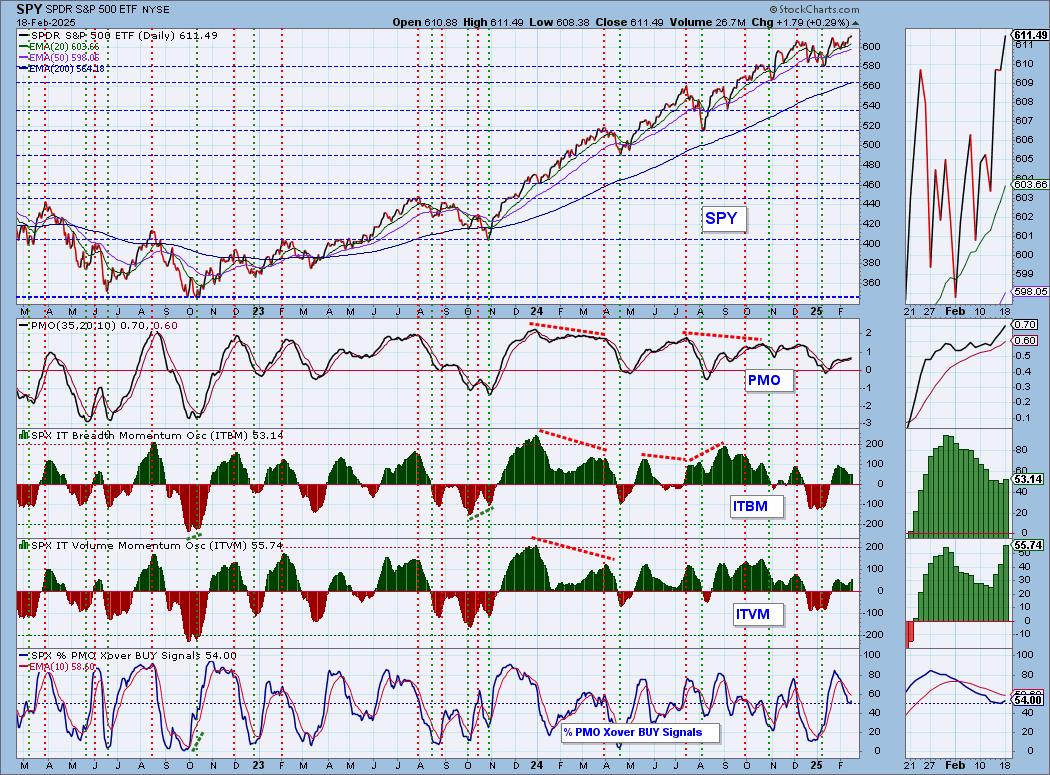
Intermediate-Term Market Indicators: The intermediate-term market trend is UP and the condition is NEUTRAL.
The ITBM and ITVM are now rising in concert and do confirm the rising STOs. We also saw %PMO Xover BUY Signals reverse higher.
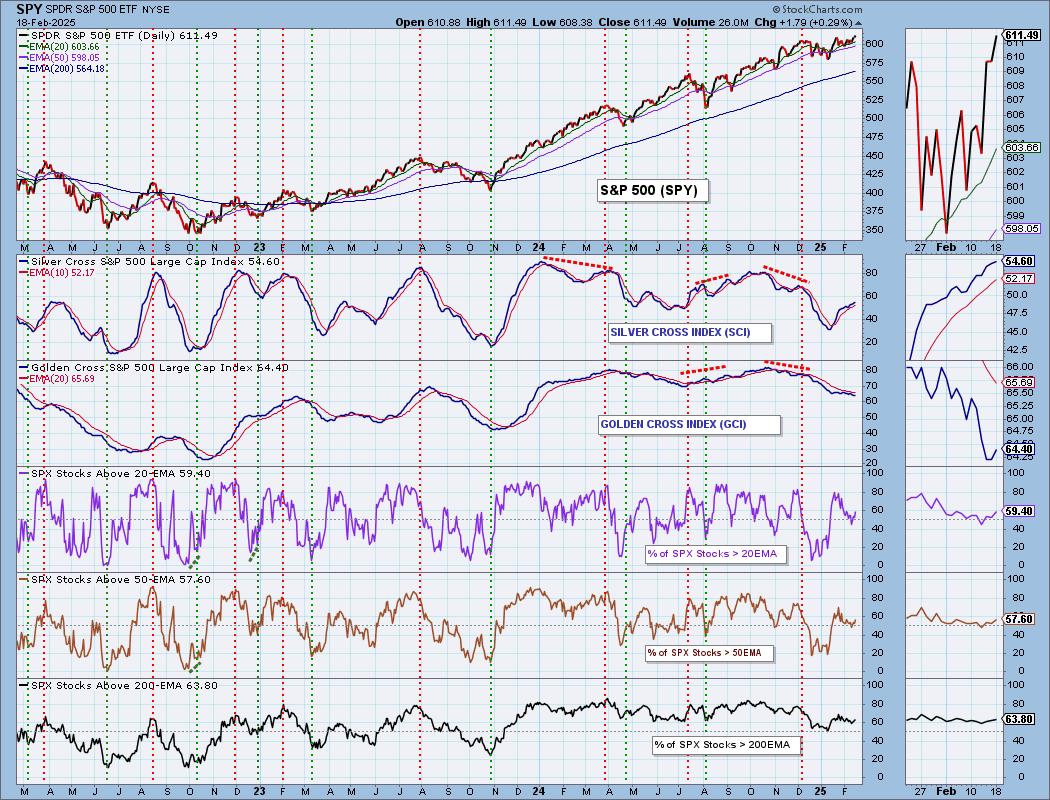
PARTICIPATION CHART (S&P 500): The following chart objectively shows the depth and trend of participation for the SPX in two time frames.
- Intermediate-Term - the Silver Cross Index (SCI) shows the percentage of SPX stocks on IT Trend Model BUY signals (20-EMA > 50-EMA). The opposite of the Silver Cross is a "Dark Cross" -- those stocks are, at the very least, in a correction.
- Long-Term - the Golden Cross Index (GCI) shows the percentage of SPX stocks on LT Trend Model BUY signals (50-EMA > 200-EMA). The opposite of a Golden Cross is the "Death Cross" -- those stocks are in a bear market.
The market bias is BULLISH in the intermediate term.
The market bias is BEARISH in the long term.
Participation is inching higher and is beginning to see declining trends slow dissipate. The Silver Cross Index is above its signal line so the IT Bias is still BULLISH. The Golden Cross Index did turn back up, but until we get more stocks above their 200-day EMA, it is vulnerable to a downturn. It is below its signal line so the LT Bias is BEARISH.
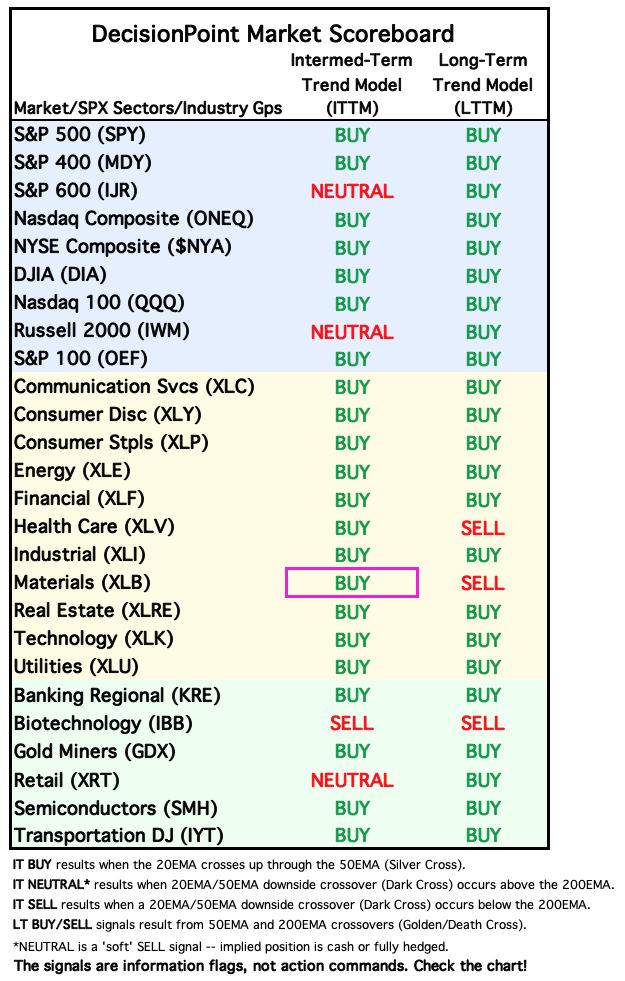
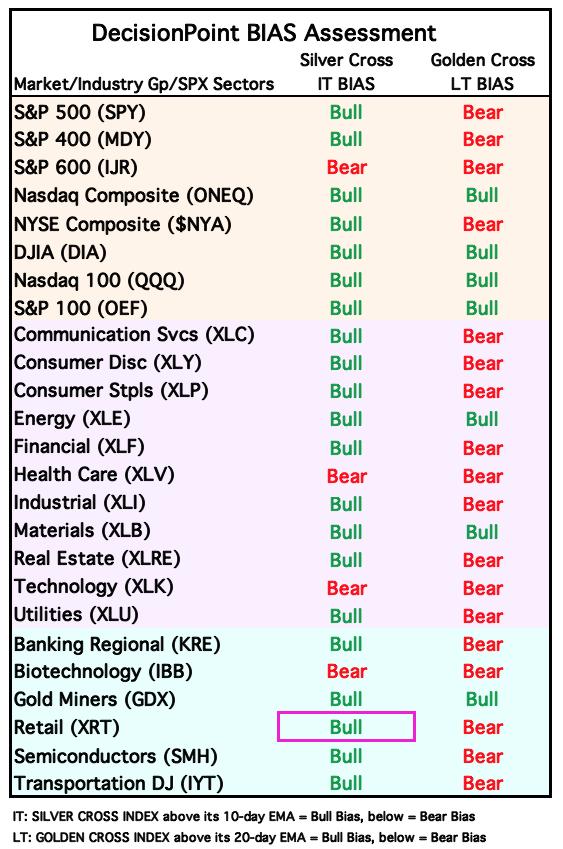
BIAS Assessment: The following table expresses the current BIAS of various price indexes based upon the relationship of the Silver Cross Index to its 10-day EMA (intermediate-term), and of the Golden Cross Index to its 20-day EMA (long-term). When the Index is above the EMA it is bullish, and it is bearish when the Index is below the EMA. The BIAS does not imply that any particular action should be taken. It is information to be used in the decision process.
The items with highlighted borders indicate that the BIAS changed today.
*****************************************************************************************************
CONCLUSION: Indicators in general are going in the right direction. We're seeing some expansion on participation that is beginning to take out prior declining trends. The market is incredibly overvalued and overdue for a decline, but we have to consider rising STOs and rising participation. This is not a bad set up, but mega-caps could be seeing some weakness based on the topping relative strength line to equal-weight RSP. The upside exhaustion climax is the big problem. We've had a good rally going out of the last low and this climax suggests it is likely exhausted. The market is at all-time highs and this is where we saw failure before. We would stay cautious until we see what happens with this climax.
Erin is 15% long, 0% short. (This is intended as information, not a recommendation.)
*****************************************************************************************************
CALENDAR

Have you subscribed the DecisionPoint Diamonds yet? DP does the work for you by providing handpicked stocks/ETFs from exclusive DP scans! Add it with a discount! Contact support@decisionpoint.com for more information!
BITCOIN
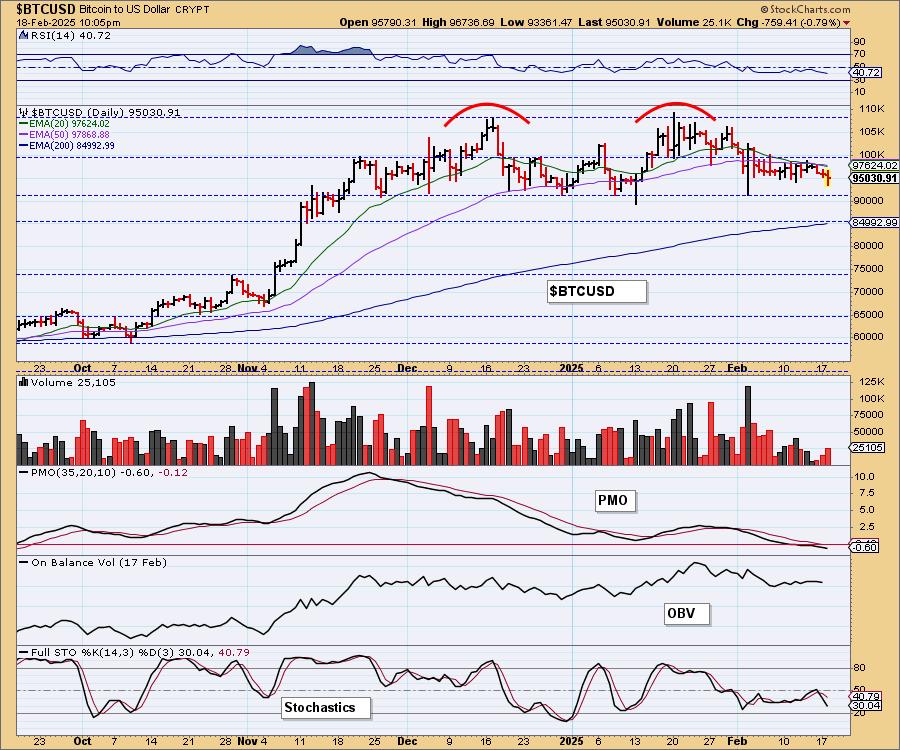
The double top on Bitcoin is a problem particularly given we are in a declining trend that started at that second top. The confirmation line of the pattern will likely be tested soon and based on the declining PMO and Stochastics (as well as a negative RSI), it is likely to see a breakdown at around 90,000.
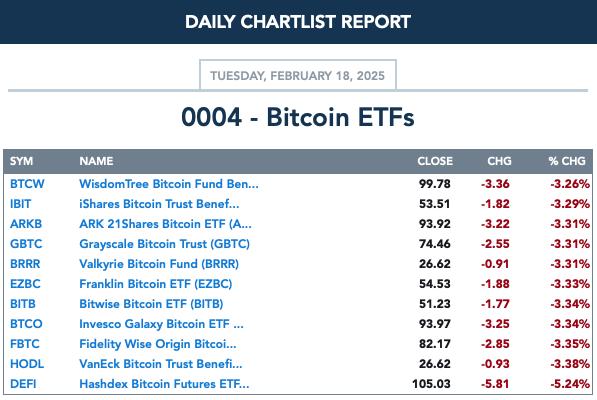
BITCOIN ETFs
INTEREST RATES
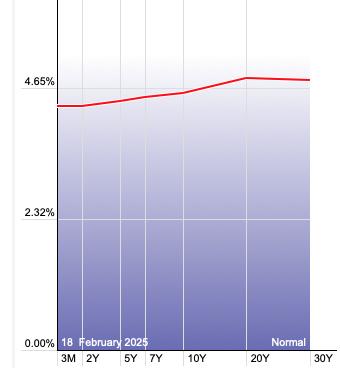
Yields rose today, but most remain in declining trends so we aren't looking for much followthrough.
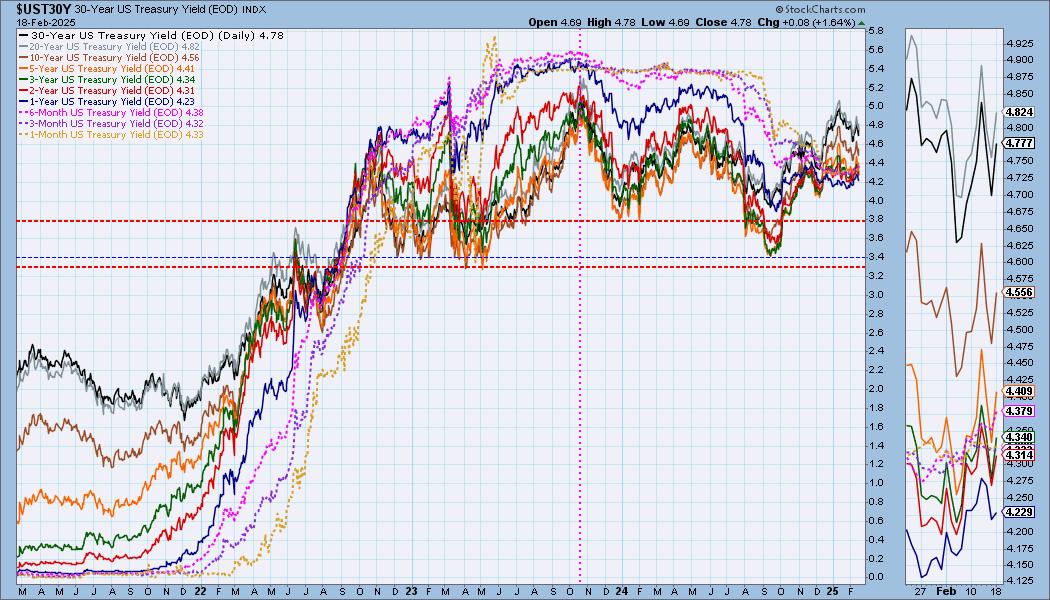
The Yield Curve Chart from StockCharts.com shows us the inversions taking place. The red line should move higher from left to right. Inversions are occurring where it moves downward.
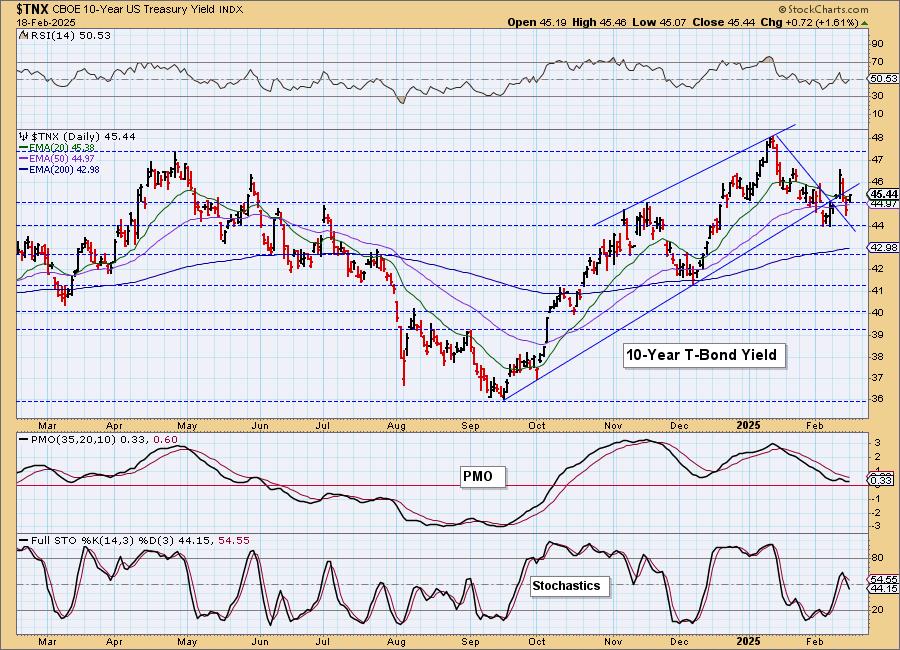
10-YEAR T-BOND YIELD
The declining trend was broken on $TNX, but it has essentially stalled. Support is holding, but given the drop in Stochastics and the PMO top beneath the signal line, we are going to look for it to move lower or continue bouncing around sideways.
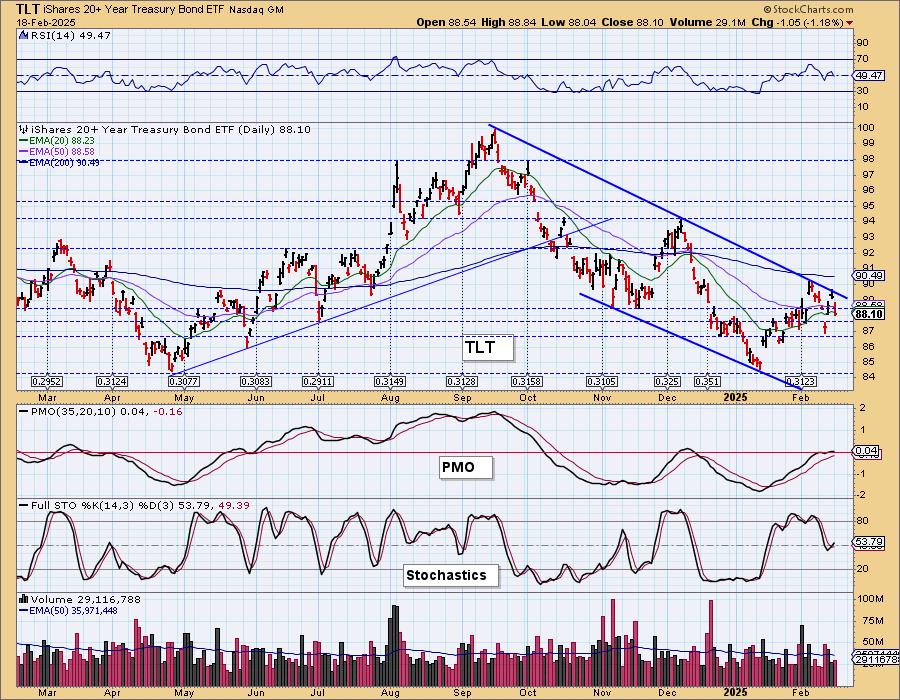
BONDS (TLT)
IT Trend Model: NEUTRAL as of 11/10/2024
LT Trend Model: SELL as of 12/13/2024
TLT Daily Chart: TLT is forming a small double top formation, but Stochastics are rising. The PMO did top. We aren't bullish on yields right now, but neither are we decidedly bearish. We sense that both yields and Bonds are in for sideways consolidation or chop.

The large declining trend channel does put a negative spin on Bonds right now.
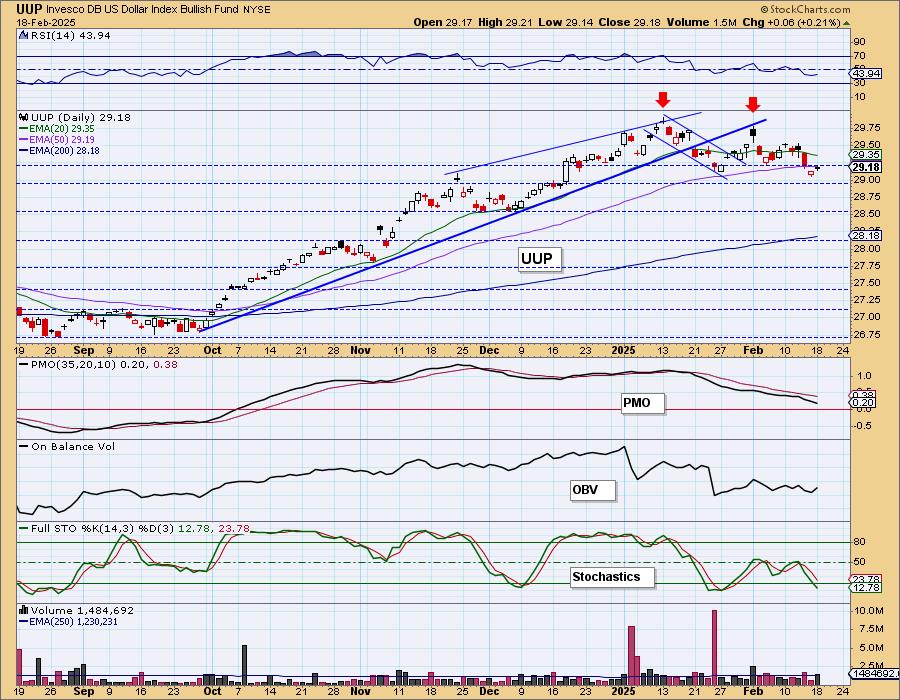
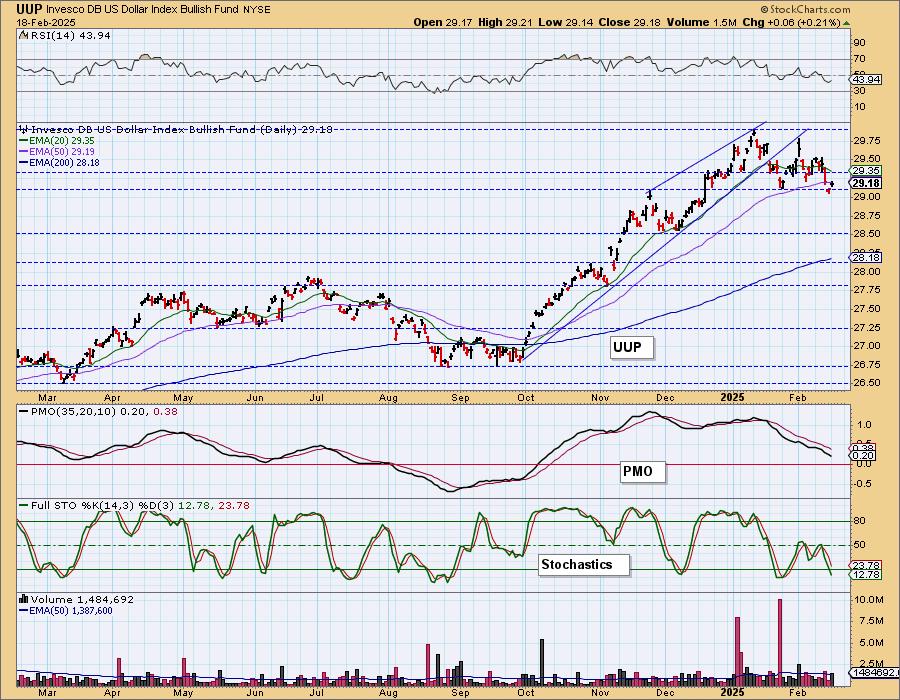
DOLLAR (UUP)
IT Trend Model: BUY as of 10/9/2024
LT Trend Model: BUY as of 5/25/2023
UUP Daily Chart: We are monitoring a bearish double top on the Dollar that does suggest we will see more weakness. The PMO is in decline and Stochastics dropped below 20 implying internal weakness. We expect lower prices for the Dollar.
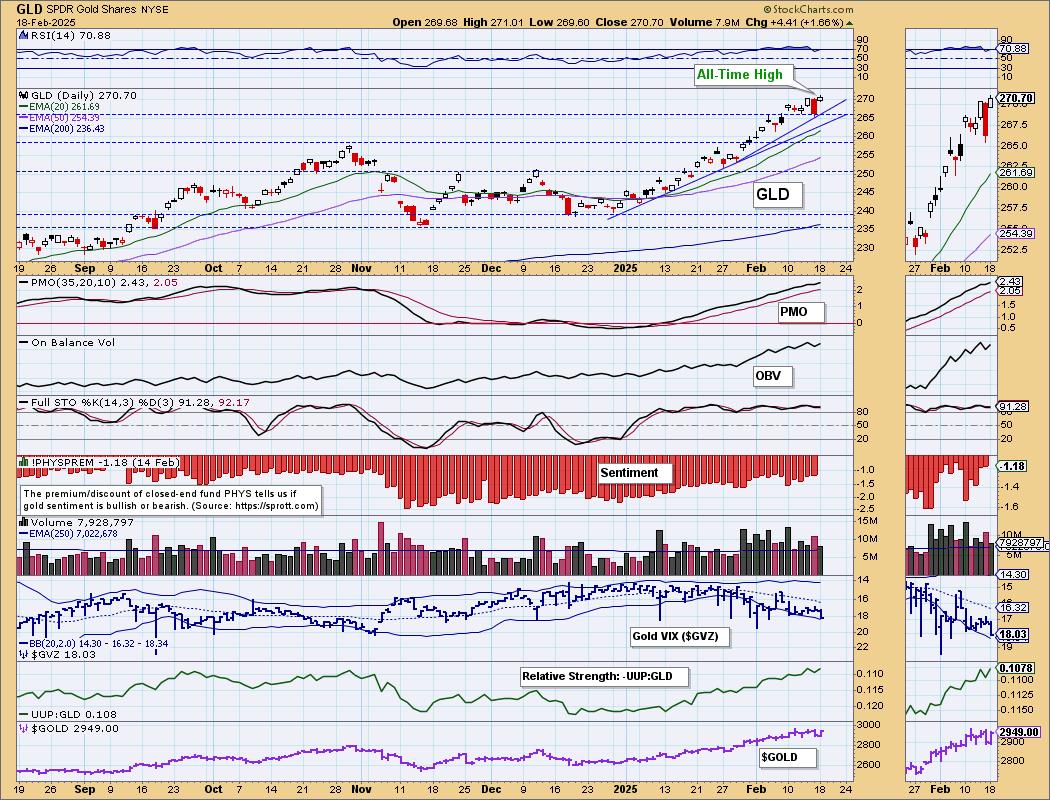
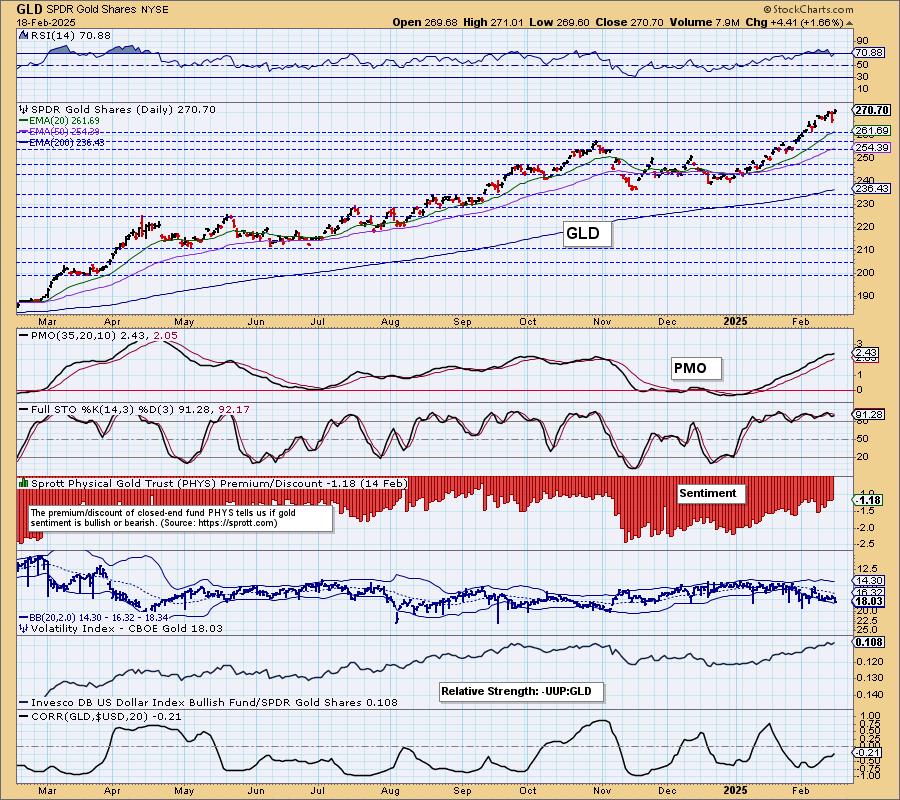
GOLD
IT Trend Model: BUY as of 1/10/2025
LT Trend Model: BUY as of 10/20/2023
GLD Daily Chart: Despite a rally in the Dollar today, Gold rallied strongly setting yet another all-time high. A weak Dollar will be good for Gold and it is already seeing plenty of buyers. The RSI is overbought again so we are due for another pause or possible decline, but overall we would expect more good things out of Gold.
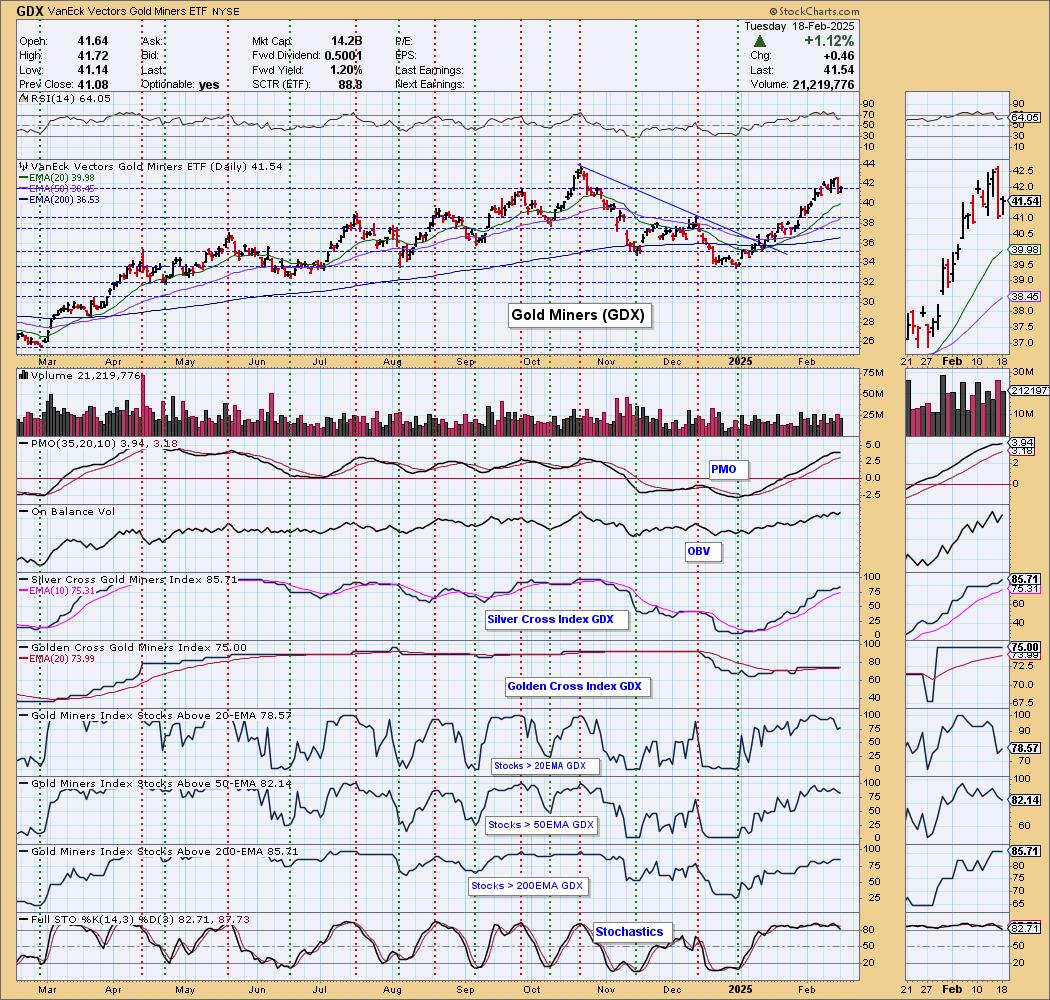
GOLD MINERS (GDX) Daily Chart: We're sensing some exhaustion in Gold Miners. Generally they rally more than Gold and Gold was up higher today than GDX. Participation while strong is seeing some leakage. It will be hard to keep them down if Gold continues to rally, but they do look ready for some consolidation to continue. We'd like to see some decline for an opportune entry.
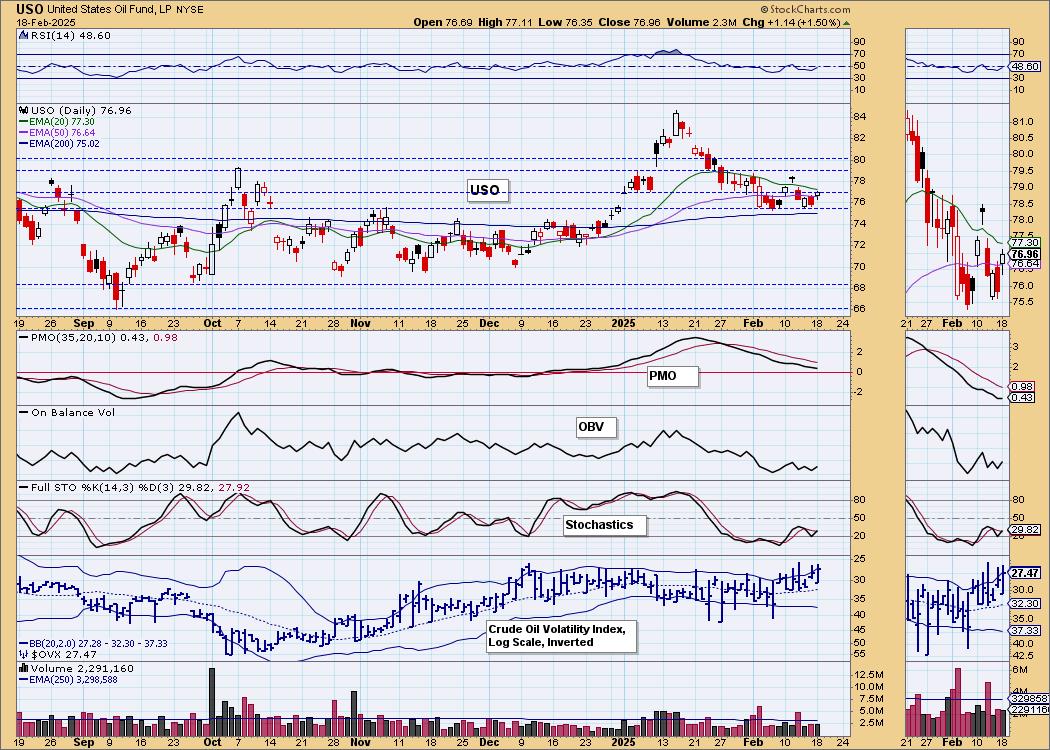
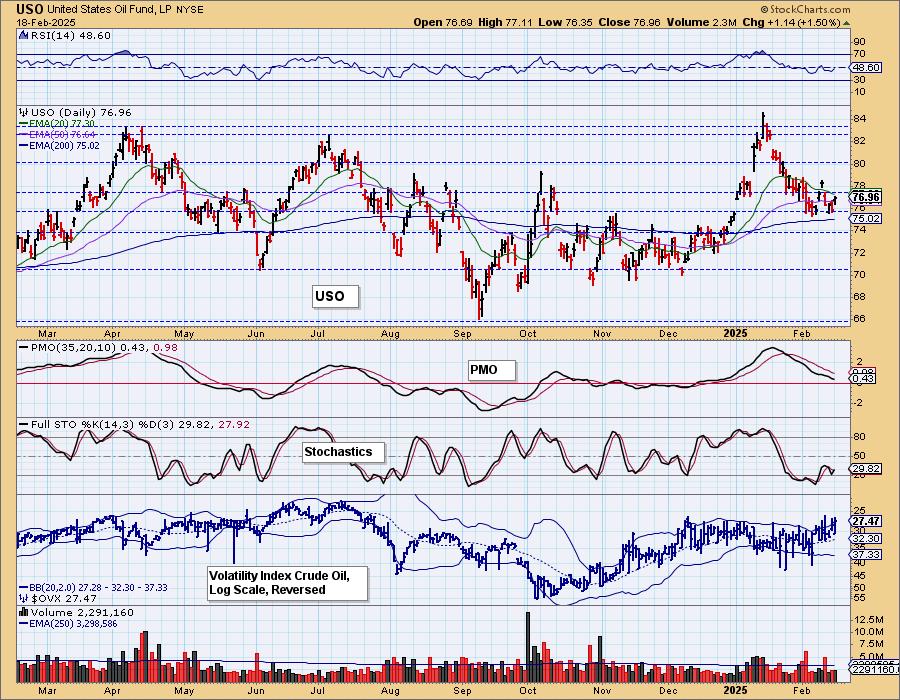
CRUDE OIL (USO)
IT Trend Model: BUY as of 12/24/2024
LT Trend Model: BUY as of 1/10/2025
USO Daily Chart: We have a double bottom forming on USO in the short term, but we aren't expecting a huge rally primarily due to weak indicators. The RSI is negative still and the PMO is still in decline. Stochastics did tick up so we'll look for a bit more upside for now. Support does seem sturdy at the 200-day EMA and November high.
Good Luck & Good Trading!
Erin Swenlin and Carl Swenlin
Technical Analysis is a windsock, not a crystal ball. --Carl Swenlin
(c) Copyright 2025 DecisionPoint.com
Disclaimer: This blog is for educational purposes only and should not be construed as financial advice. The ideas and strategies should never be used without first assessing your own personal and financial situation, or without consulting a financial professional. Any opinions expressed herein are solely those of the author, and do not in any way represent the views or opinions of any other person or entity.
DecisionPoint is not a registered investment advisor. Investment and trading decisions are solely your responsibility. DecisionPoint newsletters, blogs or website materials should NOT be interpreted as a recommendation or solicitation to buy or sell any security or to take any specific action.
NOTE: The signal status reported herein is based upon mechanical trading model signals, specifically, the DecisionPoint Trend Model. They define the implied bias of the price index based upon moving average relationships, but they do not necessarily call for a specific action. They are information flags that should prompt chart review. Further, they do not call for continuous buying or selling during the life of the signal. For example, a BUY signal will probably (but not necessarily) return the best results if action is taken soon after the signal is generated. Additional opportunities for buying may be found as price zigzags higher, but the trader must look for optimum entry points. Conversely, exit points to preserve gains (or minimize losses) may be evident before the model mechanically closes the signal.
Helpful DecisionPoint Links:
DecisionPoint Alert Chart List
DecisionPoint Golden Cross/Silver Cross Index Chart List
DecisionPoint Sector Chart List
Price Momentum Oscillator (PMO)