
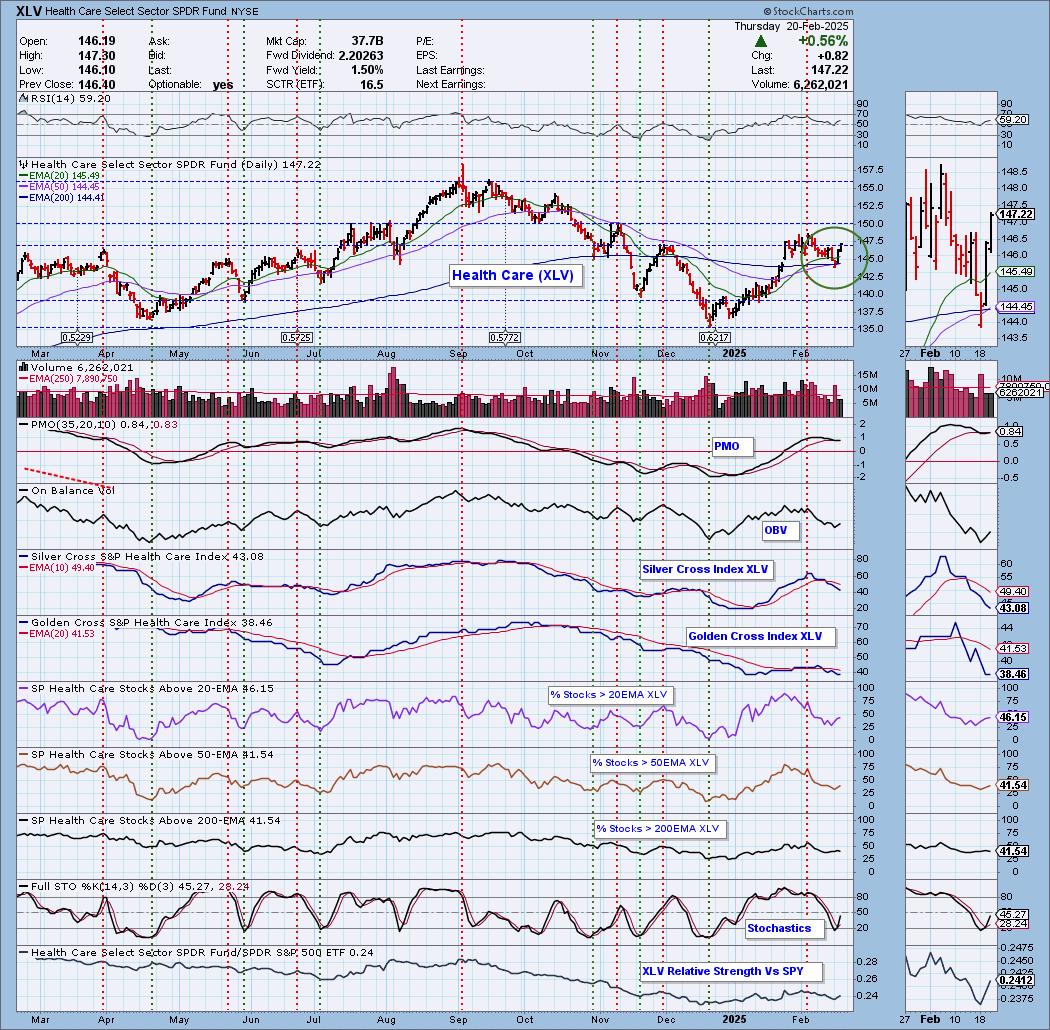
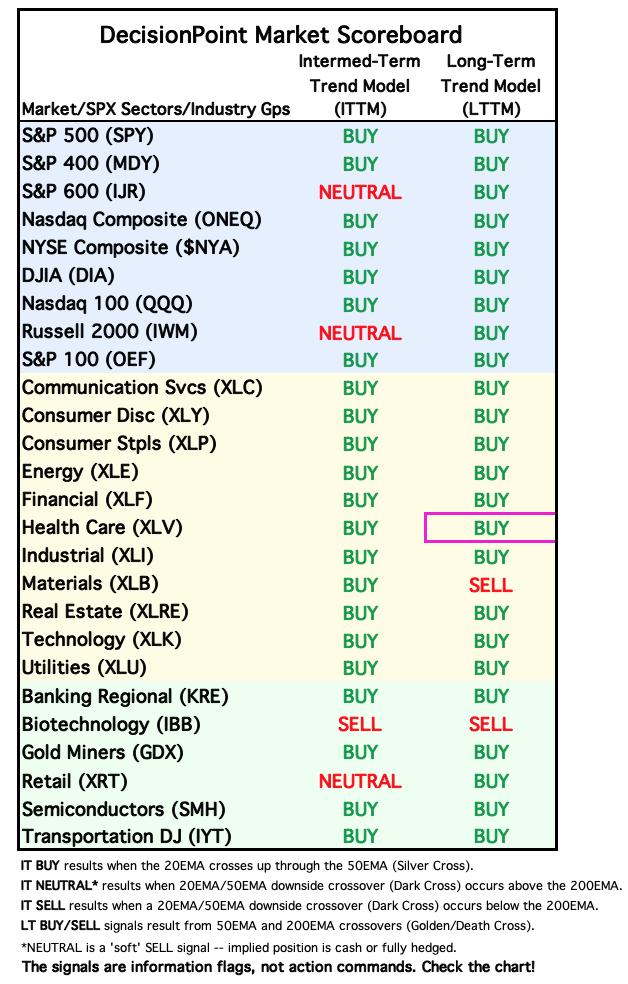
Today the Health Care ETF (XLV) 50-day EMA crossed up through the 200-day EMA (Golden Cross), generating an LT Trend Model BUY Signal. We have a breakout from a near-term declining trend that looks encouraging. However, strong overhead resistance is already nearing. The PMO is on a new Crossover BUY Signal and we are seeing some improvement to participation, but participation readings are still below our 50% bullish threshold. The Silver Cross Index is in decline below its signal line. Overall we could see some more upside, but there is more work to be done to ensure this rally sticks around.
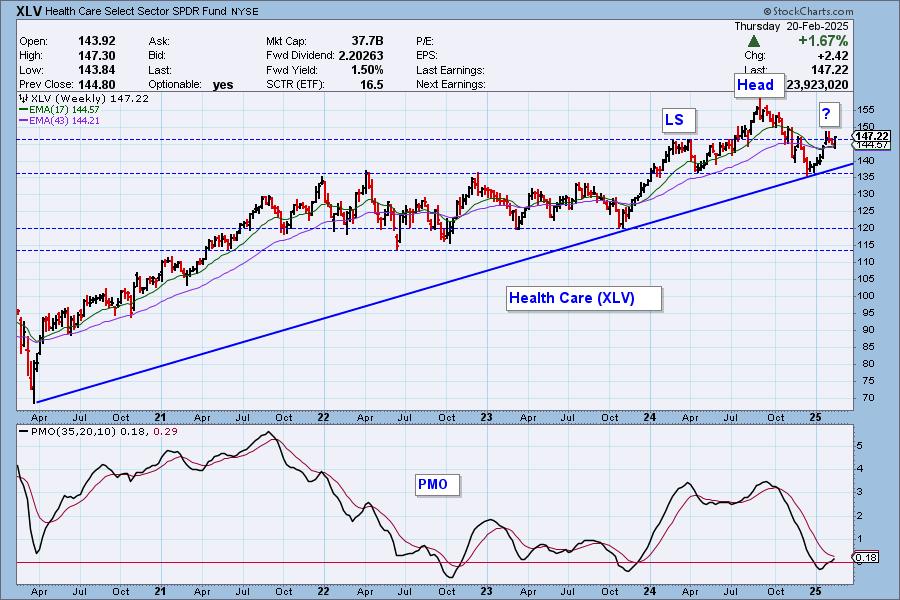
The weekly chart shows XLV maintaining above a long-term rising trend line, but we can see a left shoulder and head for a potential head and shoulders pattern. The weekly PMO is on the rise, but this could prove to be a problem in the intermediate to long terms.
The DecisionPoint Alert Weekly Wrap presents an end-of-week assessment of the trend and condition of the Stock Market, the U.S. Dollar, Gold, Crude Oil, and Bonds. The DecisionPoint Alert daily report (Monday through Thursday) is abbreviated and gives updates on the Weekly Wrap assessments.
Watch the latest episode of DecisionPoint on our YouTube channel here!
MARKET/INDUSTRY GROUP/SECTOR INDEXES
CLICK HERE for Carl's annotated Market Index, Sector, and Industry Group charts.
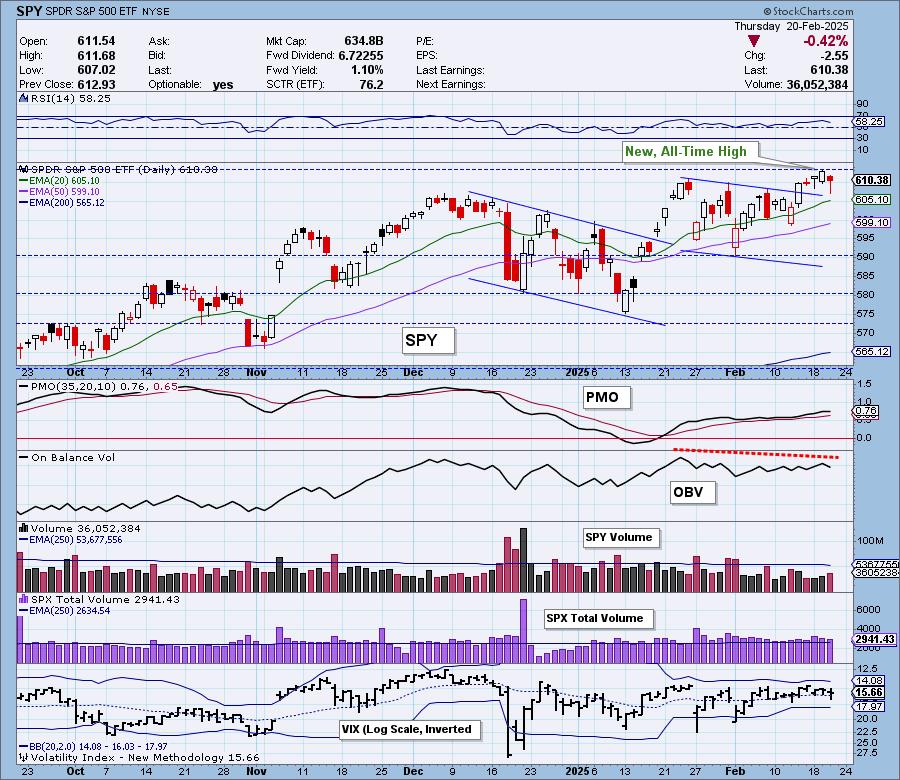
THE MARKET (S&P 500)
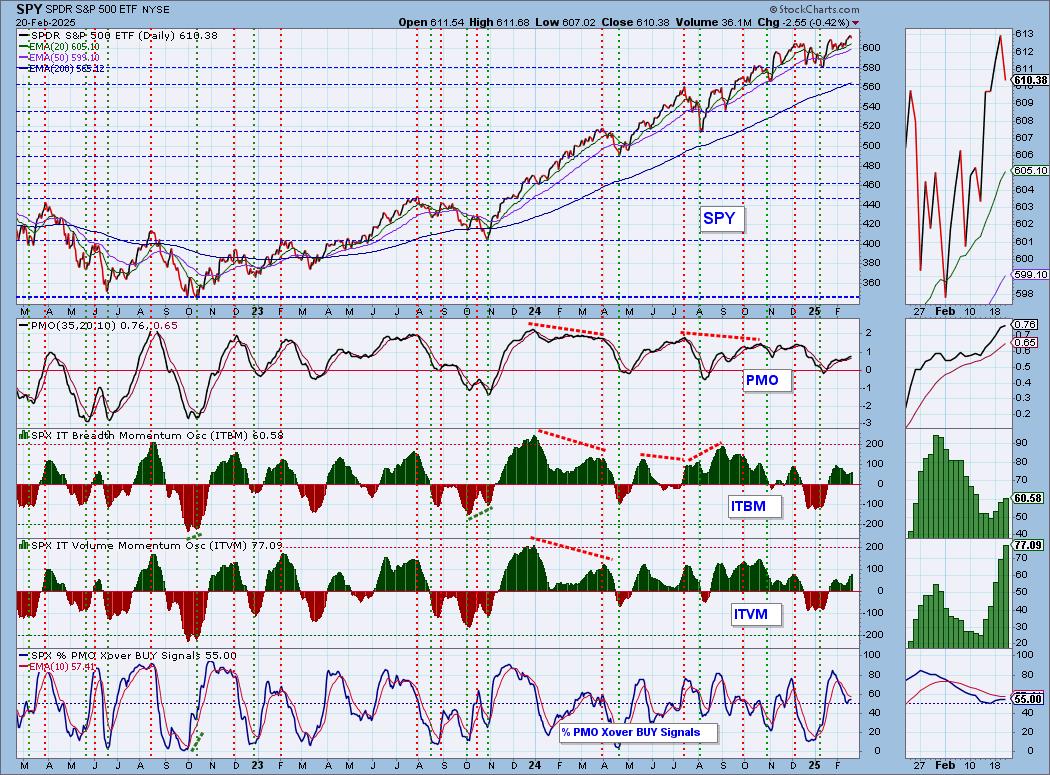
IT Trend Model: BUY as of 8/14/2024
LT Trend Model: BUY as of 3/29/2023
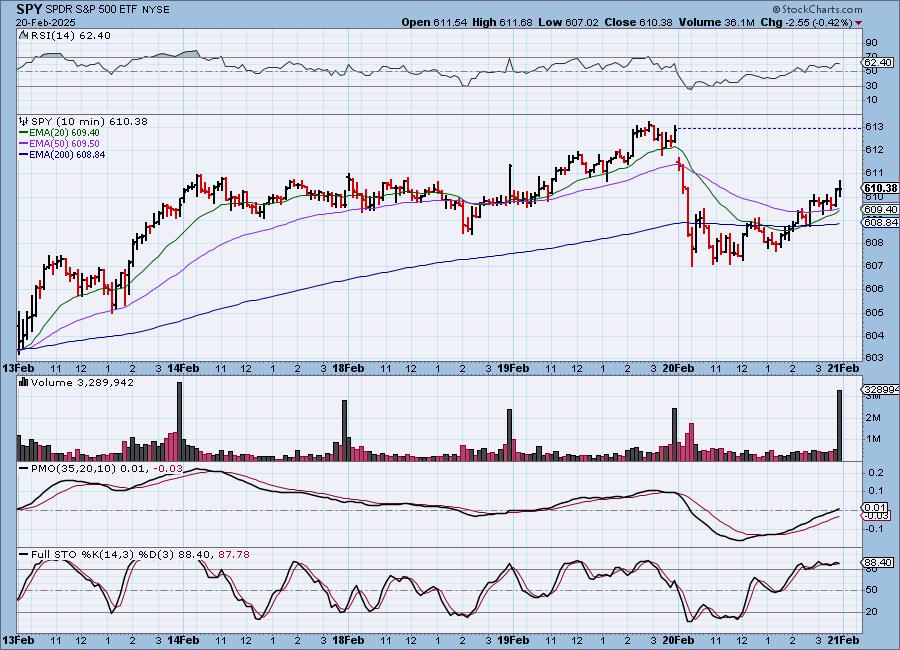
SPY 10-Minute Chart: Price dropped perilously on the open, but losses were clawed back in the afternoon. The 10-minute PMO is rising and Stochastics are above 80 so there is an opportunity for this rally to continue.
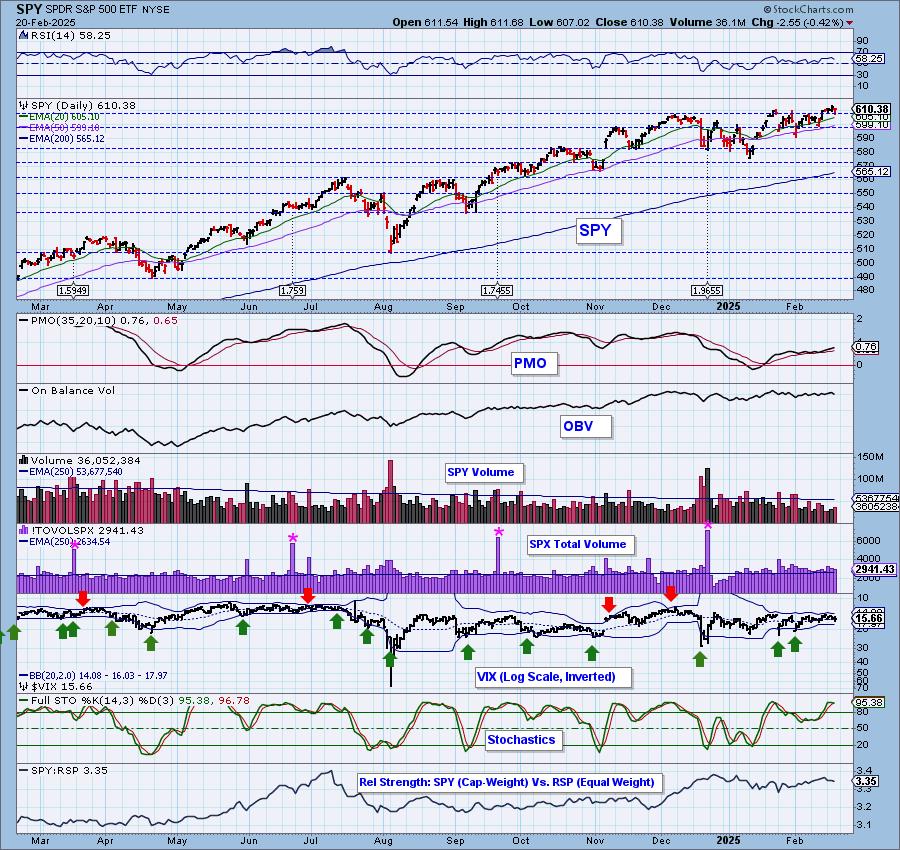
SPY Daily Chart: We note that today we have a bullish hammer candlestick that does imply price will move up tomorrow. The PMO is still rising, but decelerated today. We have a clear and confirmed negative divergence with the OBV.
The VIX held above its moving average today. Investors weren't shook up by the decline. Stochastics have topped but remain above 80 suggesting there is still some internal strength. We continue to see mega-caps weakening against equal-weight RSP. It will be hard to move the index higher without their help.

Here is the latest recording from 2/10 (No trading room 2/17). Click HERE to get to our video list.:
S&P 500 New 52-Week Highs/Lows: New Highs pared back quite a bit today, but that isn't surprising given the decline. We did see fewer New Lows and that is encouraging. Unfortunately, the High-Low Differential topped today putting a negative spin on the chart.
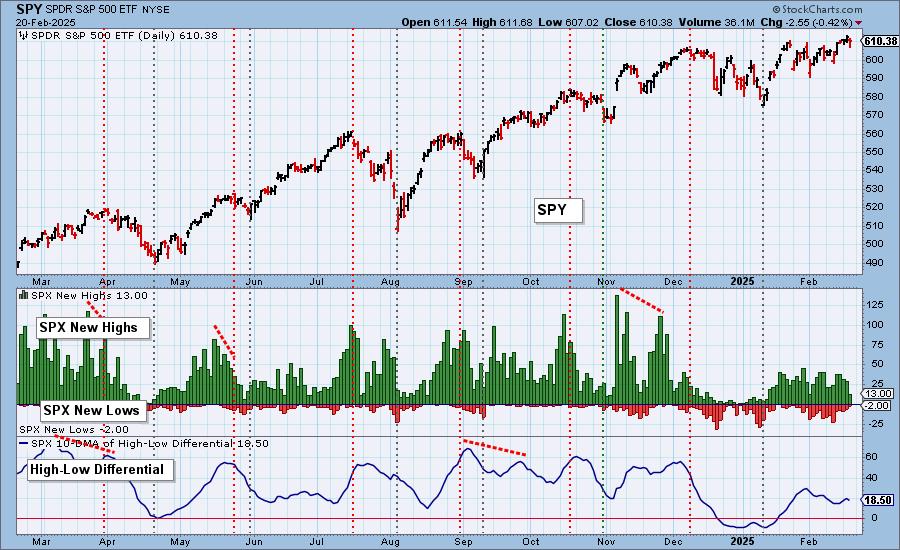
Climax* Analysis: There were no climax readings today.
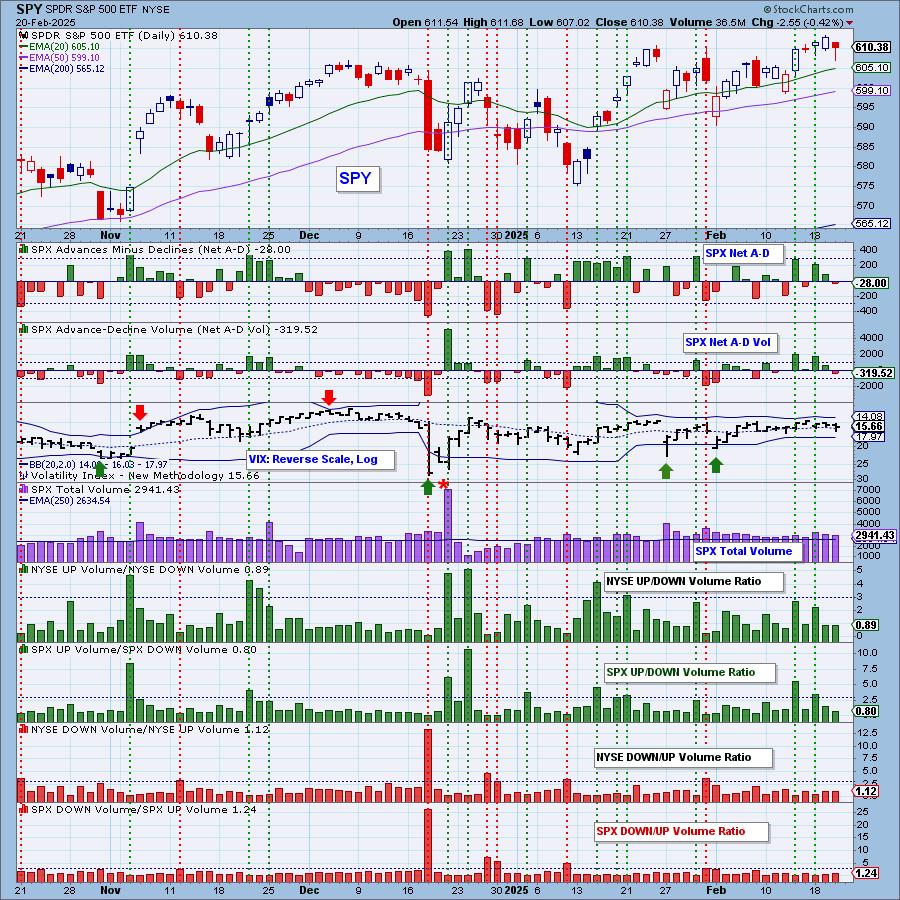
*A climax is a one-day event when market action generates very high readings in, primarily, breadth and volume indicators. We also include the VIX, watching for it to penetrate outside the Bollinger Band envelope. The vertical dotted lines mark climax days -- red for downside climaxes, and green for upside. Climaxes are at their core exhaustion events; however, at price pivots they may be initiating a change of trend.
Short-Term Market Indicators: The short-term market trend is UP and the condition is NEUTRAL.
Swenlin Trading Oscillators (STOs) are still bullish although as noted yesterday, the STO-V is already overbought. As expected we lost some participation and some rising PMOs. Readings are mildly bullish.
Intermediate-Term Market Indicators: The intermediate-term market trend is UP and the condition is NEUTRAL.
The ITBM and ITVM are confirming rising STOs. They aren't overbought yet so there is plenty of room for them to move higher before hitting overbought conditions. We didn't lose any PMO BUY Signals today, but conversely we didn't gain any either.
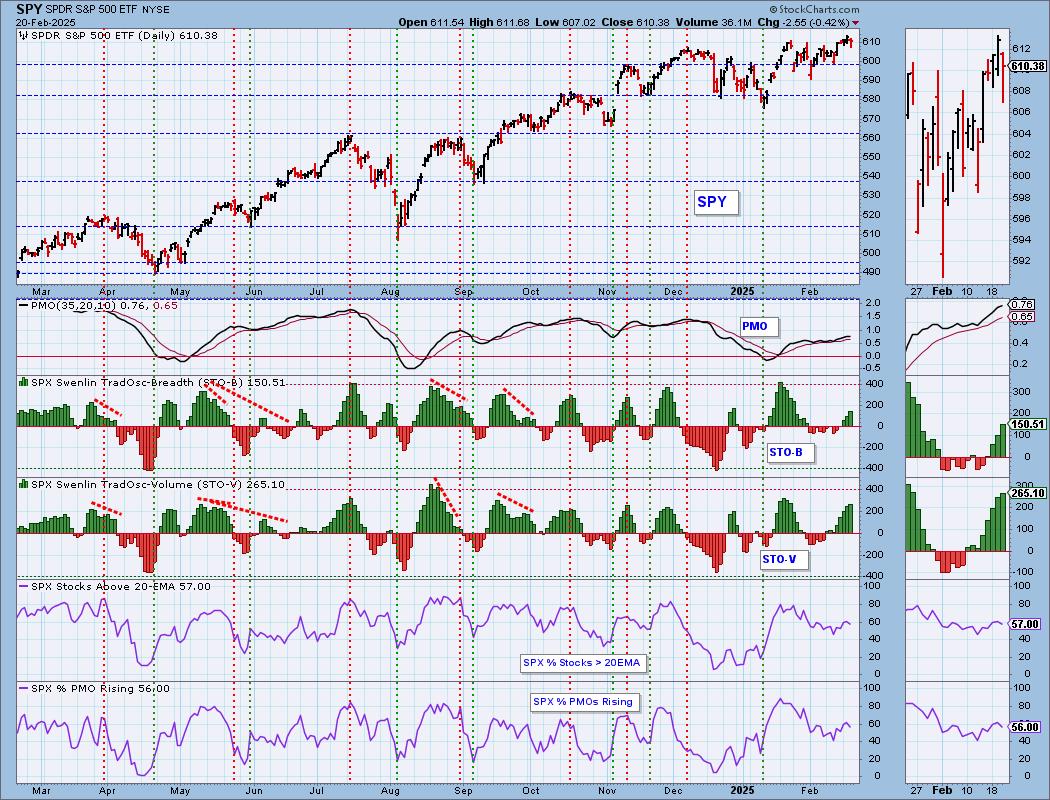
PARTICIPATION CHART (S&P 500): The following chart objectively shows the depth and trend of participation for the SPX in two time frames.
- Intermediate-Term - the Silver Cross Index (SCI) shows the percentage of SPX stocks on IT Trend Model BUY signals (20-EMA > 50-EMA). The opposite of the Silver Cross is a "Dark Cross" -- those stocks are, at the very least, in a correction.
- Long-Term - the Golden Cross Index (GCI) shows the percentage of SPX stocks on LT Trend Model BUY signals (50-EMA > 200-EMA). The opposite of a Golden Cross is the "Death Cross" -- those stocks are in a bear market.
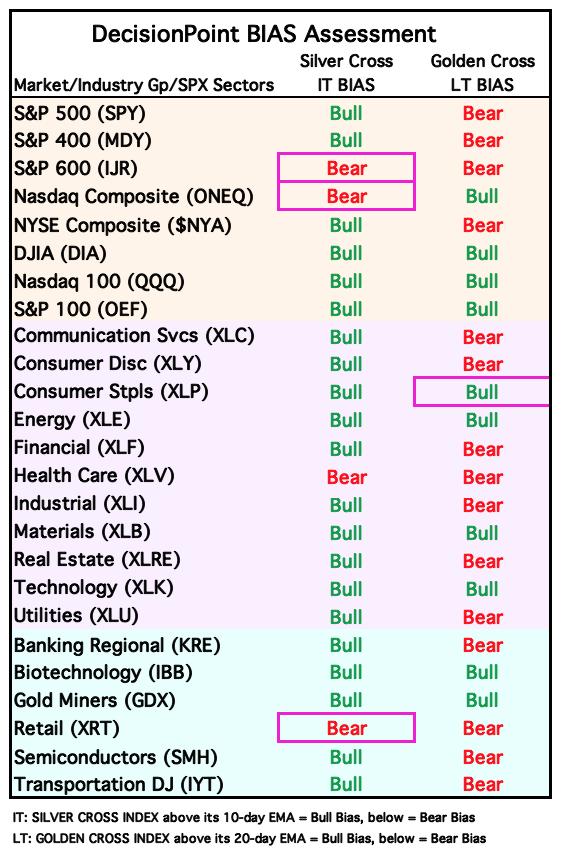
The market bias is BULLISH in the intermediate term.
The market bias is BEARISH in the long term.
Participation is mildly bullish as it is reading above our bullish 50% thresholds, but just barely for stocks above their 20/50-day EMAs. We still like that declining trends have been broken, but we need more participation to ensure the index will move even higher. The Silver Cross Index is rising nicely but also has a mildly bullish reading that needs to improve. It is above its signal line which is why the IT Bias is BULLISH. The Golden Cross Index has stagnated. It is below its signal line so even though it is reading higher than the Silver Cross Index, the LT Bias is BEARISH.
BIAS Assessment: The following table expresses the current BIAS of various price indexes based upon the relationship of the Silver Cross Index to its 10-day EMA (intermediate-term), and of the Golden Cross Index to its 20-day EMA (long-term). When the Index is above the EMA it is bullish, and it is bearish when the Index is below the EMA. The BIAS does not imply that any particular action should be taken. It is information to be used in the decision process.
The items with highlighted borders indicate that the BIAS changed today.
*****************************************************************************************************
CONCLUSION: A few more bearish biases hit our Bias Table above so there are some cracks in the short-term foundation. Today's decline was essentially blamed on Walmart (WMT), but it tells us that the market is still shaky if one stock can be a downside catalyst. The internals are still reading bullish with participation breaking declining trends and our primary indicators all rising. The market could continue to make all-time highs, but we are monitoring the mega-cap weakness against equal-weight RSP. That relative strength line is declining and typically when that happens, the market churns or sees weakness. Mildly bullish participation readings need to see some improvement if we are going to get the index moving higher without mega-cap participation. Stay cautious.
Erin is 15% long, 0% short. (This is intended as information, not a recommendation.)
*****************************************************************************************************
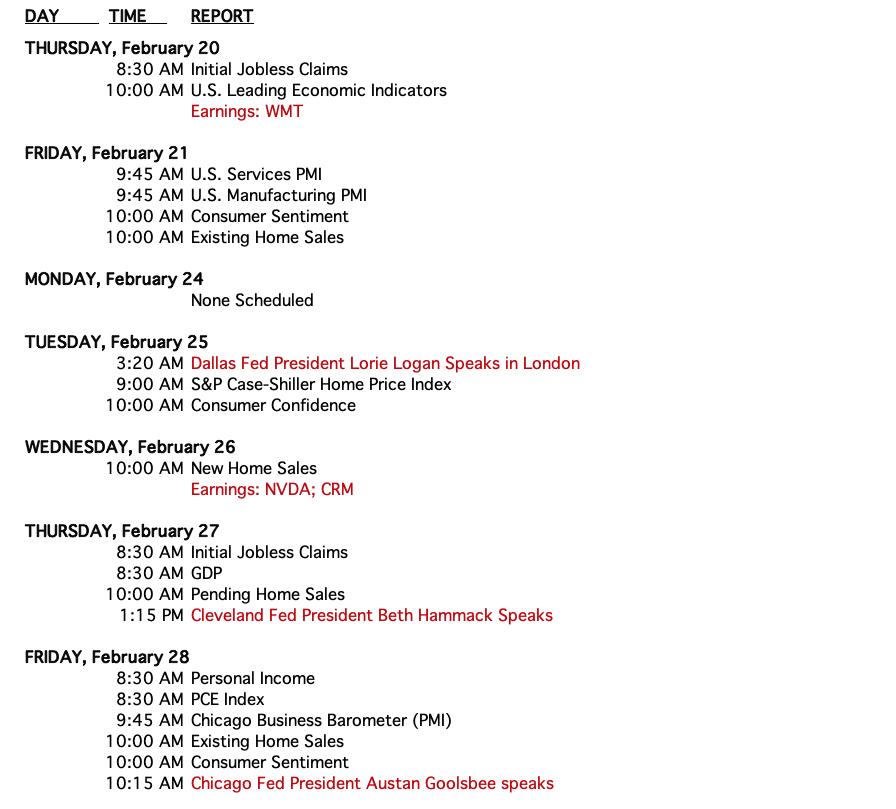
CALENDAR
Have you subscribed the DecisionPoint Diamonds yet? DP does the work for you by providing handpicked stocks/ETFs from exclusive DP scans! Add it with a discount! Contact support@decisionpoint.com for more information!
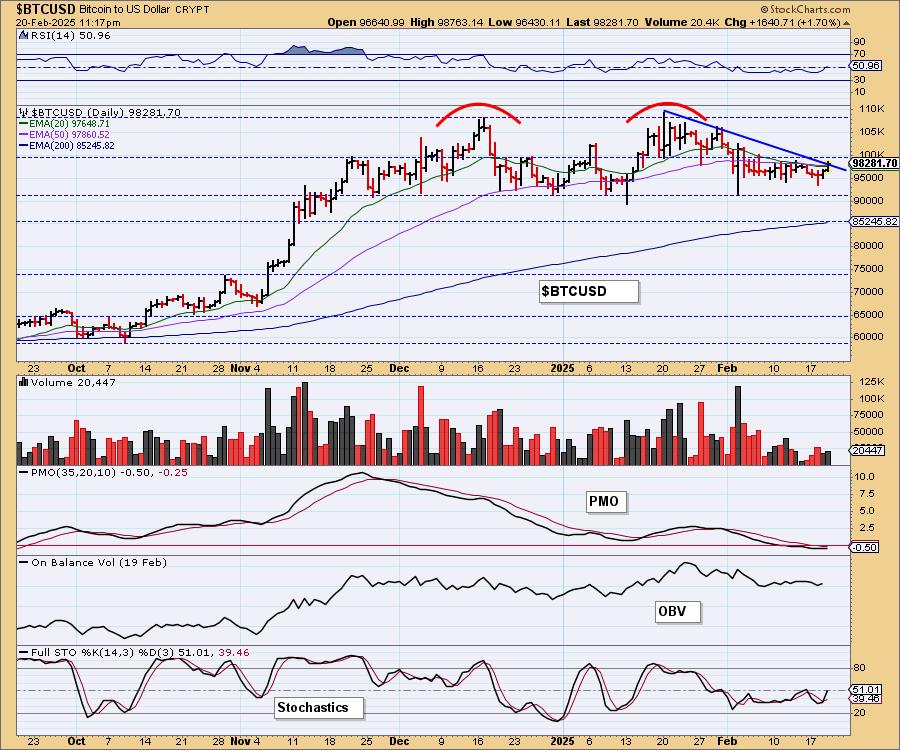
BITCOIN
We have a bit of good news to report on Bitcoin. Today the declining trend out of the second top of the bearish double top formation was broken...barely, but still saw a tiny breakout. We need to see more followthrough, but this could be a sign that price will again make its way back toward all-time highs. Stochastics have turned up and the RSI is now in positive territory. The PMO is flat, but does look interested in turning back up. It's early, but this is encouraging.
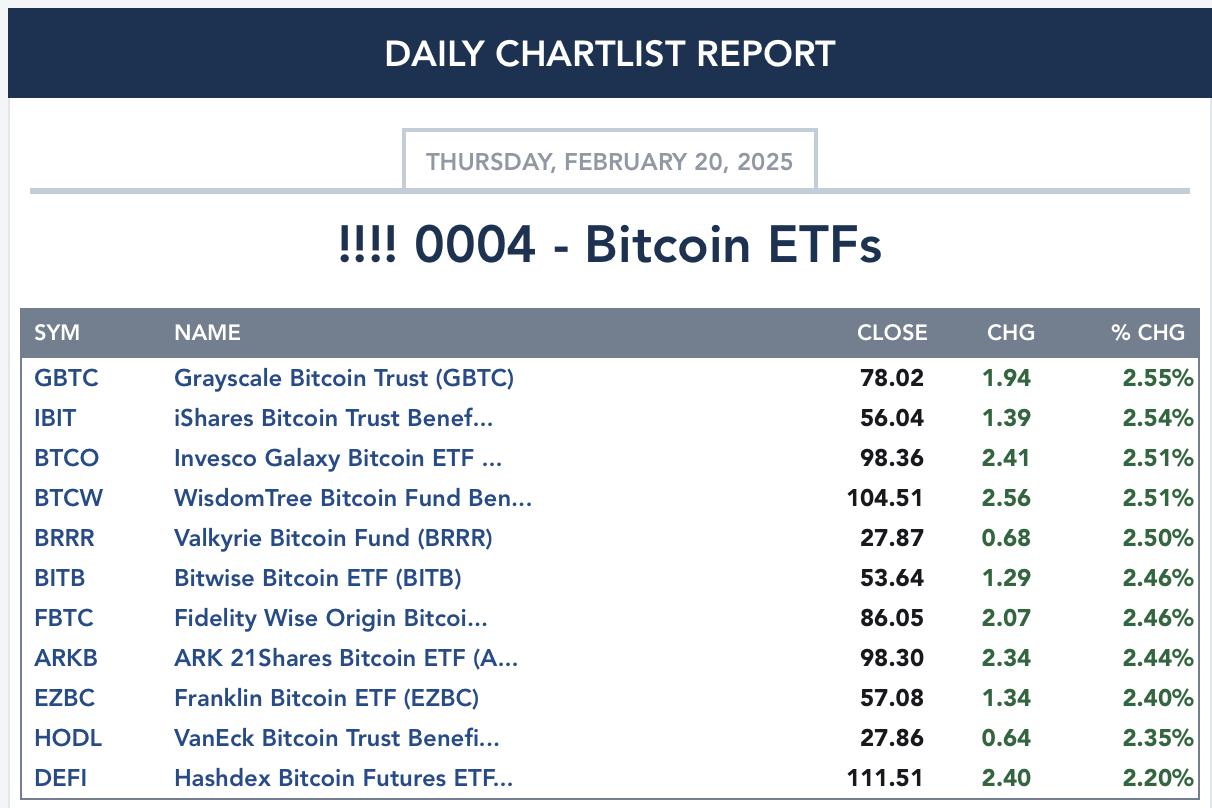
BITCOIN ETFs
INTEREST RATES
Yields were mixed, but long-term rates were lower on the day. We are likely to see more sideways churn as the Bond market figures out how it feels about inflation measures.
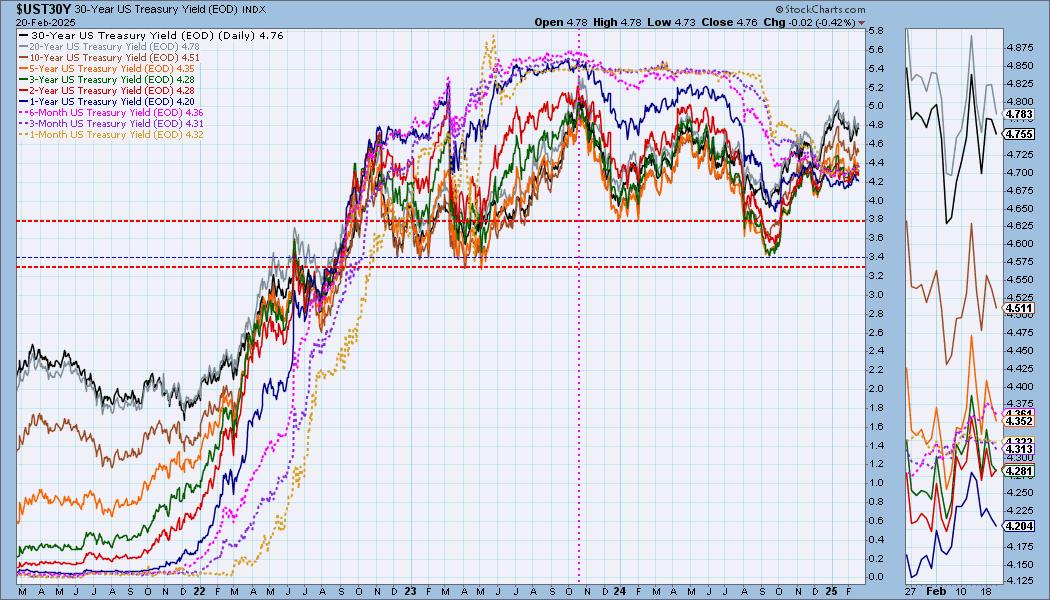
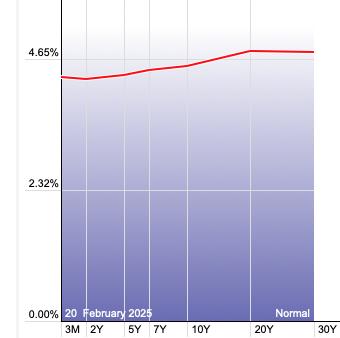
The Yield Curve Chart from StockCharts.com shows us the inversions taking place. The red line should move higher from left to right. Inversions are occurring where it moves downward.
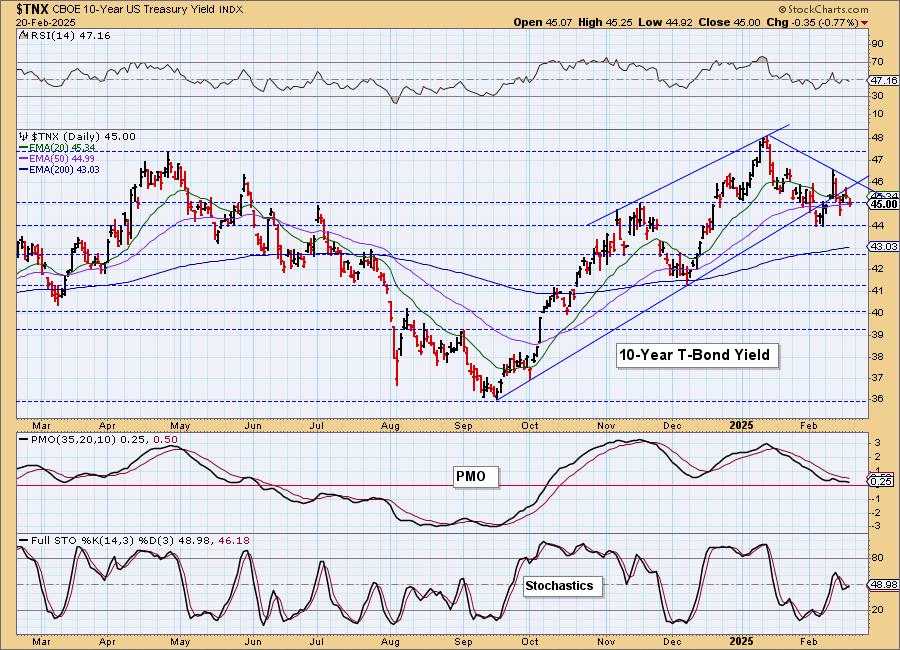
10-YEAR T-BOND YIELD
The declining trend is still intact and the PMO is falling beneath its signal line. We did see Stochastics turn up, but the RSI moved into negative territory. We are looking for a test of support at 4.4%.
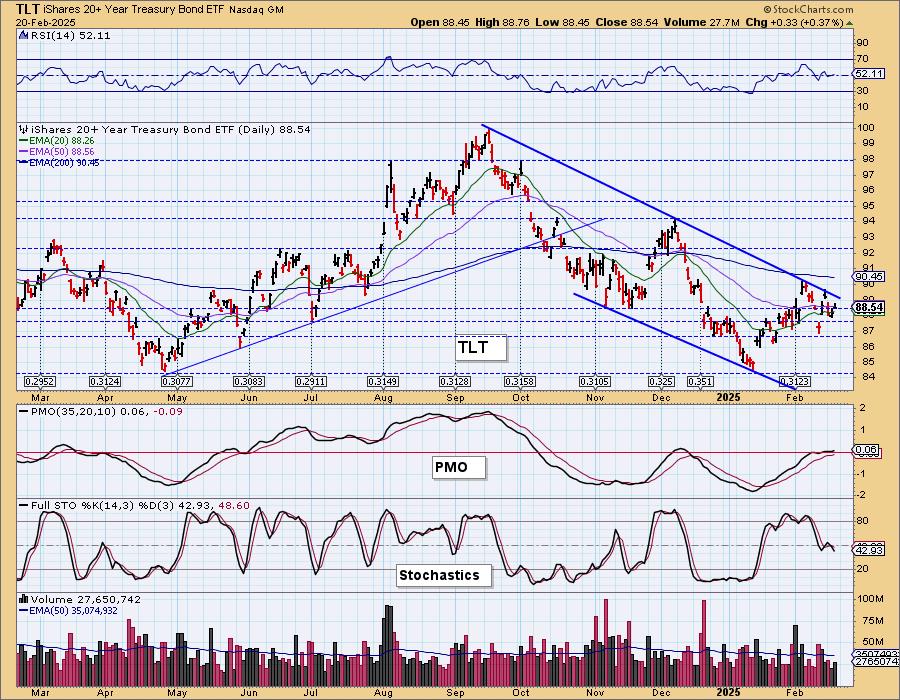
BONDS (TLT)
IT Trend Model: NEUTRAL as of 11/10/2024
LT Trend Model: SELL as of 12/13/2024
TLT Daily Chart: The 20-year yield is mixed. We have a rising trend, but we also see a declining trend. We suspect we'll see yields move mostly sideways so we expect the same for TLT. We are still monitoring a bearish double top. If price can overcome those tops, the pattern will be busted. Indicators are mixed so we will look for more sideways movement.
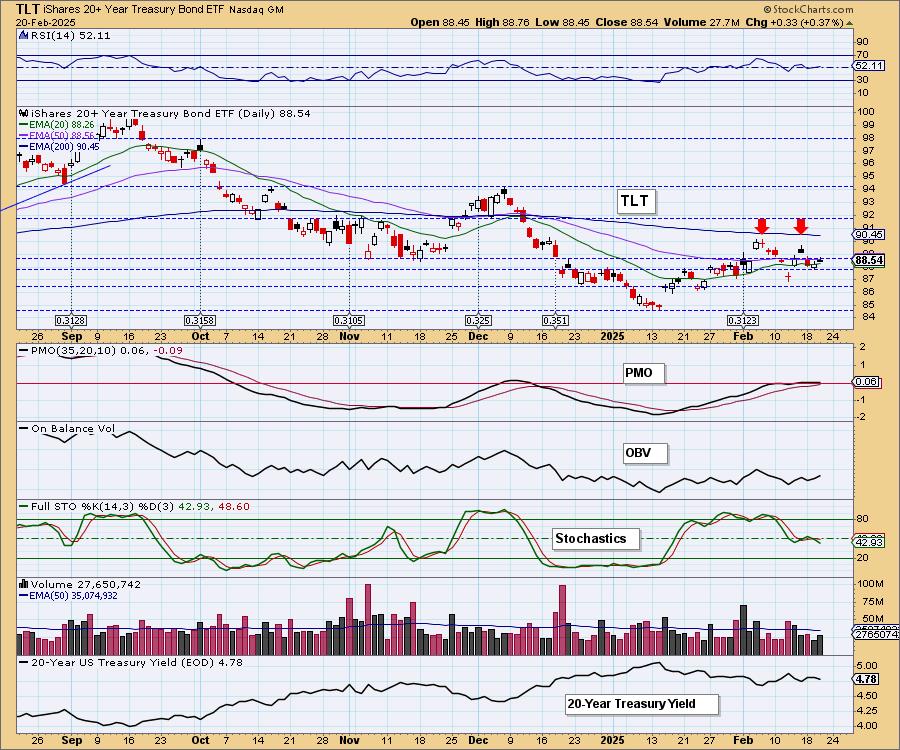
The large declining trend channel does put a negative spin on Bonds.
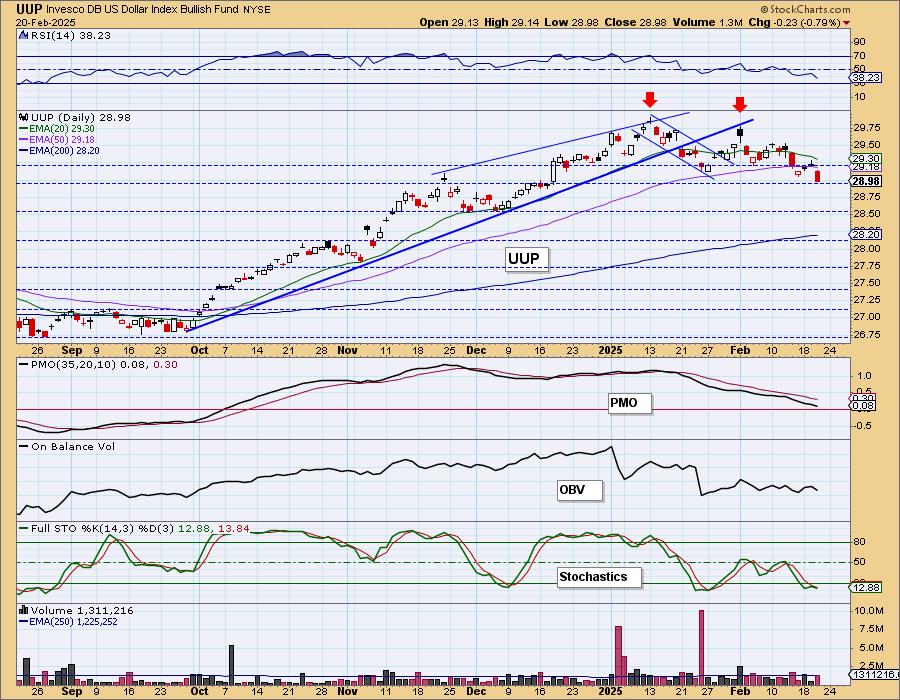
DOLLAR (UUP)
IT Trend Model: BUY as of 10/9/2024
LT Trend Model: BUY as of 5/25/2023
UUP Daily Chart: The Dollar saw a decline down to support at 29.00. The double top seems to be playing out as expected. The confirmation line of the double top has been compromised so we should look for a decline down to support around the 200-day EMA. Stochastics topped below 20 which is especially bearish.
GOLD
IT Trend Model: BUY as of 1/10/2025
LT Trend Model: BUY as of 10/20/2023
GLD Daily Chart: The rally in Gold continues and given the bearish look of the Dollar, it should continue to make its way higher. With an overbought RSI, it is due for a pause or decline, but given the Dollar isn't an impediment, the RSI could get more overbought from here.
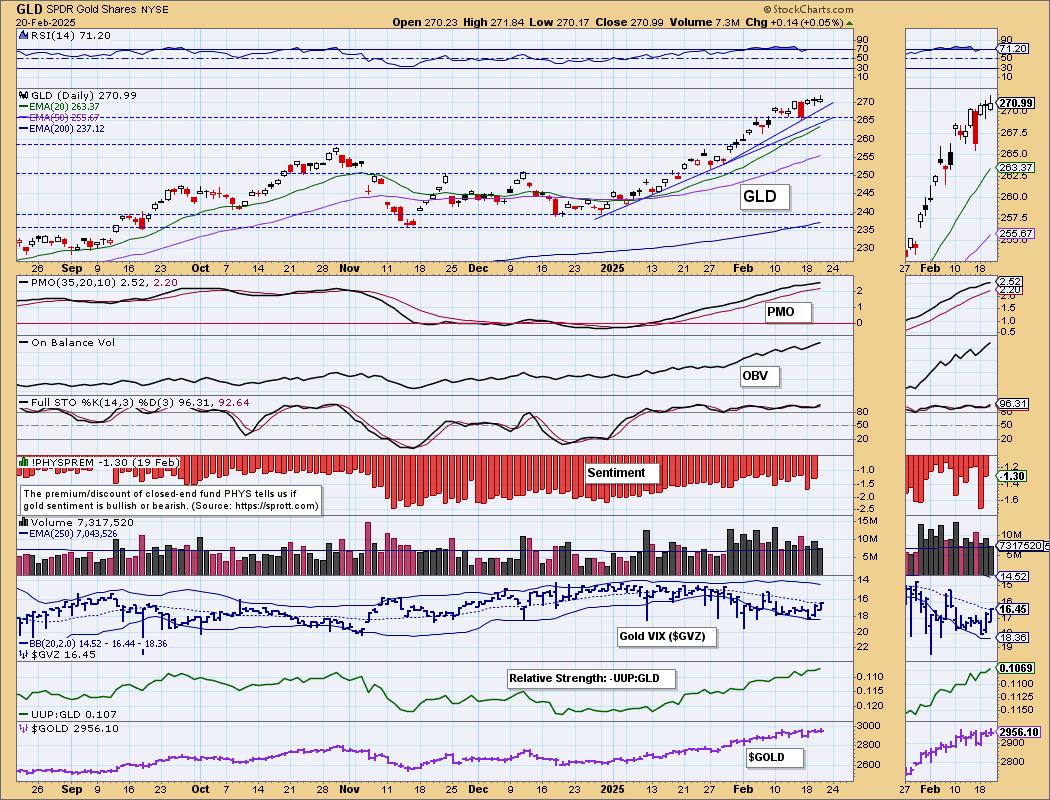
The relative strength of Gold to the Dollar is rising still which also suggests we'll see higher prices.

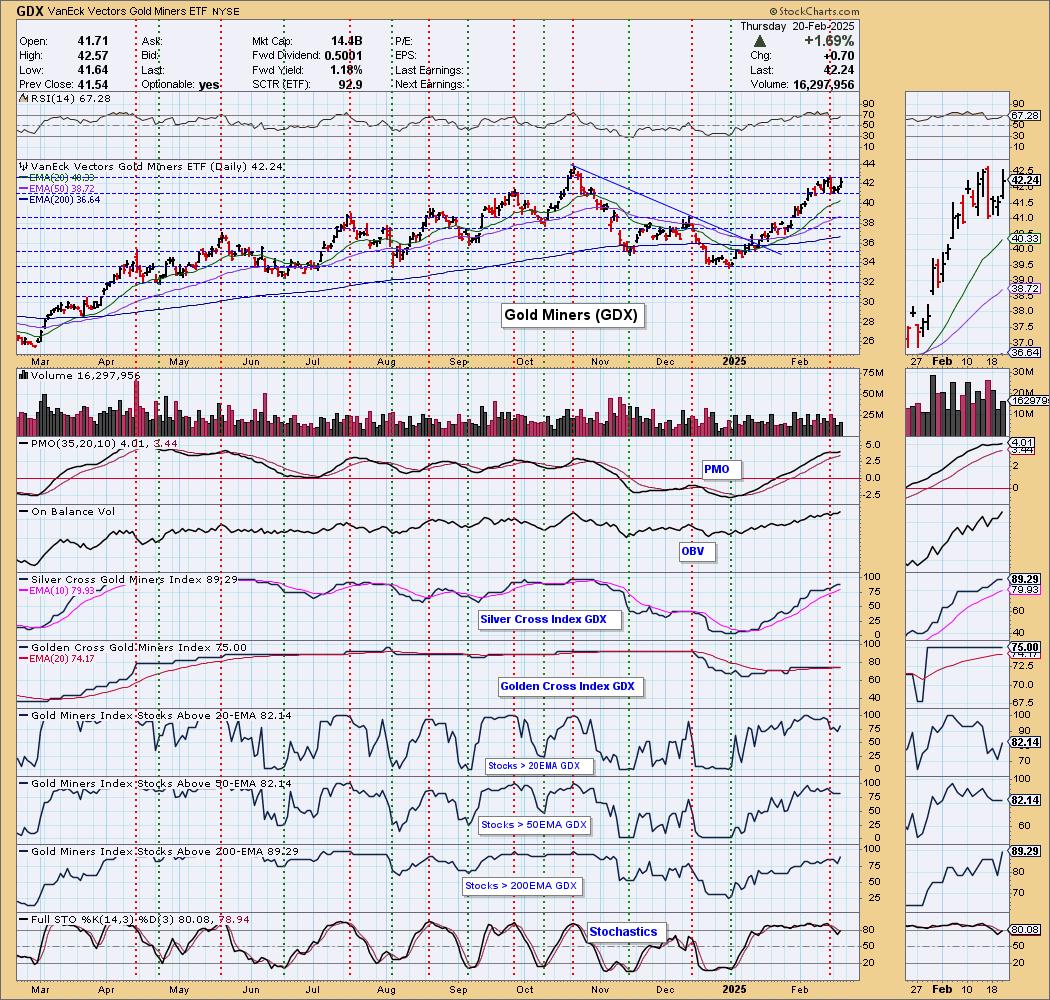
GOLD MINERS (GDX) Daily Chart: GDX reversed today, but we still think they look somewhat toppy. Participation is still very strong but has pared back somewhat. Of course, with Gold looking so bullish, we have to expect GDX will continue to make its way higher. The PMO did accelerate higher today so we would look for a test of the October top. If Gold reverses, GDX will likely drop quickly. We'll count on a weak Dollar to keep both Gold and Gold Miners elevated longer.
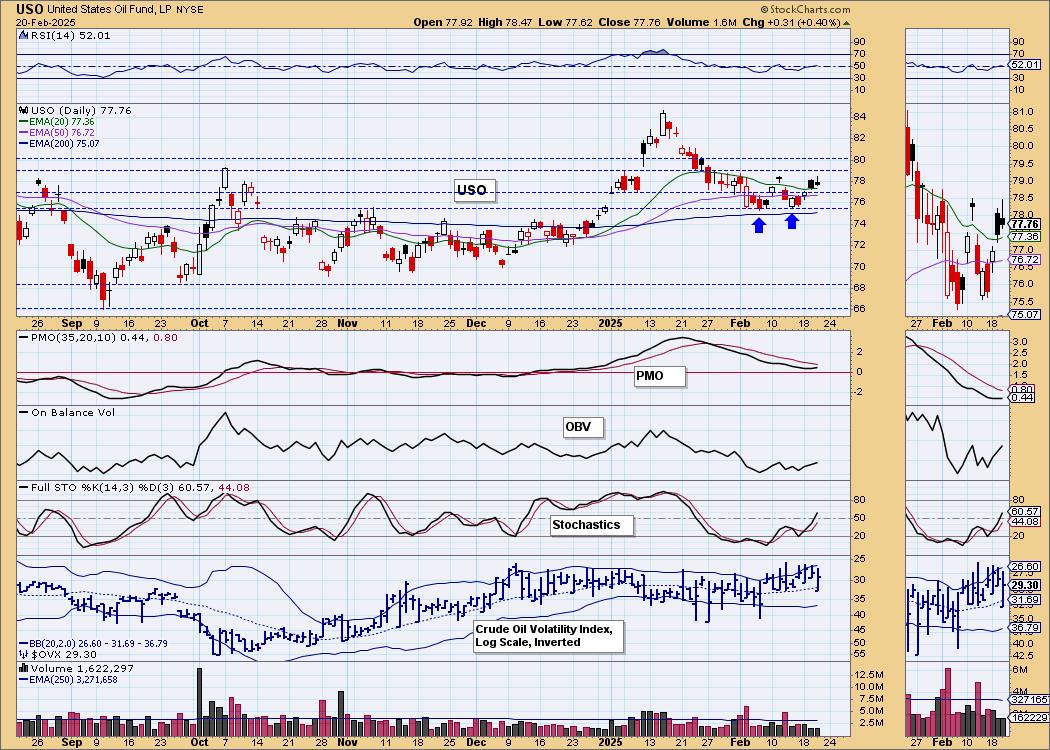
CRUDE OIL (USO)
IT Trend Model: BUY as of 12/24/2024
LT Trend Model: BUY as of 1/10/2025
USO Daily Chart: We like the bullish double bottom on Crude here. Today the PMO turned back up above the zero line. Stochastics are rising again and the RSI just moved into positive territory. The upside target of the double bottom isn't impressive at only 81, but that is a minimum upside target. We will look for some more upside, but aren't so sure we'll get a move back to the January top.
Good Luck & Good Trading!
Erin Swenlin and Carl Swenlin
Technical Analysis is a windsock, not a crystal ball. --Carl Swenlin
(c) Copyright 2025 DecisionPoint.com
Disclaimer: This blog is for educational purposes only and should not be construed as financial advice. The ideas and strategies should never be used without first assessing your own personal and financial situation, or without consulting a financial professional. Any opinions expressed herein are solely those of the author, and do not in any way represent the views or opinions of any other person or entity.
DecisionPoint is not a registered investment advisor. Investment and trading decisions are solely your responsibility. DecisionPoint newsletters, blogs or website materials should NOT be interpreted as a recommendation or solicitation to buy or sell any security or to take any specific action.
NOTE: The signal status reported herein is based upon mechanical trading model signals, specifically, the DecisionPoint Trend Model. They define the implied bias of the price index based upon moving average relationships, but they do not necessarily call for a specific action. They are information flags that should prompt chart review. Further, they do not call for continuous buying or selling during the life of the signal. For example, a BUY signal will probably (but not necessarily) return the best results if action is taken soon after the signal is generated. Additional opportunities for buying may be found as price zigzags higher, but the trader must look for optimum entry points. Conversely, exit points to preserve gains (or minimize losses) may be evident before the model mechanically closes the signal.
Helpful DecisionPoint Links:
DecisionPoint Alert Chart List
DecisionPoint Golden Cross/Silver Cross Index Chart List
DecisionPoint Sector Chart List
Price Momentum Oscillator (PMO)