
Today the United States Oil Fund (USO) 20-day EMA crossed down through the 50-day EMA (Dark Cross), above the 200-day EMA, generating an IT Trend Model NEUTRAL Signal. More comments follow in the Crude Oil section below.

__________
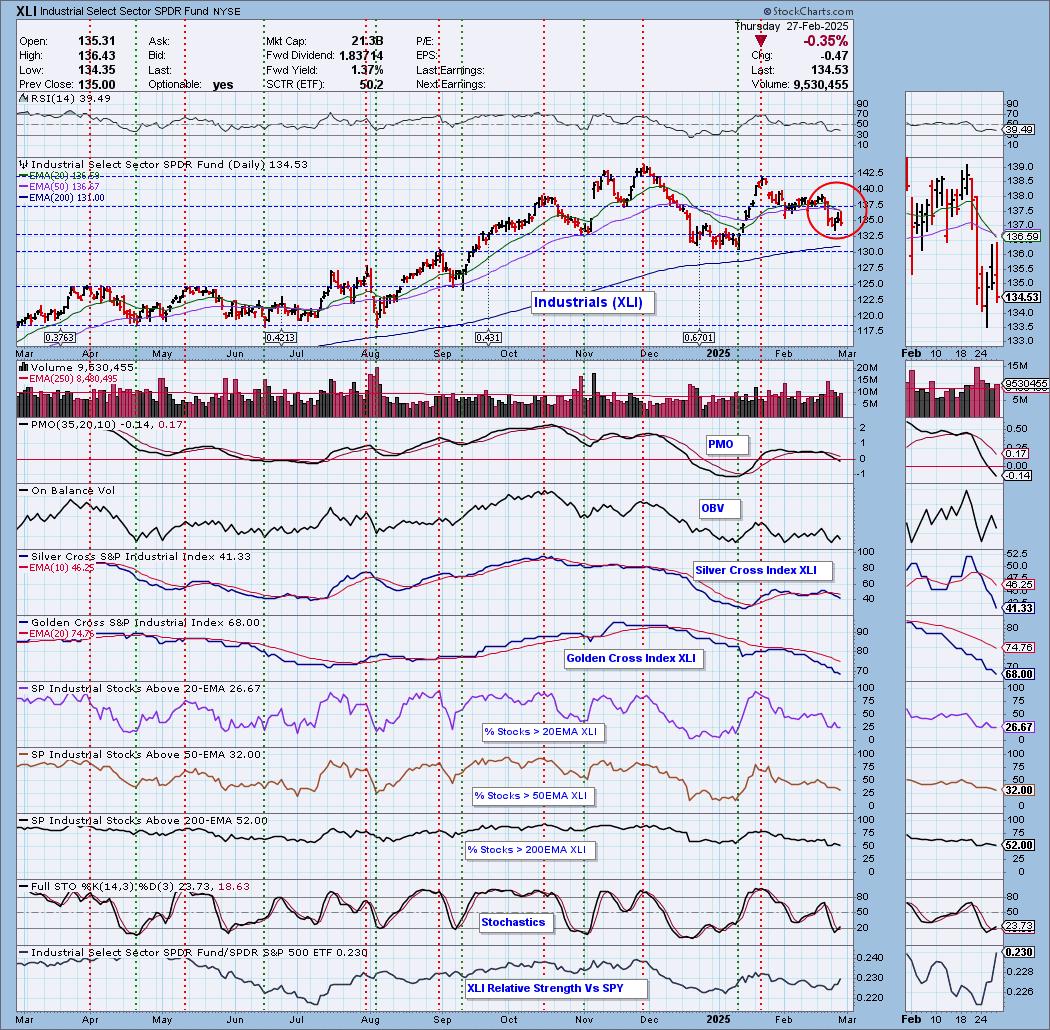
Also today, the Industrial Sector ETF (XLI) 20-day EMA crossed down through the 50-day EMA (Dark Cross), above the 200-day EMA, generating an IT Trend Model NEUTRAL Signal. Participation is in a declining trend and both the Silver Cross Index and Golden Cross Index are below their signal lines. Support is here, but we don't think it will hold much longer.
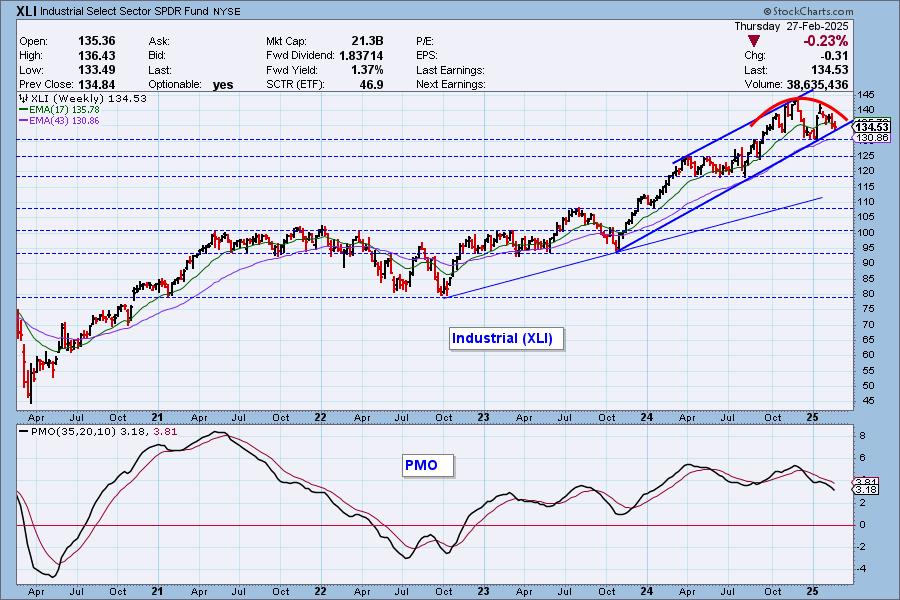
The weekly chart shows XLI testing the bottom of the rising trend channel, as well as a bearish rounded top.
__________
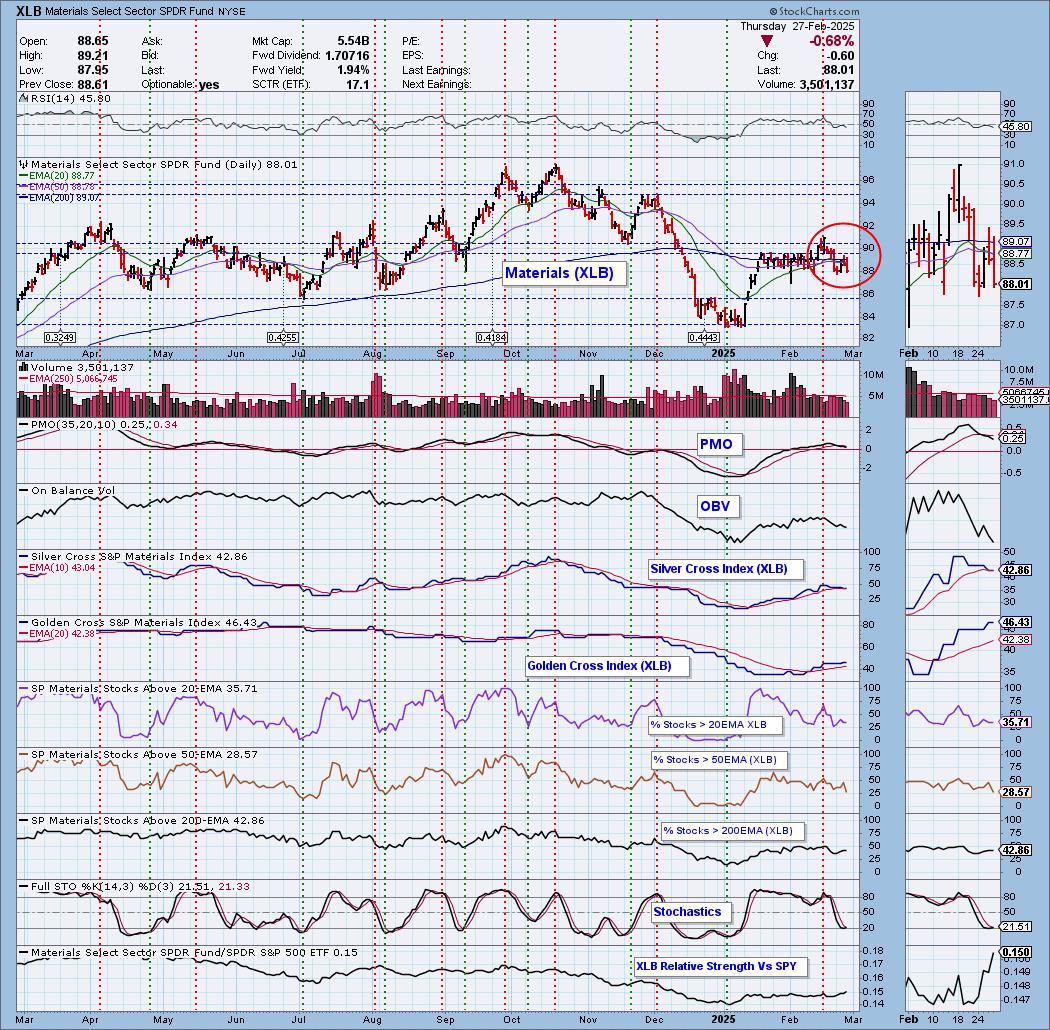
Also today, the Materials Sector (XLB) 20-day EMA crossed down through the 50-day EMA (Dark Cross), above the 200-day EMA, generating an IT Trend Model NEUTRAL Signal. We see very low readings on participation and the Silver Cross Index just saw a Bearish Shift across the signal line. The PMO is on a recent Crossover SELL Signal. We would look for the next level of support to be tested at 86.
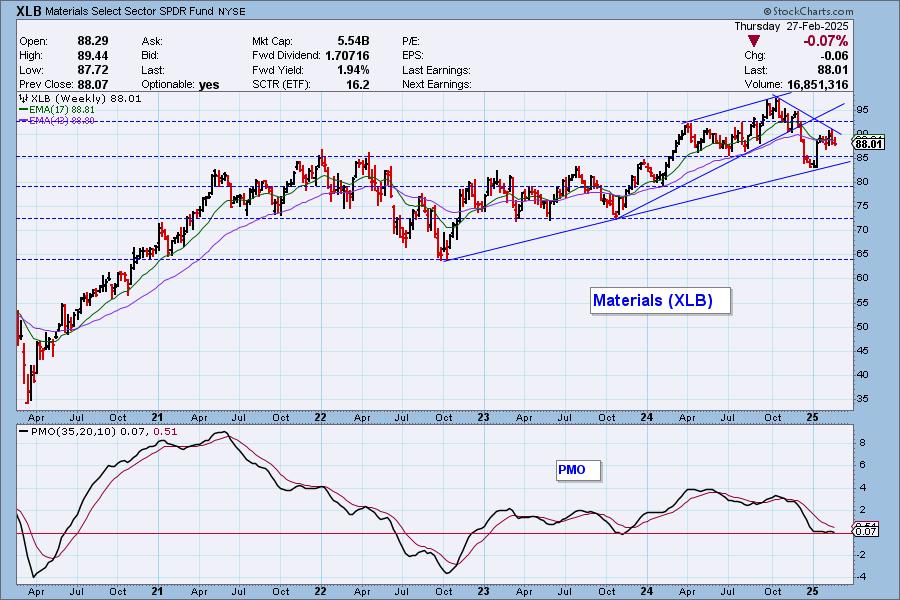
The weekly chart shows XLB is in a falling trend from the October top, but the long-term rising trend line remains intact.
__________
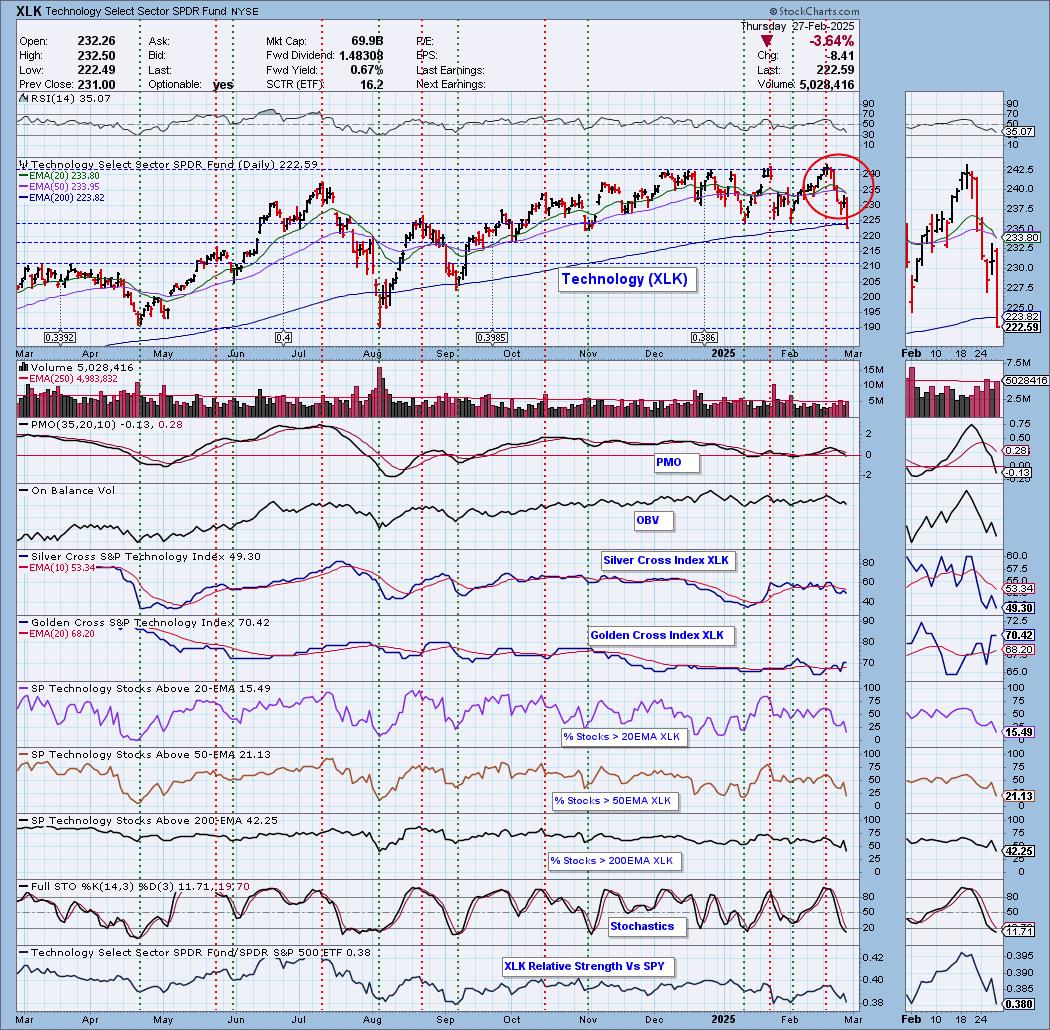
Today the Technology Sector (XLK) 20-day EMA crossed down through the 50-day EMA (Dark Cross), above the 200-day EMA, generating an IT Trend Model NEUTRAL Signal. Very strong support was broken today on a deep decline. Participation has plummeted and the Silver Cross Index topped beneath its signal line. We would look for a move toward support at 210.
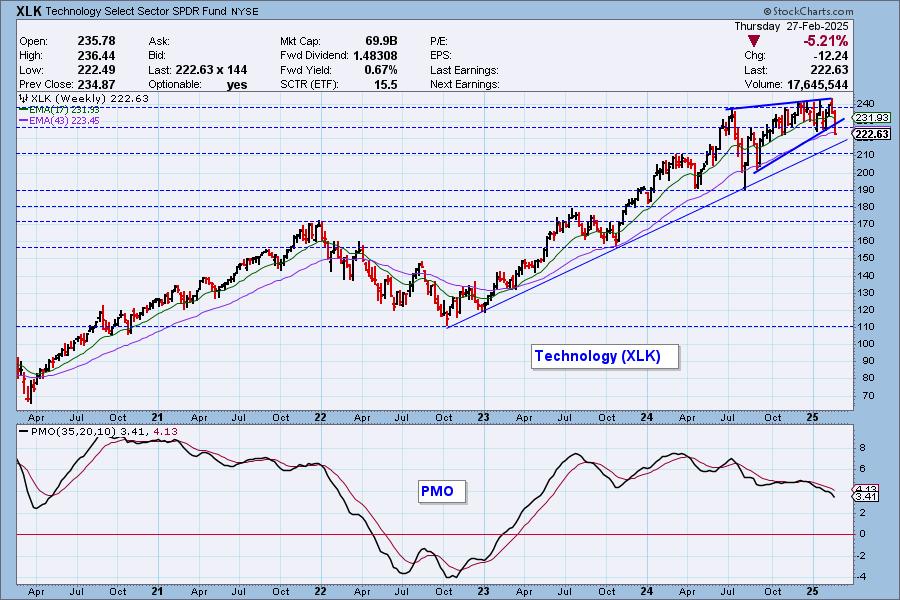
On the weekly chart XLK has broken down from the rising wedge pattern, but it may find support on the long-term rising trend line. It is weak given the decline of the weekly PMO.
__________
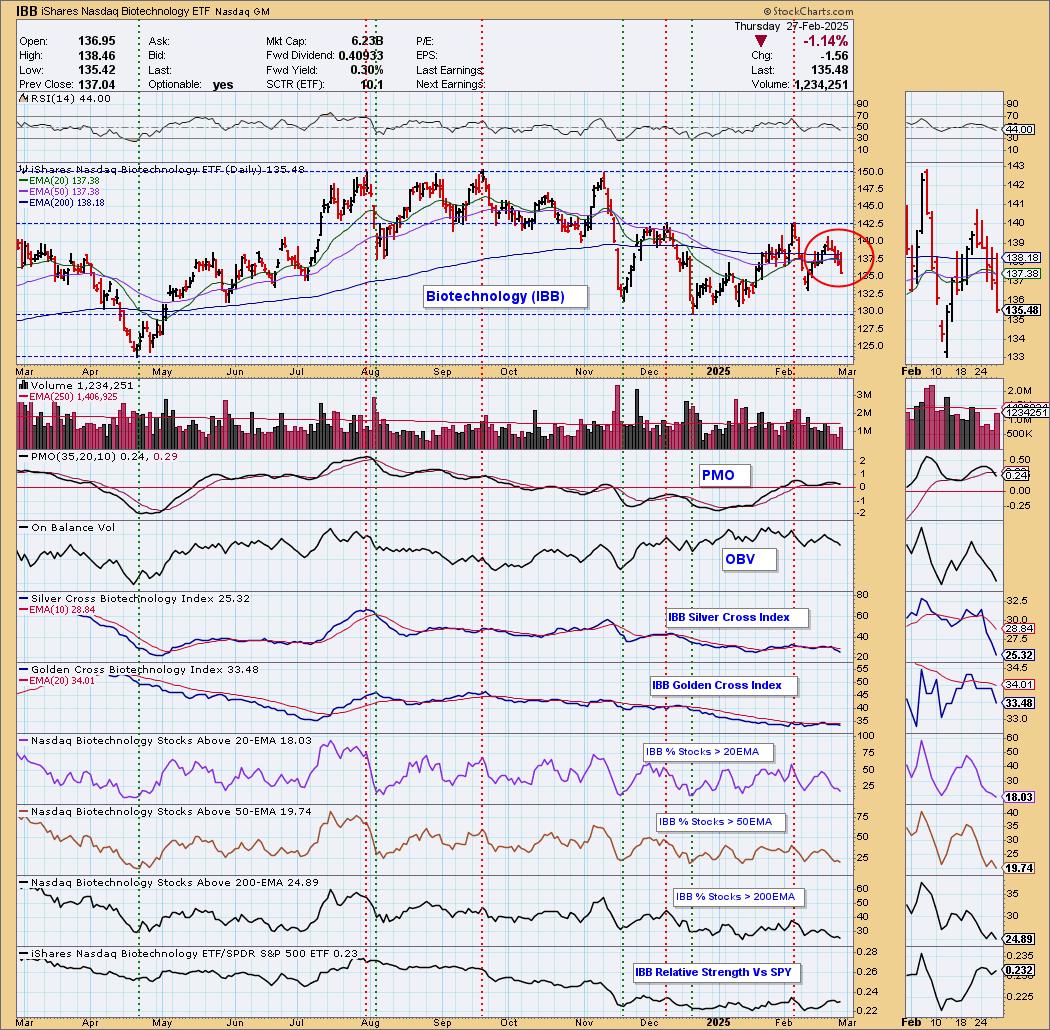
Also, today the Biotechnology ETF (IBB) 20-day EMA crossed down through the 50-day EMA (Dark Cross), above the 200-day EMA, generating an IT Trend Model NEUTRAL Signal. We have a bearish double top developing. The PMO just had a negative crossover its signal line. Participation is in the basement. We would look for a test at 130.
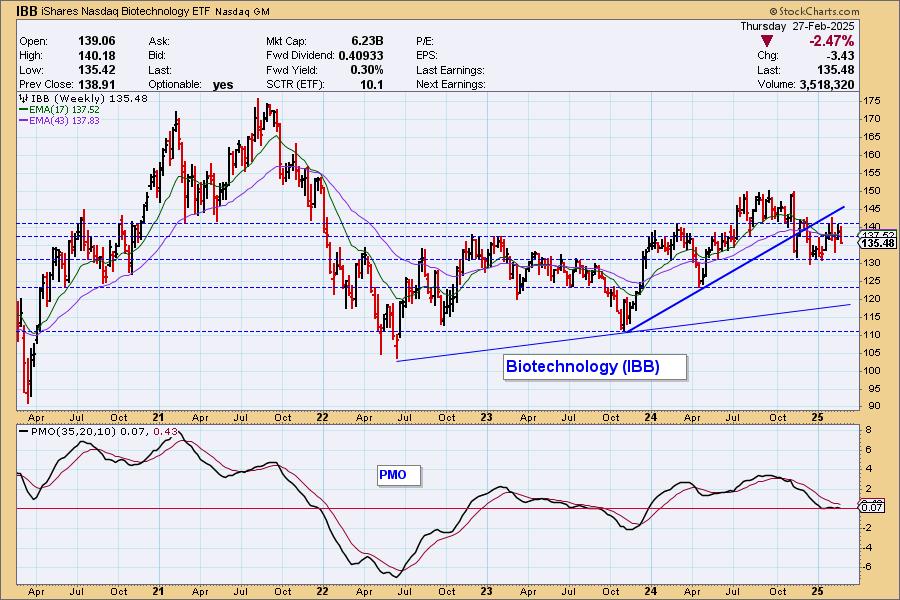
A 15-month rising trend line has been violated on the weekly chart, but our impression is that IBB is basically moving sideways (confirmed by the flat weekly PMO).
__________
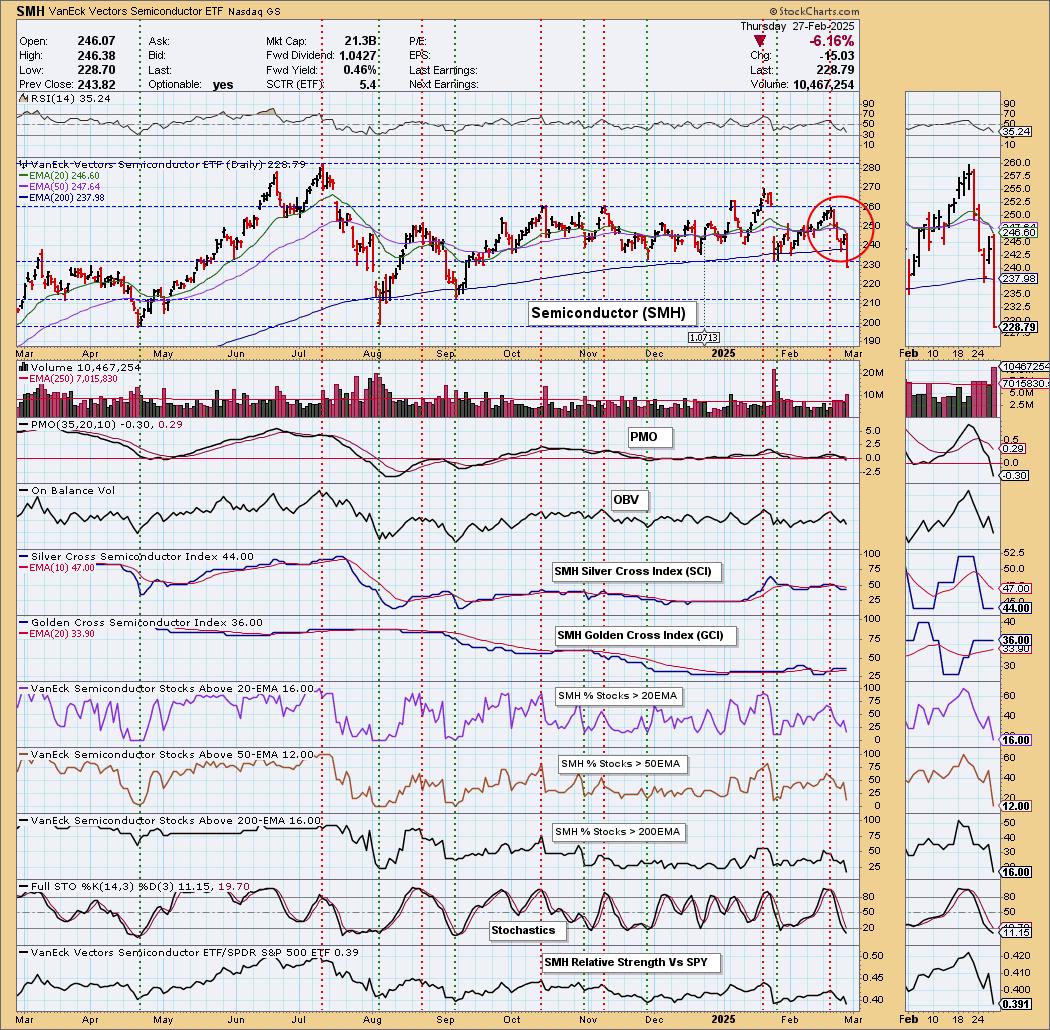
Finally, the Semiconductor ETF (SMH) 20-day EMA crossed down through the 50-day EMA (Dark Cross), above the 200-day EMA, generating an IT Trend Model NEUTRAL Signal. Like Technology (XLK), SMH lost very important support. The PMO has dropped beneath the zero line and we have paltry participation readings so there is no strength to pull SMH out of this decline right now. Support at 210 looks like the next stop.
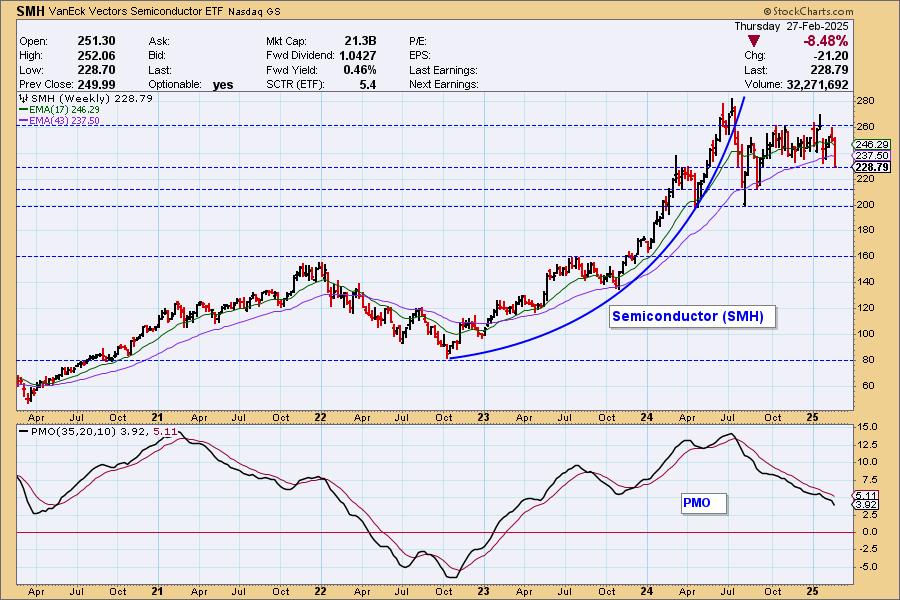
We have seen this SMH weekly chart recently. A parabolic arc has been violated, but SMH appears to have entered a high-level consolidation. This is long-term neutral.
The DecisionPoint Alert Weekly Wrap presents an end-of-week assessment of the trend and condition of the Stock Market, the U.S. Dollar, Gold, Crude Oil, and Bonds. The DecisionPoint Alert daily report (Monday through Thursday) is abbreviated and gives updates on the Weekly Wrap assessments.
Watch the latest episode of DecisionPoint on our YouTube channel here!
MARKET/INDUSTRY GROUP/SECTOR INDEXES
CLICK HERE for Carl's annotated Market Index, Sector, and Industry Group charts.
THE MARKET (S&P 500)
IT Trend Model: BUY as of 8/14/2024
LT Trend Model: BUY as of 3/29/2023
SPY 10-Minute Chart: The market churned the first part of the day, but a strong, deliberate decline began after lunch. Price closed near the lows for the day. The 10-minute PMO is declining below the zero line so we would expect more decline tomorrow.
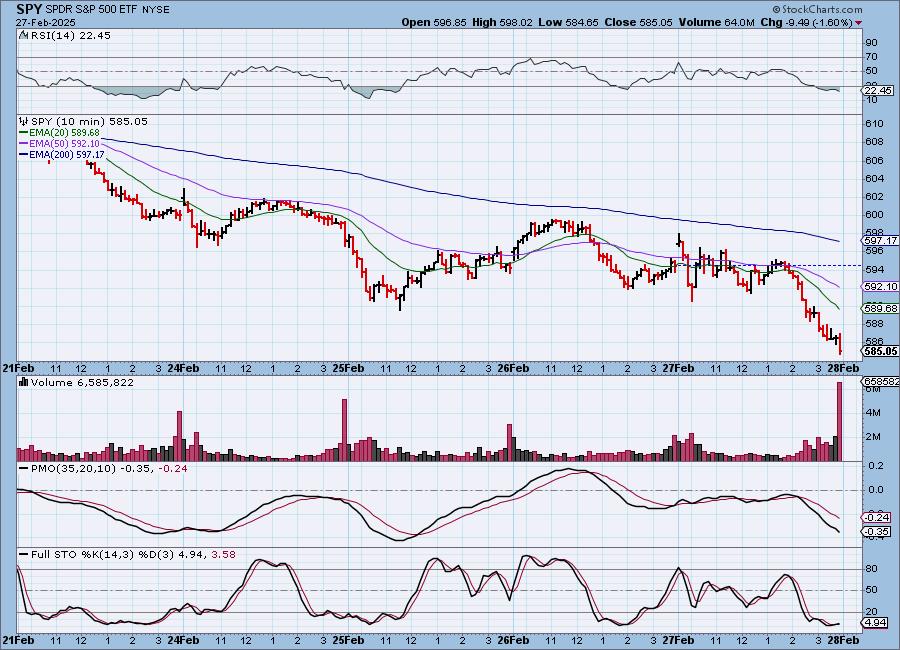
SPY Daily Chart: Support was violated today with a big bearish filled red candlestick. The PMO continues to decline toward the zero line. The RSI is very negative, but hasn't reached oversold territory yet.
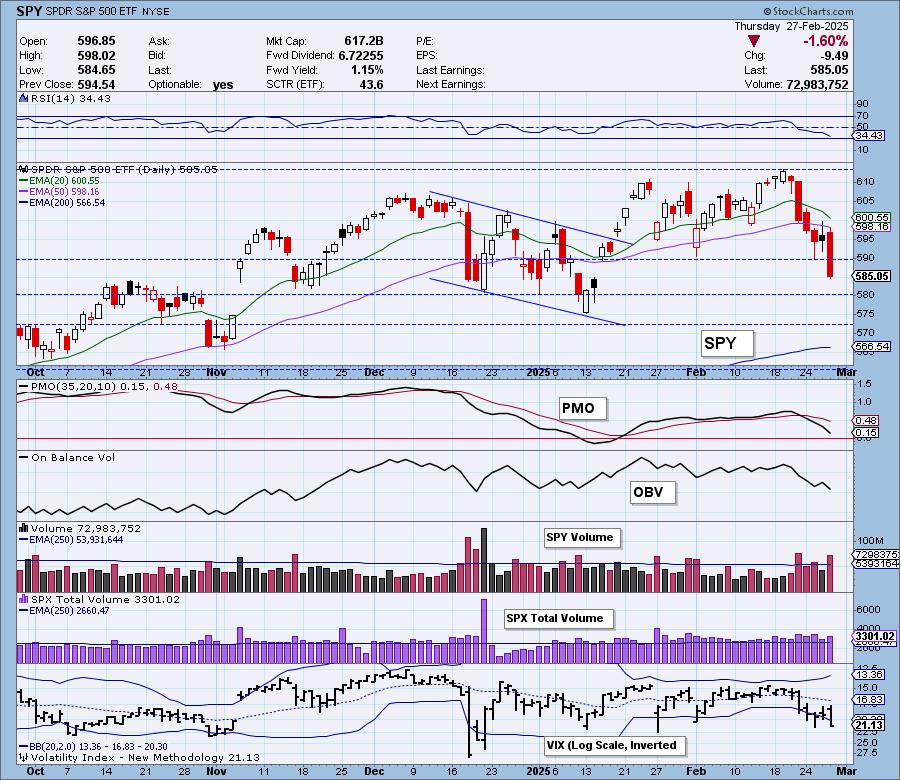
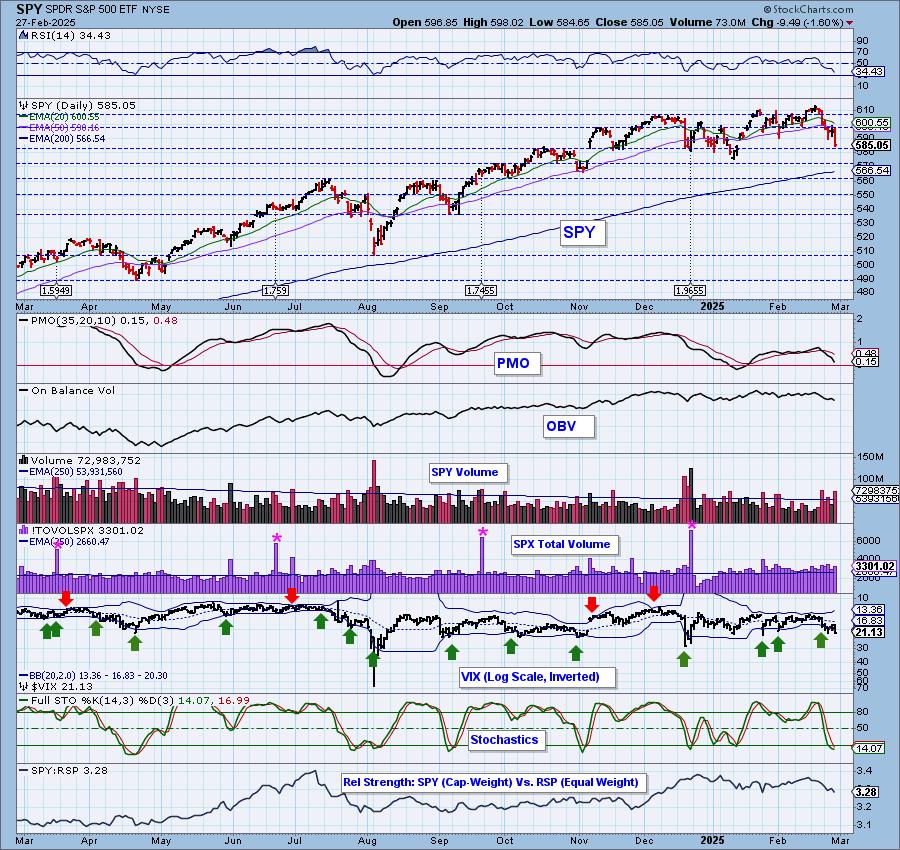
The VIX penetrated the lower Bollinger Band on the inverted scale again as investors started to worry on the continuation of the current decline. As we have been mentioning, many times these downside punctures lead to upside reversals, but readings aren't that oversold right now. Stochastics are declining below 20 which is a sign of significant internal weakness. Mega-caps are weakening based on the relative strength line to equal-weight RSP.

Here is the latest recording from 2/24. Click HERE to get to our video list.:
S&P 500 New 52-Week Highs/Lows: New Highs did expand, but we suspect many of those New Highs were lost by day's end. New Lows increased a great deal. The High-Low Differential is rising but it remains flat for now. We wouldn't read too much into this current advance.
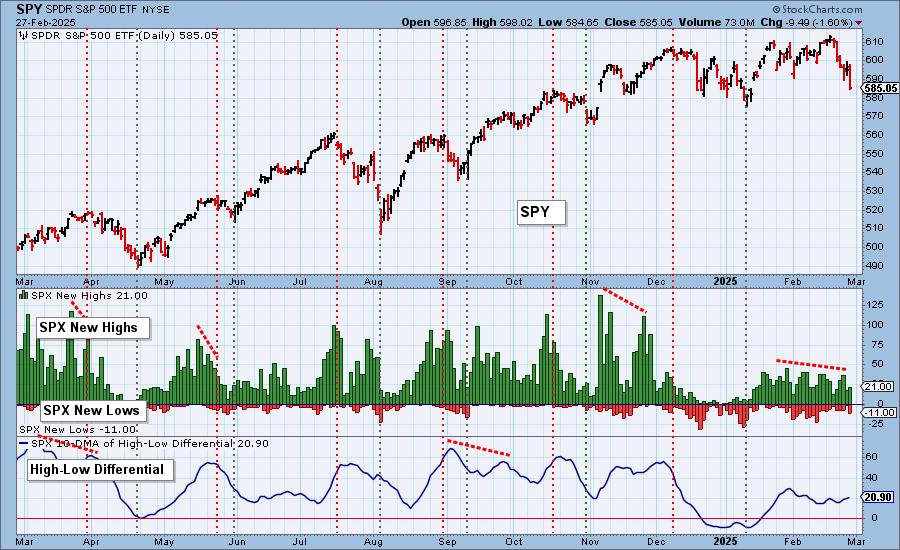
Climax* Analysis: There was only one climax reading today, and SPX Total Volume, while above average, did not approach blowout levels, so it is not likely that today's decline is the bottom for this decline.
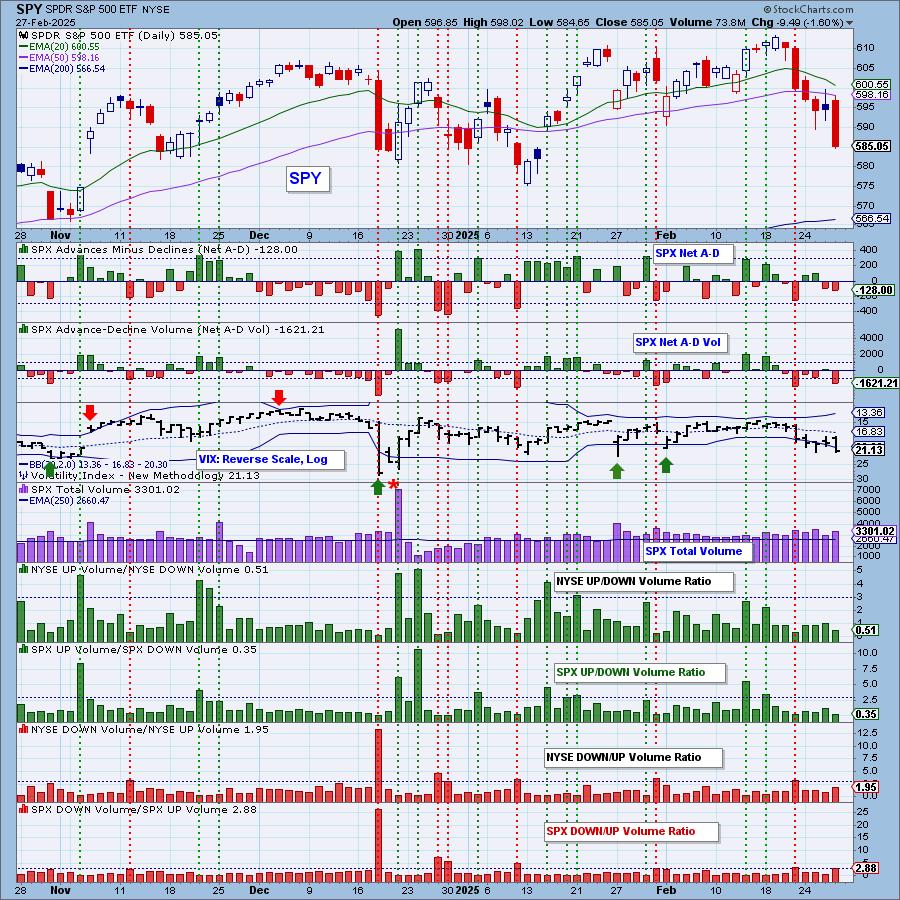
*A climax is a one-day event when market action generates very high readings in, primarily, breadth and volume indicators. We also include the VIX, watching for it to penetrate outside the Bollinger Band envelope. The vertical dotted lines mark climax days -- red for downside climaxes, and green for upside. Climaxes are at their core exhaustion events; however, at price pivots they may be initiating a change of trend.
Short-Term Market Indicators: The short-term market trend is DOWN and the condition is NEUTRAL.
Swenlin Trading Oscillators (STOs) are declining quickly now. The STO-V has reached oversold territory, but as we can see, it could easily move lower than where it is right now. More participation was sucked out of the market keeping the declining trend intact. We also lost more rising momentum within the index. All of these indicators hold negative divergences with price.
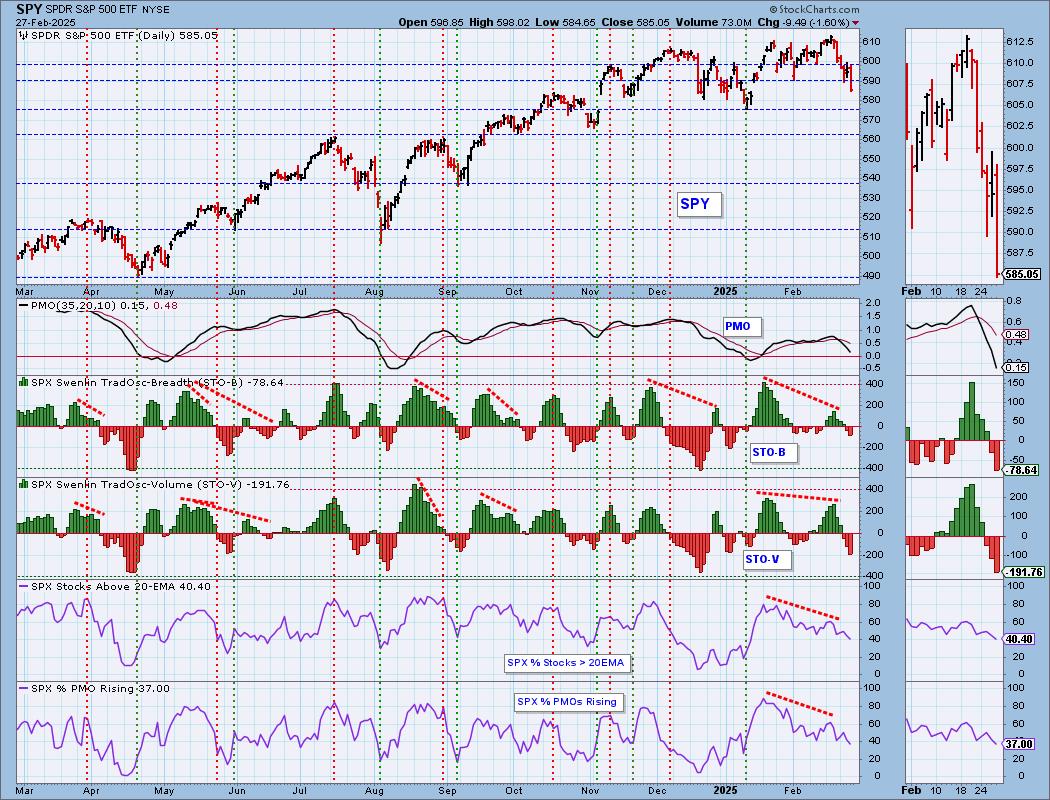
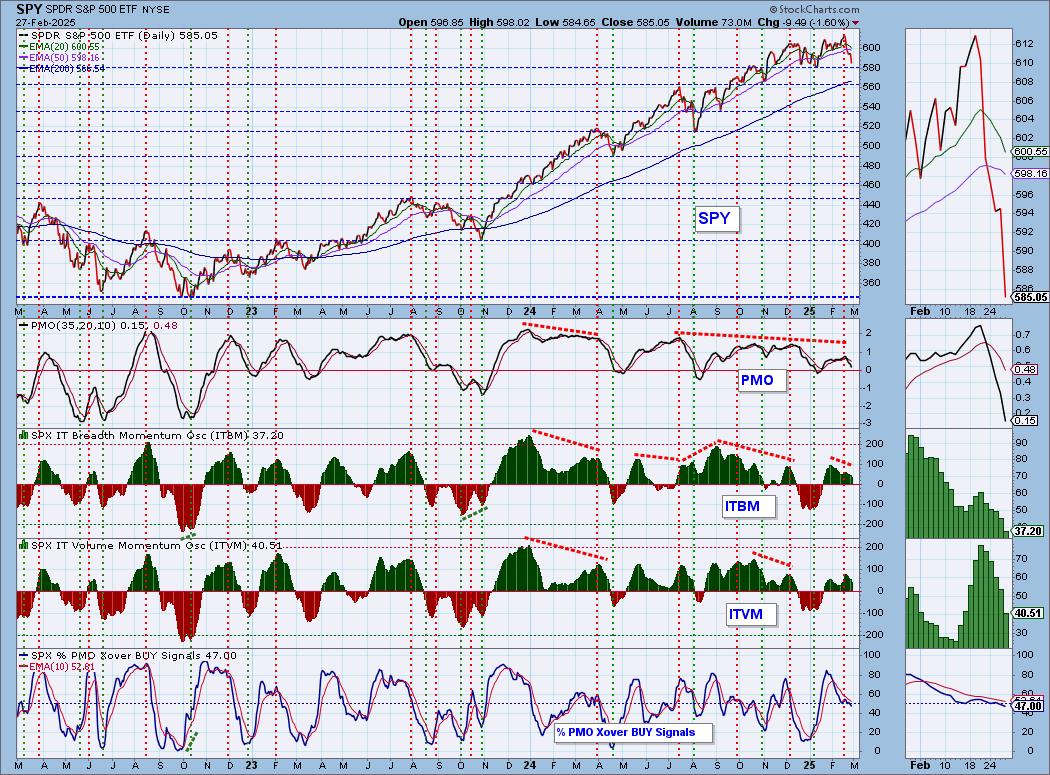
Intermediate-Term Market Indicators: The intermediate-term market trend is UP and the condition is NEUTRAL.
The ITBM and ITVM also declined significantly today. We now see that %PMO Xover BUY Signals has dropped below our bullish 50% threshold. We would say that both the ITBM and %PMO Xover BUY Signals show negative divergences with price.
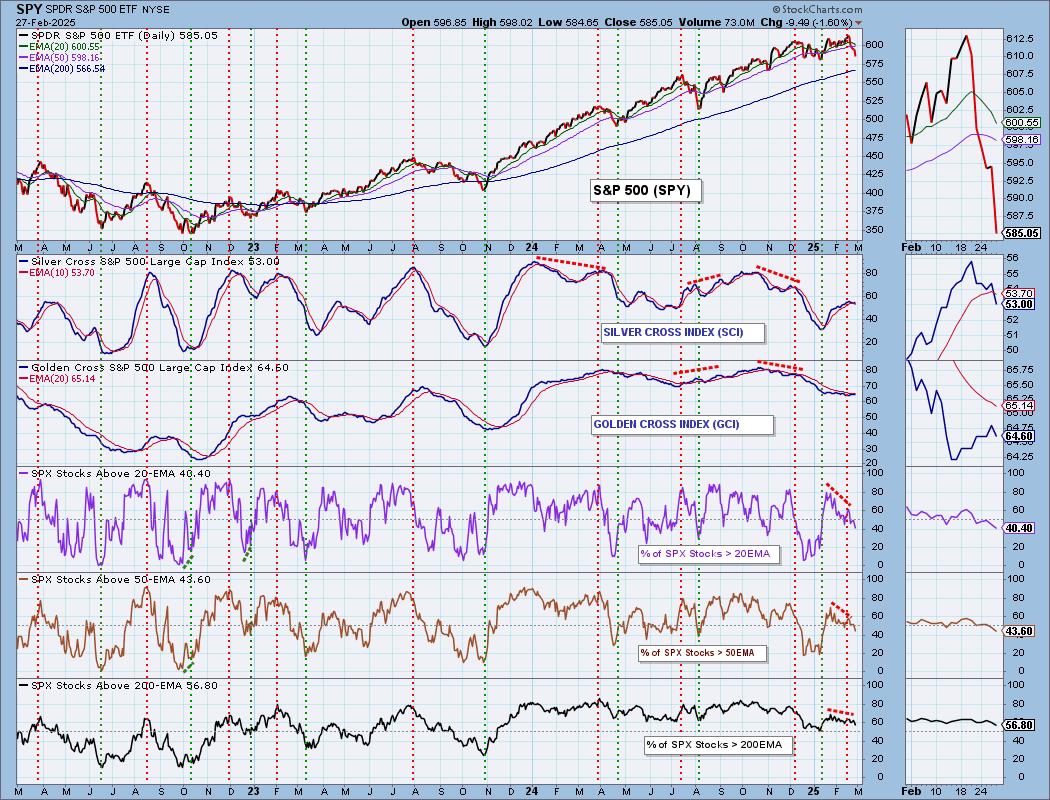
PARTICIPATION CHART (S&P 500): The following chart objectively shows the depth and trend of participation for the SPX in two time frames.
- Intermediate-Term - the Silver Cross Index (SCI) shows the percentage of SPX stocks on IT Trend Model BUY signals (20-EMA > 50-EMA). The opposite of the Silver Cross is a "Dark Cross" -- those stocks are, at the very least, in a correction.
- Long-Term - the Golden Cross Index (GCI) shows the percentage of SPX stocks on LT Trend Model BUY signals (50-EMA > 200-EMA). The opposite of a Golden Cross is the "Death Cross" -- those stocks are in a bear market.
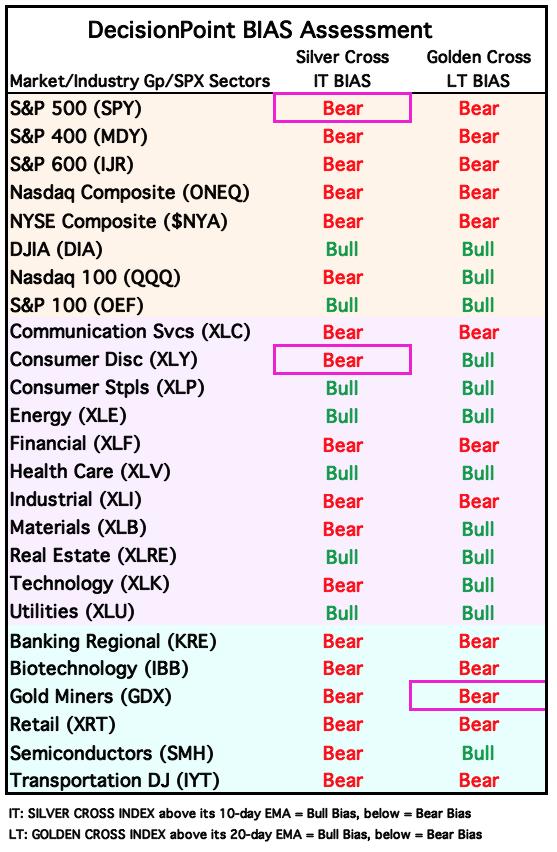
The intermediate-term market bias is BEARISH.
The long-term market bias is BEARISH.
Big news today! The Silver Cross Index saw a Bearish Shift across the signal line today which has now moved the IT Bias to BEARISH. The Golden Cross Index topped today. It is below its signal line so the LT Bias is still BEARISH. We have negative divergences on participation of stocks above key moving averages.
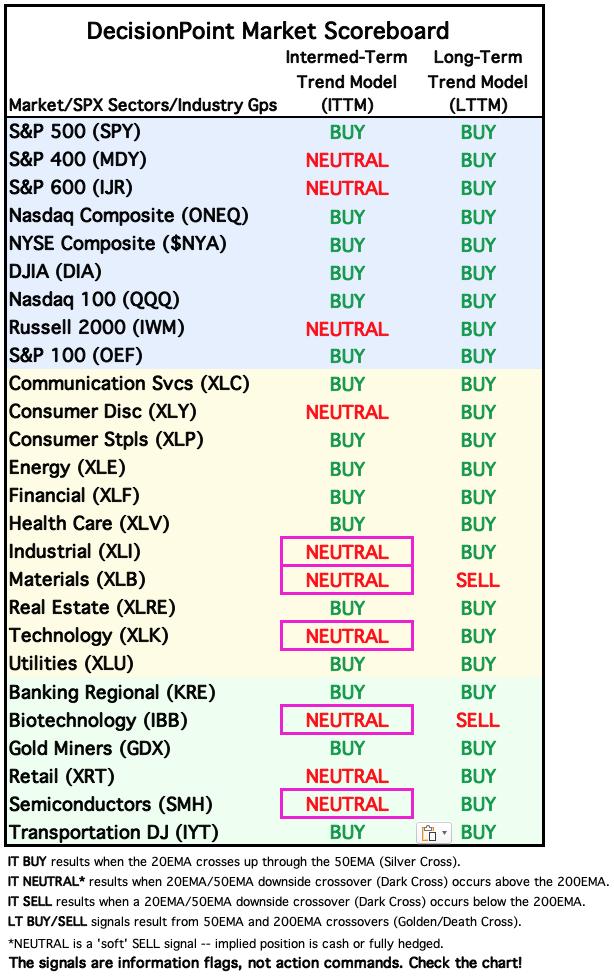
BIAS Assessment: The following table expresses the current BIAS of various price indexes based upon the relationship of the Silver Cross Index to its 10-day EMA (intermediate-term), and of the Golden Cross Index to its 20-day EMA (long-term). When the Index is above the EMA it is bullish, and it is bearish when the Index is below the EMA. The BIAS does not imply that any particular action should be taken. It is information to be used in the decision process.
The items with highlighted borders indicate that the BIAS changed today.
*****************************************************************************************************
CONCLUSION: The Bias Table above is seeing more and more Bear Biases which is short-term bearish overall. Today the Silver Cross Index had a Bearish Shift across the signal line moving the IT Bias to BEARISH. This goes alongside already declining primary indicators and negative divergences. The speed at which the decline picked up at the end of the day suggests to us that the decline is not over and could be just getting started. Key support levels were broken on XLK and SMH which tend to lead the market. In this case it would be down. Mega-caps are weakening and that will also put downside pressure on the index. We're looking for more decline.
Erin is 10% long, 0% short. (This is intended as information, not a recommendation.)
*****************************************************************************************************
CALENDAR

Have you subscribed the DecisionPoint Diamonds yet? DP does the work for you by providing handpicked stocks/ETFs from exclusive DP scans! Add it with a discount! Contact support@decisionpoint.com for more information!
BITCOIN
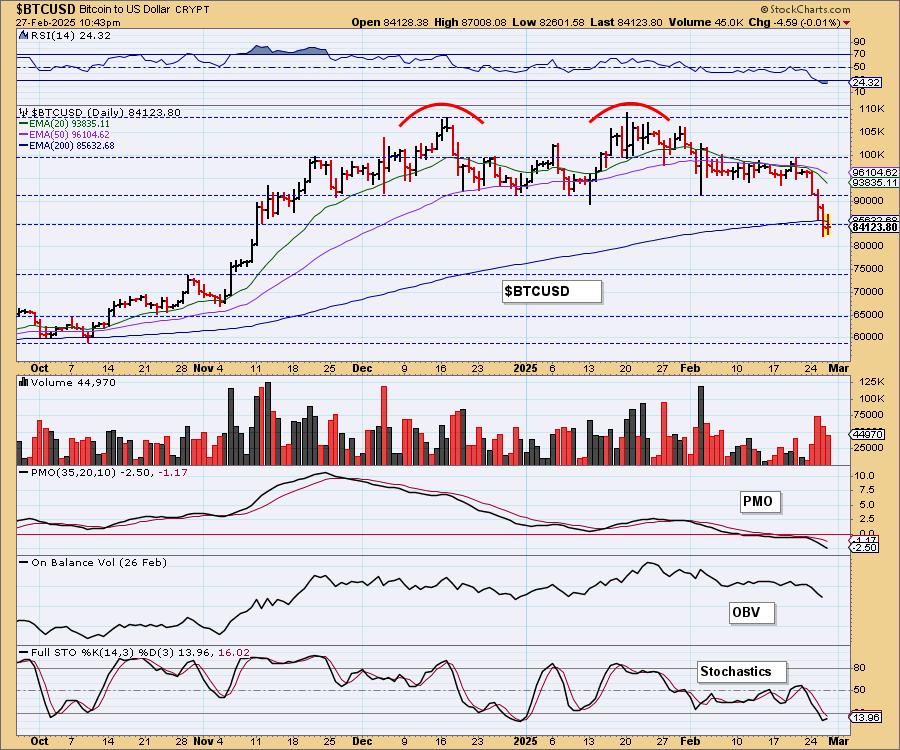
Yesterday's comments still apply:
"Bitcoin is correcting out of the bearish double top. Support was lost at 85,000 and the 200-day EMA today which suggests we will see it drop even further from here. The RSI is now in oversold territory which generally leads to upside reversals, but that condition can persist in a lengthy decline which is what we suspect will happen here given the intensity of the breakdown. Stochastics have dropped below 20 adding insult to injury. Next line of support is at 75,000. That would be the minimum downside target of the double top pattern."
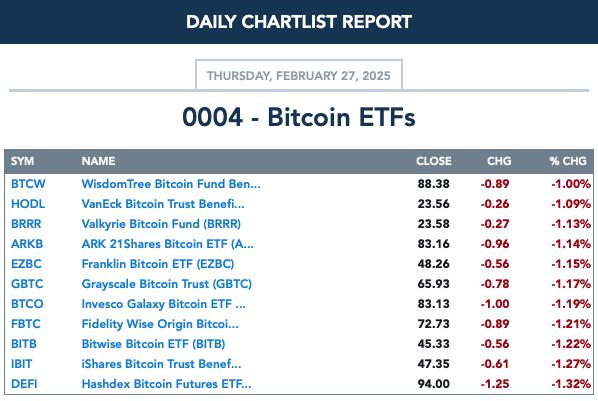
BITCOIN ETFs
INTEREST RATES
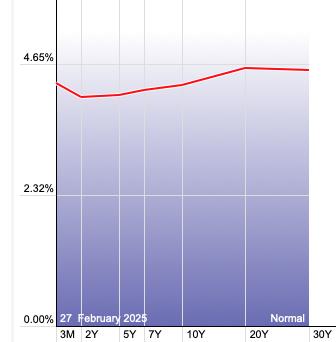
Long-term yields tipped upward today, but it doesn't look like this will be a bottom given the declining trends. We expect them to move back down.
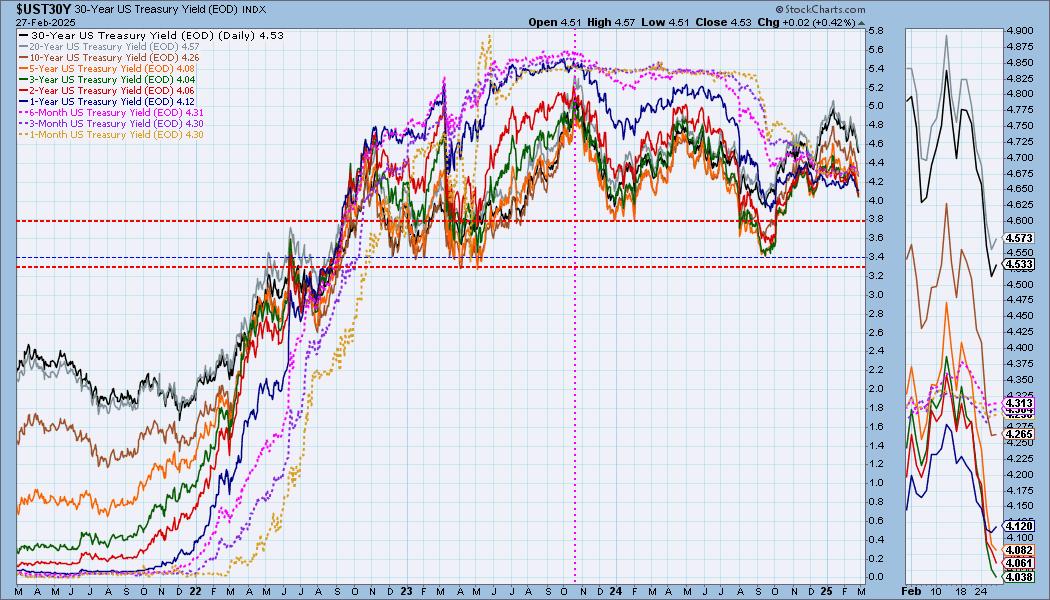
The Yield Curve Chart from StockCharts.com shows us the inversions taking place. The red line should move higher from left to right. Inversions are occurring where it moves downward.
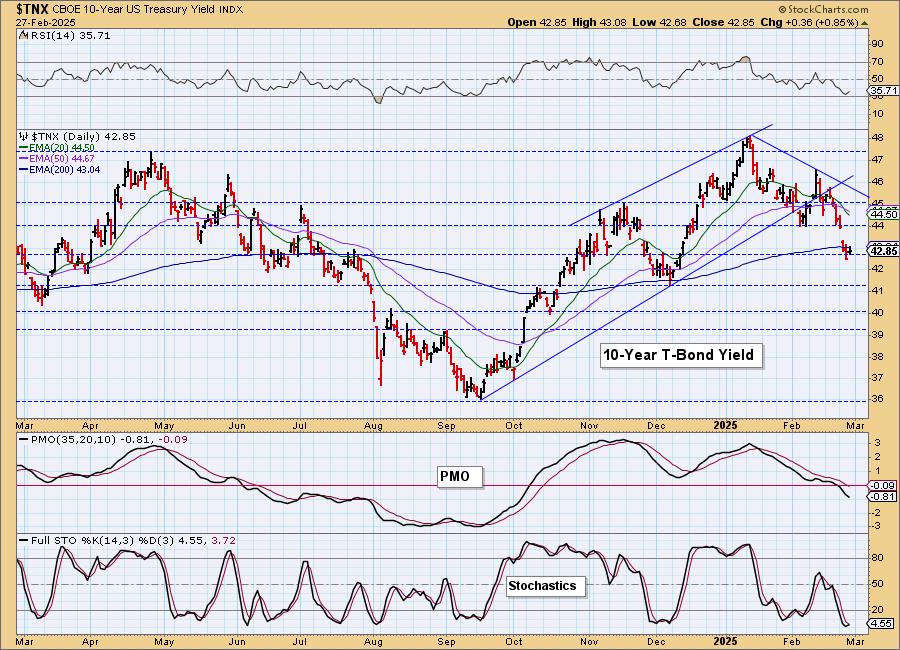
10-YEAR T-BOND YIELD
$TNX held support today so maybe we will see some sideways movement along support. Stochastics did tip upward. However, the RSI and PMO look very bearish so ultimately we do expect this support level to be broken.
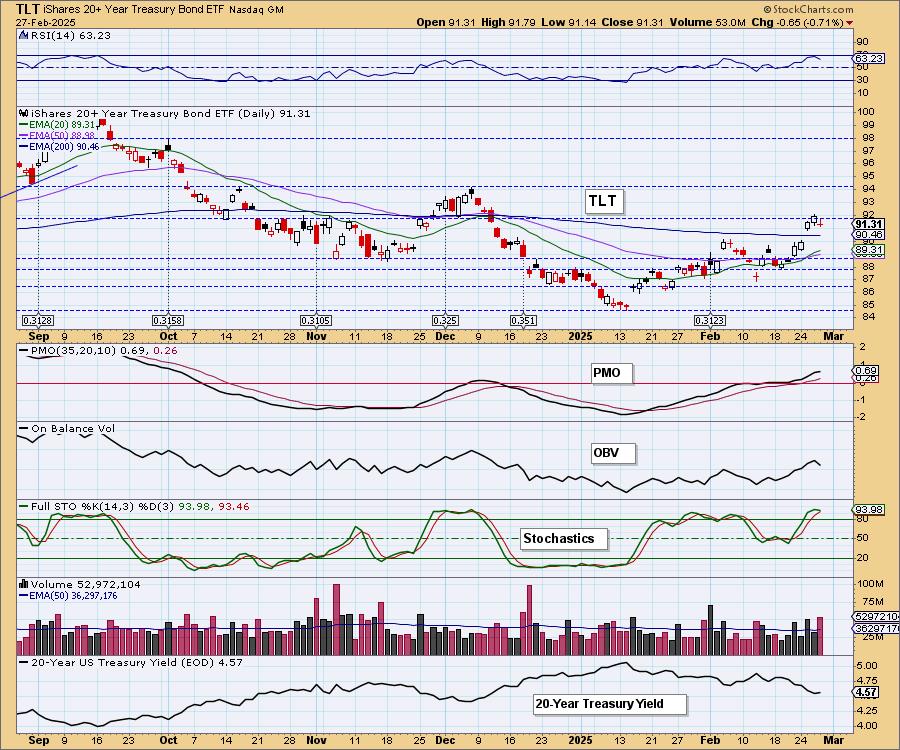
BONDS (TLT)
IT Trend Model: BUY as of 2/25/2025
LT Trend Model: SELL as of 12/13/2024
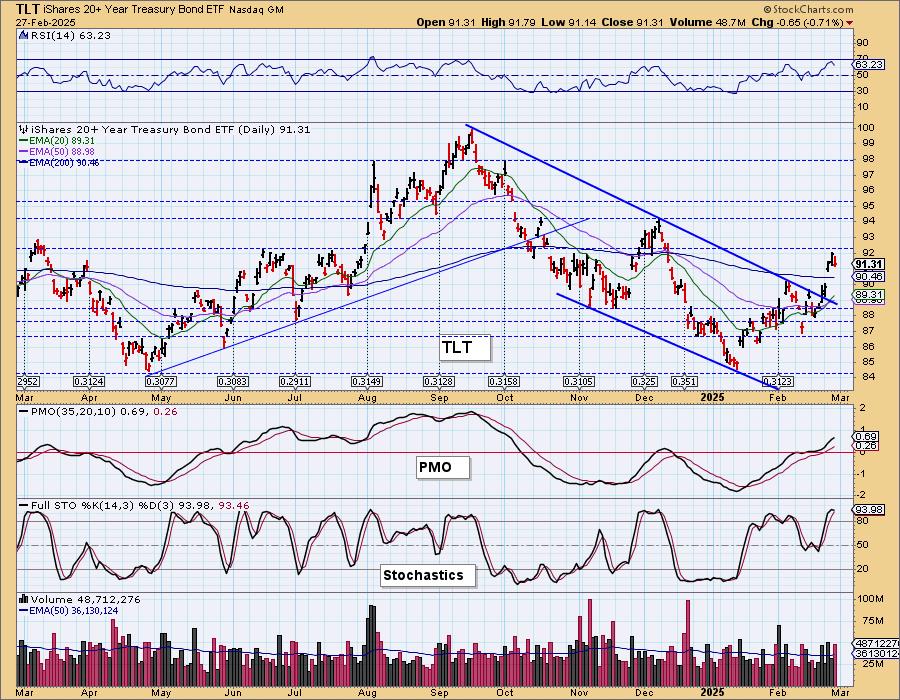
TLT Daily Chart: The 20-year yield spoiled TLT's rally, but the chart still looks very bullish. The decline prevented the RSI from getting overbought. Stochastics did top, but they are still above 80 flashing internal strength. We expect the current level of overhead resistance to be broken.
We now have a breakout from the longer-term declining trend channel which does imply more upside to go. 92.50 is arriving as overhead resistance, but we would look for price to get back to about 94 before turning back down.
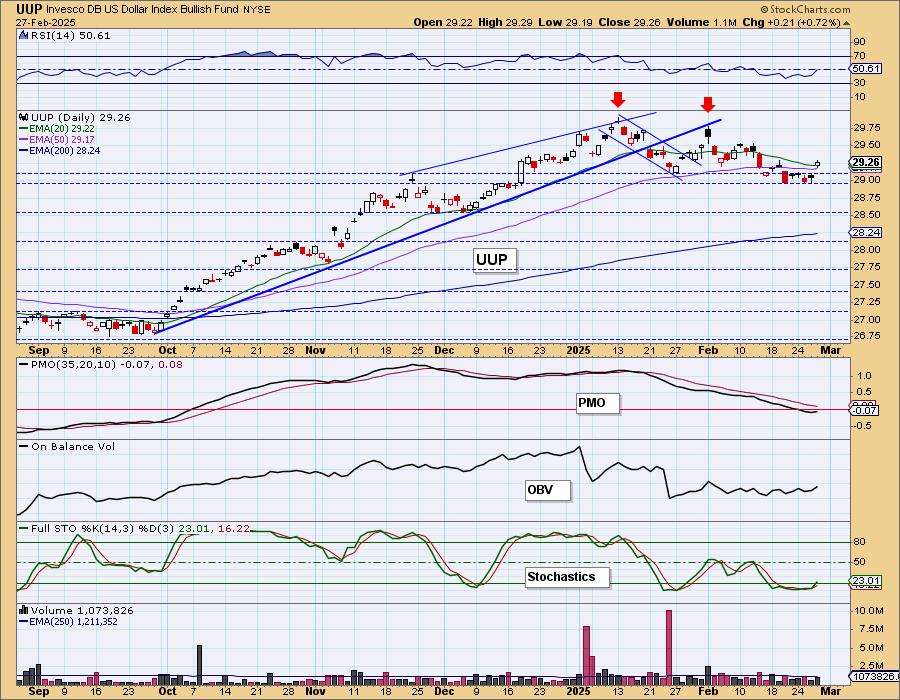
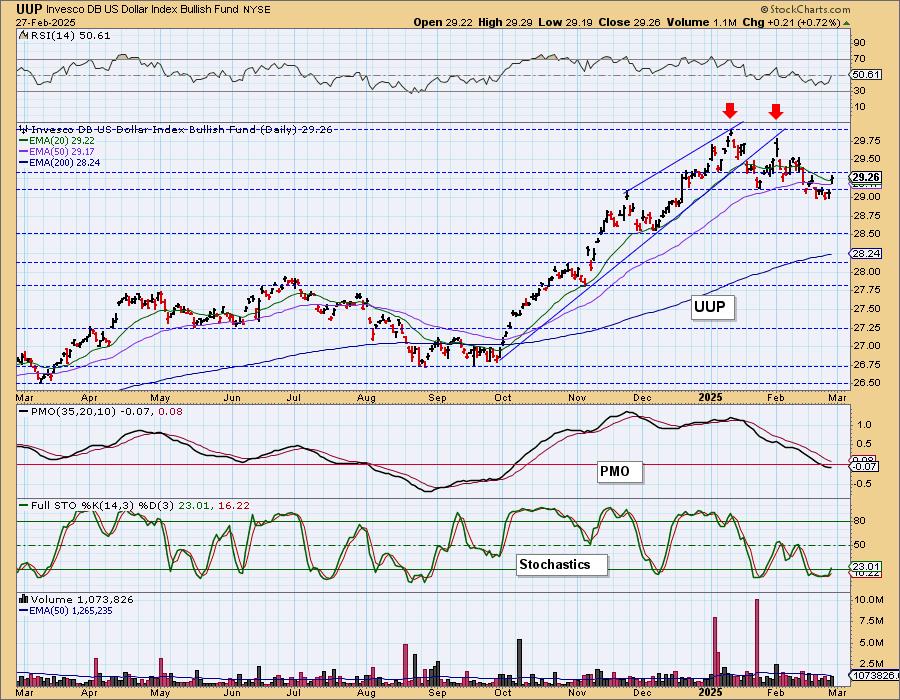
DOLLAR (UUP)
IT Trend Model: BUY as of 10/9/2024
LT Trend Model: BUY as of 5/25/2023
UUP Daily Chart: It was said that tariffs were the culprit for a rising Dollar. The bearish double top still suggests we'll see the Dollar breakdown, but the declining trend out of the second top was broken today. The RSI is now positive and the PMO has turned back up. Stochastics are also rising. We've been looking for more decline but this change in the indicators and tariff talk could keep this rally going.
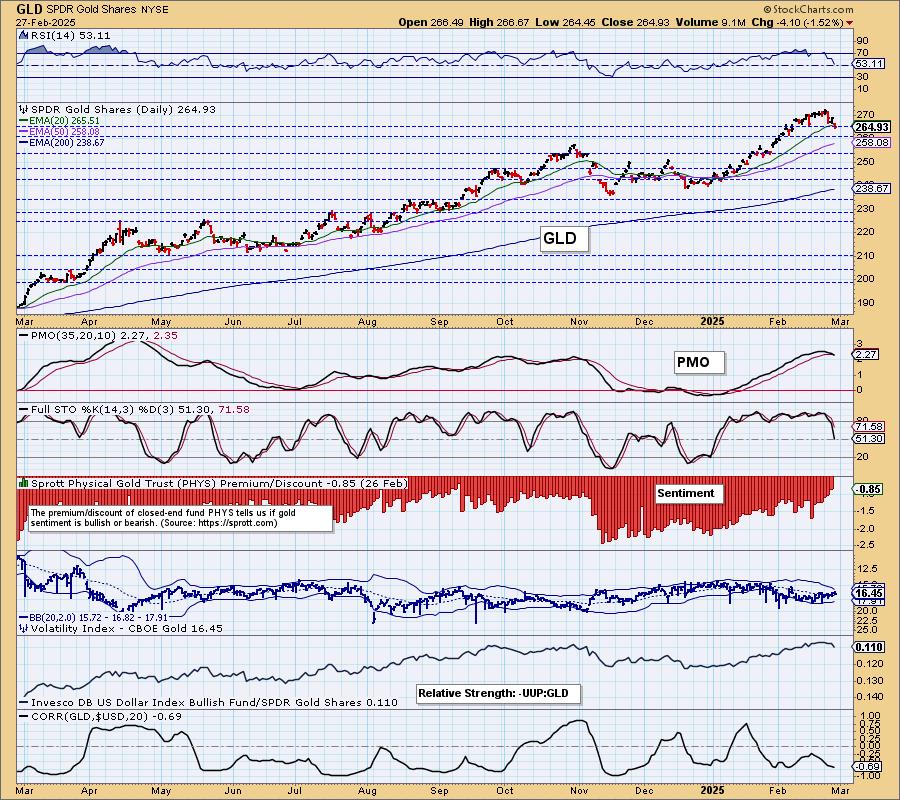
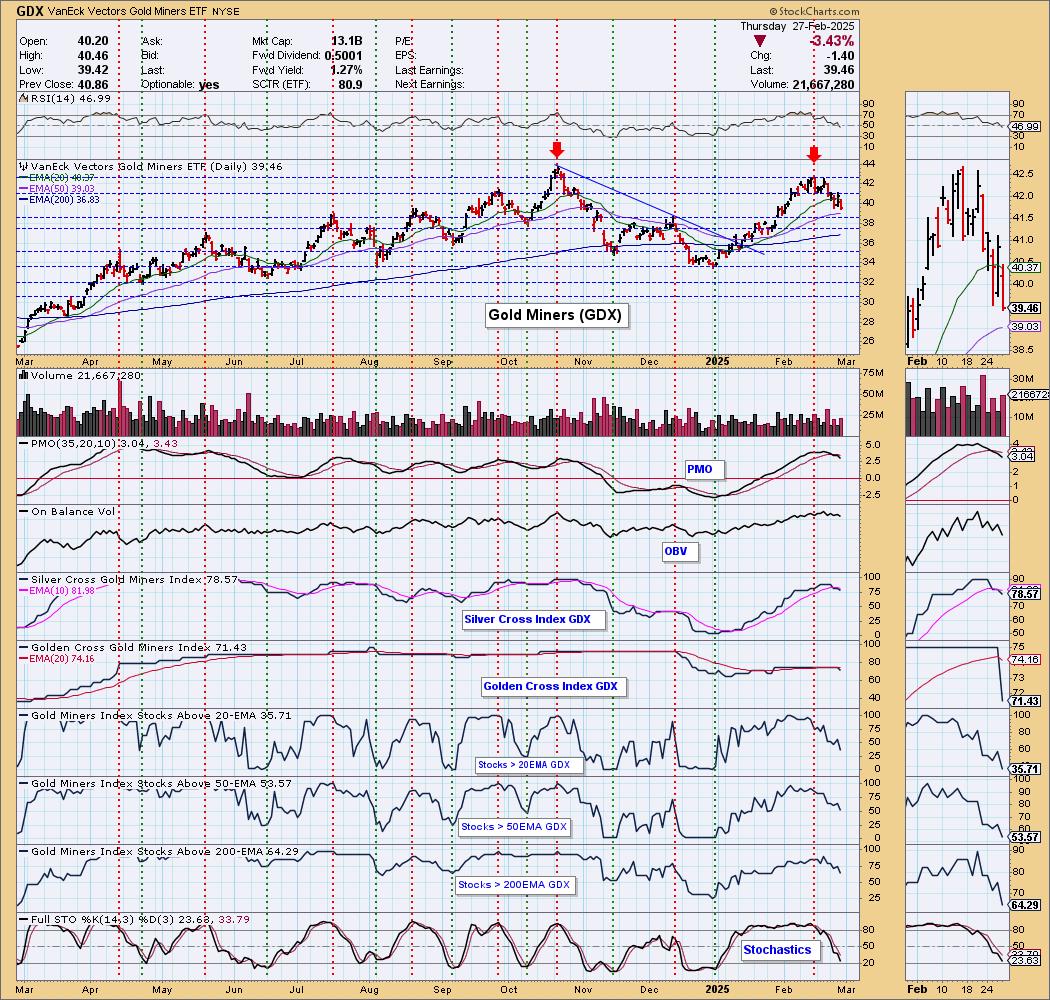
GOLD
IT Trend Model: BUY as of 1/10/2025
LT Trend Model: BUY as of 10/20/2023
GLD Daily Chart: The Dollar's new strength is a problem for Gold. It lost the longer-term rising trend. It had run hot for some time so we have been expecting this decline. We have a new PMO Crossover SELL Signal so we suspect the decline will take price to the 50-day EMA.
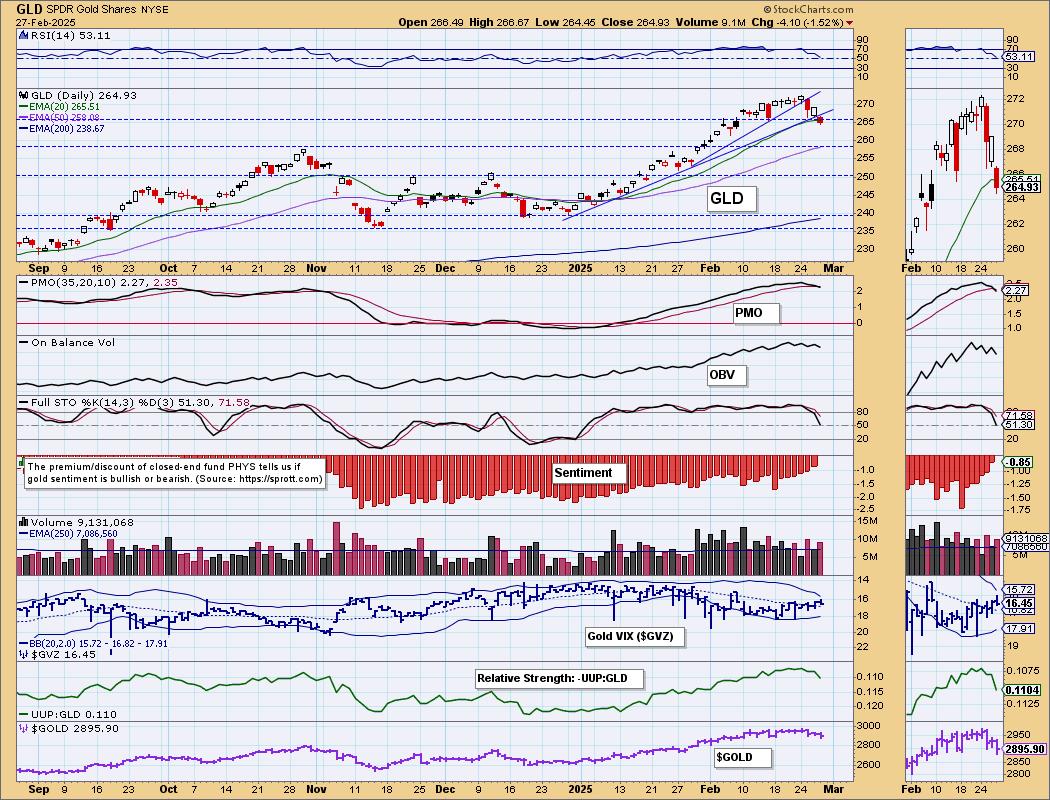
The Dollar's new strength is a problem given the correlation between the two is its normal inverse. Notice also that Gold's relative strength line is back in decline. We would look for more downside.
GOLD MINERS (GDX) Daily Chart: Participation has really pared back and is declining trends. Given the bearish look of Gold, we have to expect more downside from this industry group. The large double top pattern is ominous as the height of that pattern would mean a very low minimum downside target. We aren't sure we'll see that much decline, but it certainly makes the chart especially bearish.
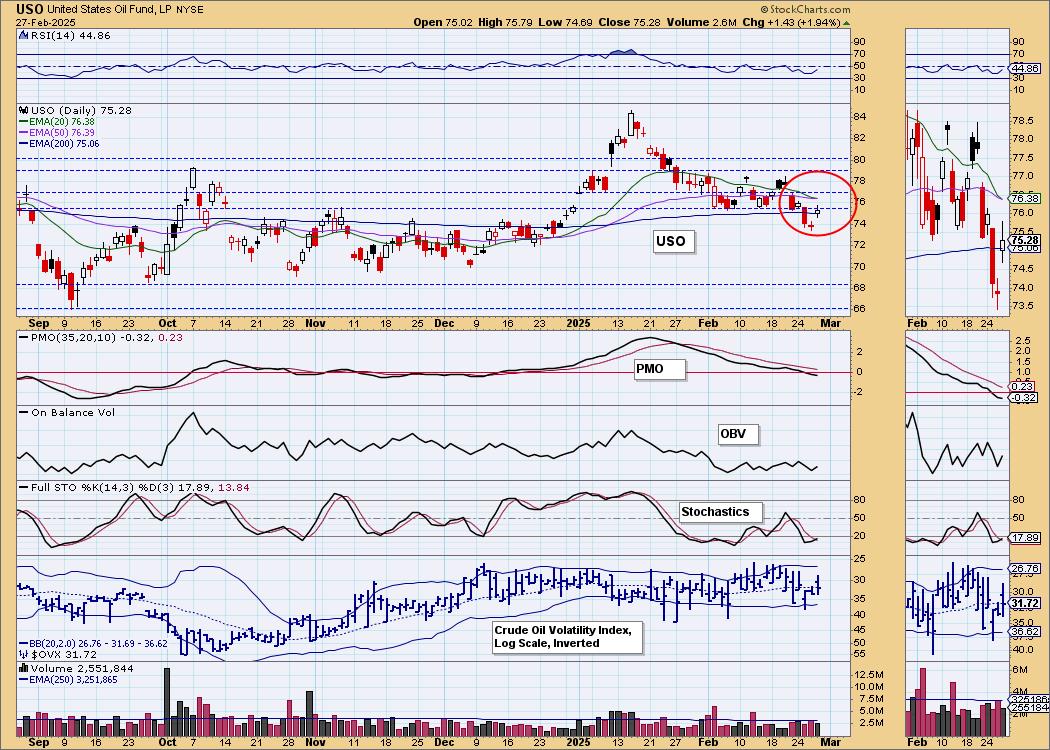
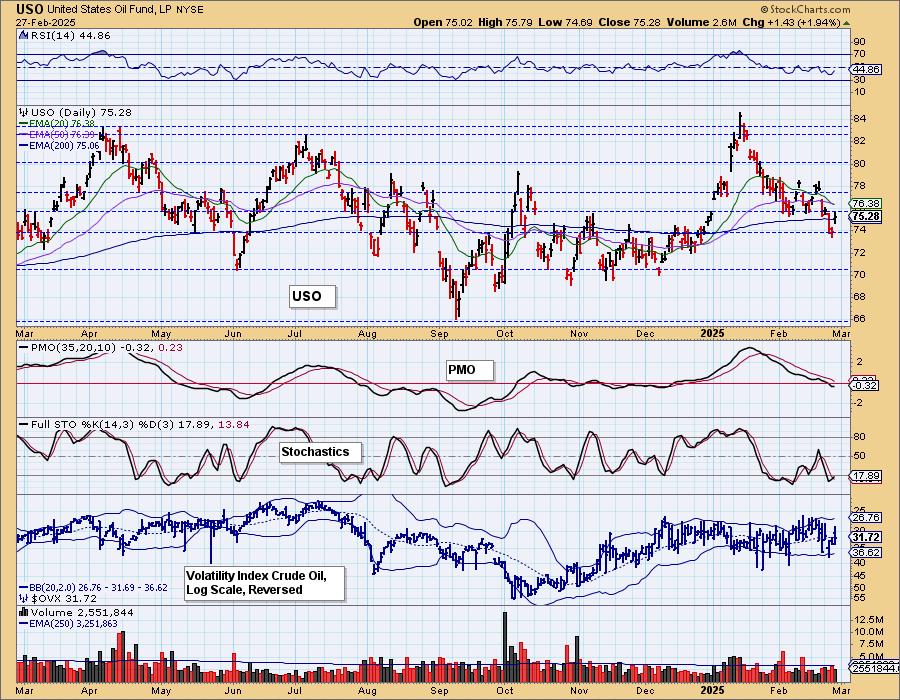
CRUDE OIL (USO)
IT Trend Model: BUY as of 12/24/2024
LT Trend Model: BUY as of 1/10/2025
USO Daily Chart: Today the United States Oil Fund (USO) 20-day EMA crossed down through the 50-day EMA (Dark Cross), above the 200-day EMA, generating an IT Trend Model NEUTRAL Signal. Crude did see a nice rally but with price below the 20/50-day EMAs, a Dark Cross could not be avoided. The declining trend is strong out of the January top. The PMO has dropped beneath the zero line and the RSI is negative. We doubt this rally will catch hold.
Good Luck & Good Trading!
Erin Swenlin and Carl Swenlin
Technical Analysis is a windsock, not a crystal ball. --Carl Swenlin
(c) Copyright 2025 DecisionPoint.com
Disclaimer: This blog is for educational purposes only and should not be construed as financial advice. The ideas and strategies should never be used without first assessing your own personal and financial situation, or without consulting a financial professional. Any opinions expressed herein are solely those of the author, and do not in any way represent the views or opinions of any other person or entity.
DecisionPoint is not a registered investment advisor. Investment and trading decisions are solely your responsibility. DecisionPoint newsletters, blogs or website materials should NOT be interpreted as a recommendation or solicitation to buy or sell any security or to take any specific action.
NOTE: The signal status reported herein is based upon mechanical trading model signals, specifically, the DecisionPoint Trend Model. They define the implied bias of the price index based upon moving average relationships, but they do not necessarily call for a specific action. They are information flags that should prompt chart review. Further, they do not call for continuous buying or selling during the life of the signal. For example, a BUY signal will probably (but not necessarily) return the best results if action is taken soon after the signal is generated. Additional opportunities for buying may be found as price zigzags higher, but the trader must look for optimum entry points. Conversely, exit points to preserve gains (or minimize losses) may be evident before the model mechanically closes the signal.
Helpful DecisionPoint Links:
DecisionPoint Alert Chart List
DecisionPoint Golden Cross/Silver Cross Index Chart List
DecisionPoint Sector Chart List
Price Momentum Oscillator (PMO)