
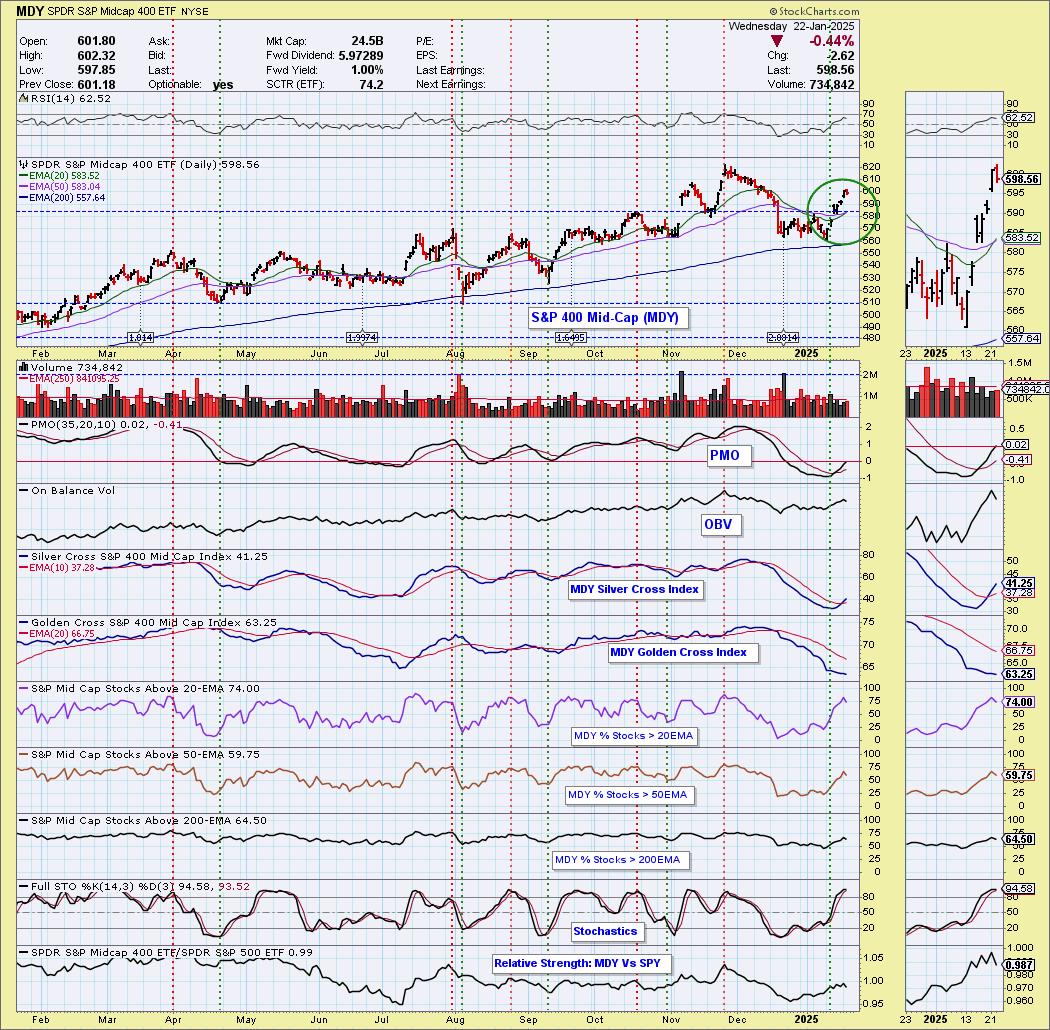
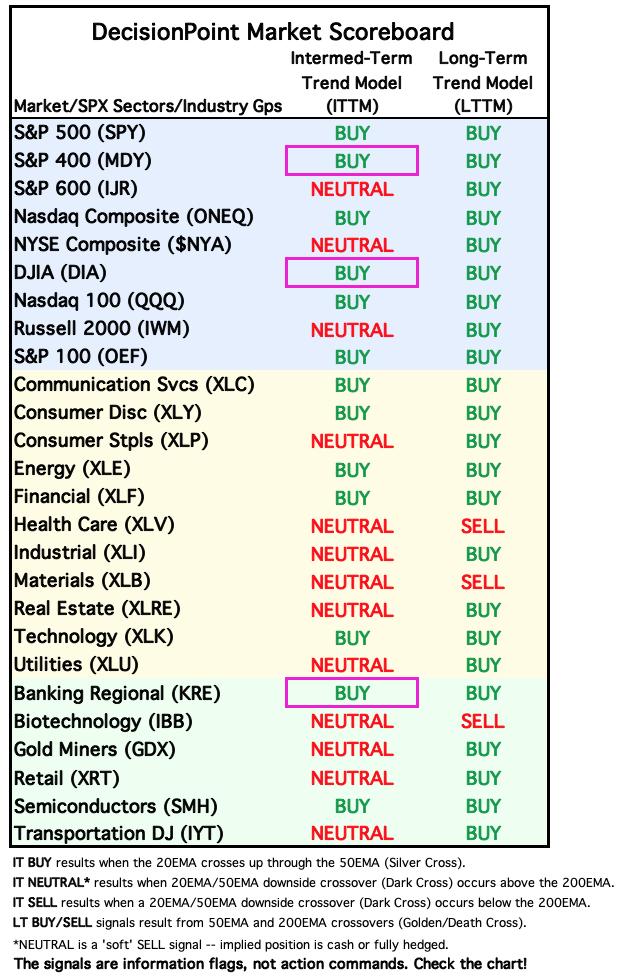
Today the S&P 400 Mid-Cap ETF (MDY) 20-day EMA crossed up through the 50-day EMA (Silver Cross), generating an IT Trend Model BUY Signal. This is a nice breakout rally that could see followthrough based on the now positive PMO and mostly healthy participation levels. The Silver Cross Index has had a Bull Shift across its signal line.
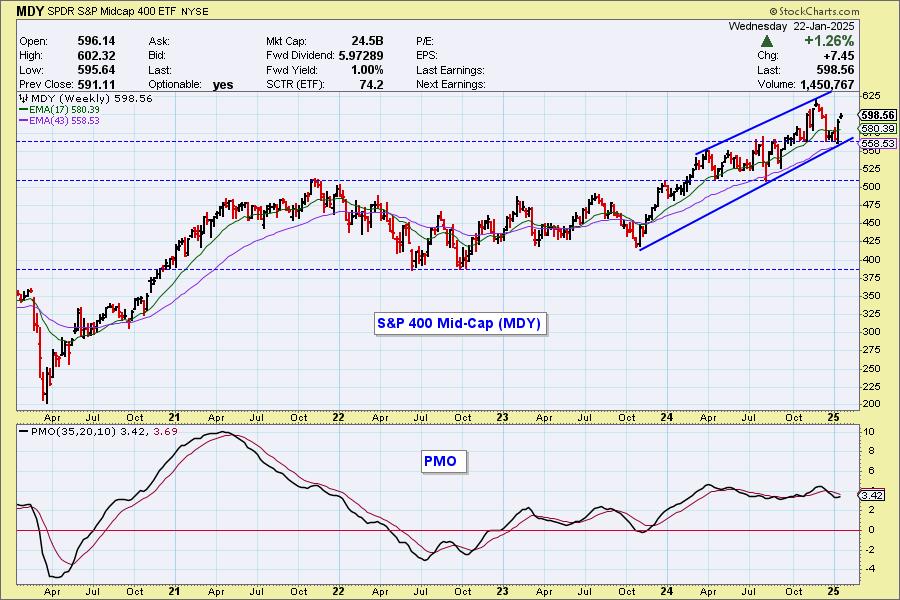
The MDY weekly chart is very bullish, with price in a rising trend channel, and the weekly PMO moving sideways well above the zero line.
__________
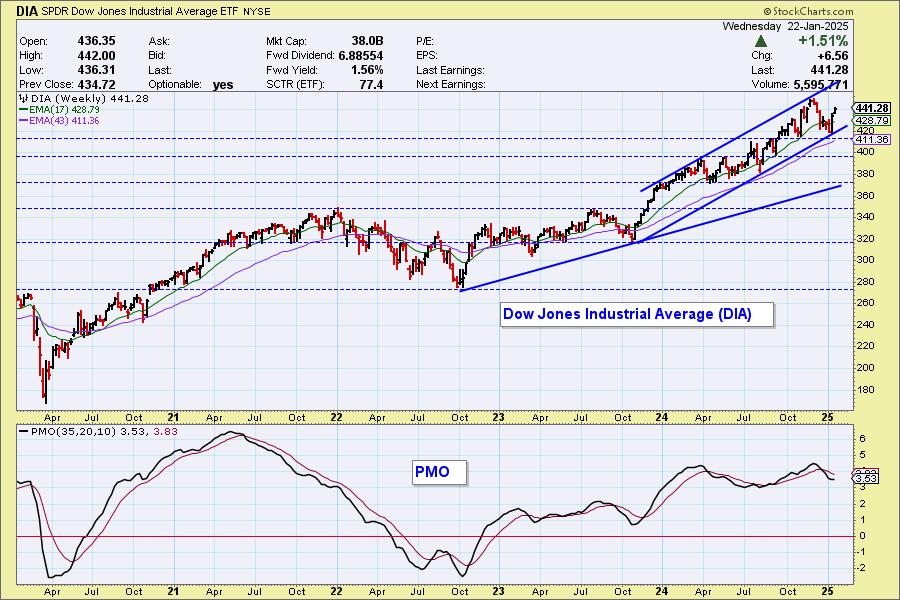
Also today the Dow Jones Industrial Average ETF (DIA) 20-day EMA crossed up through the 50-day EMA (Silver Cross), generating an IT Trend Model BUY Signal. This looks like a fairly convincing rally especially given the positive PMO configuration and Silver Cross Index Bull Shift across the signal line. It is still reading somewhat low, but given improving participation, we could see the index move higher from here.

The DIA weekly chart is also very bullish, with price in a rising trend channel, and the weekly PMO moving sideways well above the zero line.
___________
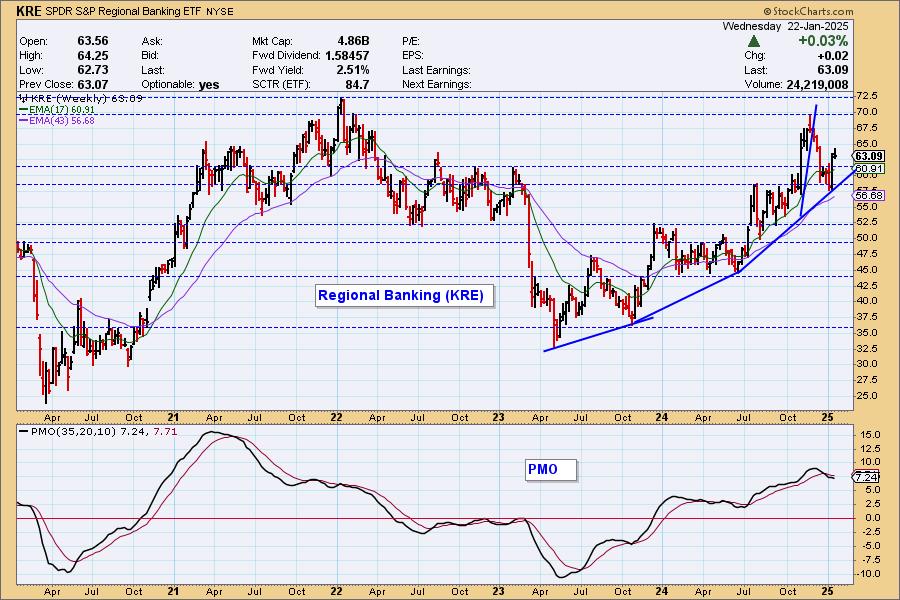
Finally, the Regional Banking ETF (KRE) 20-day EMA crossed up through the 50-day EMA (Silver Cross), generating an IT Trend Model BUY Signal. Today saw a pullback and that did damage participation somewhat so while this looks favorable alongside the Silver Cross Index Bull Shift, it could be setting up for some pullback.
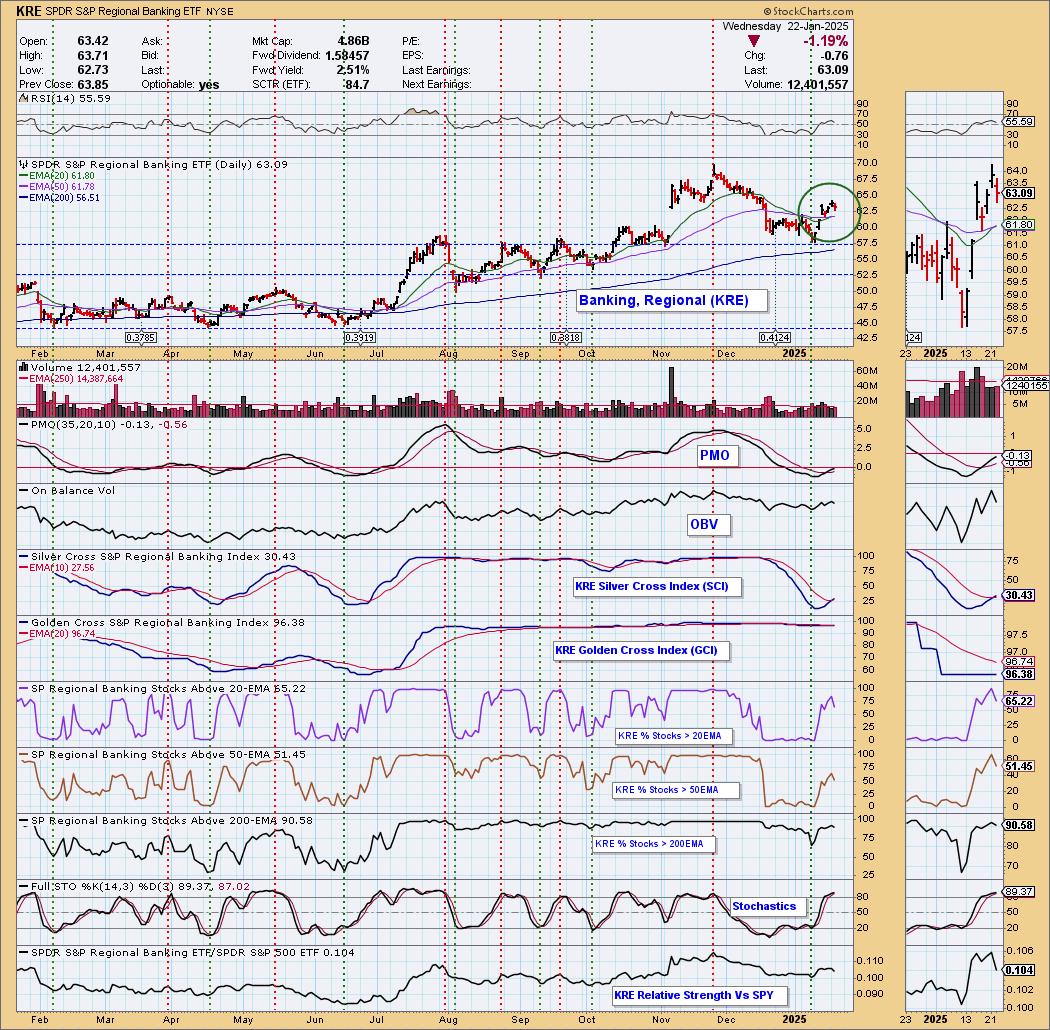
The weekly chart shows that KRE went vertical in the last quarter on 2024. After a correction to moderate the rate of ascent, KRE has resumed its rising trend.The weekly PMO is well above the zero line and is close to turning up again. The chart is bullish.
The DecisionPoint Alert Weekly Wrap presents an end-of-week assessment of the trend and condition of the Stock Market, the U.S. Dollar, Gold, Crude Oil, and Bonds. The DecisionPoint Alert daily report (Monday through Thursday) is abbreviated and gives updates on the Weekly Wrap assessments.
Watch the latest episode of DecisionPoint on our YouTube channel here!
MARKET/INDUSTRY GROUP/SECTOR INDEXES
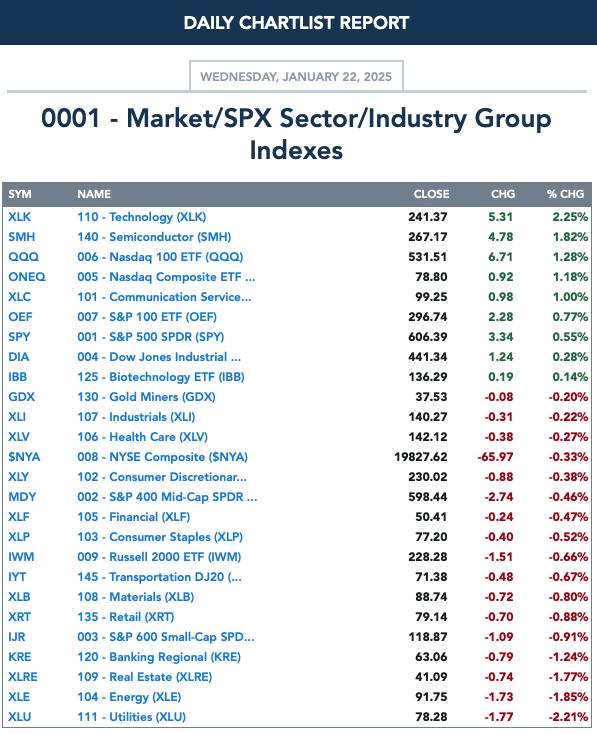
CLICK HERE for Carl's annotated Market Index, Sector, and Industry Group charts.
THE MARKET (S&P 500)
IT Trend Model: BUY as of 8/14/2024
LT Trend Model: BUY as of 3/29/2023
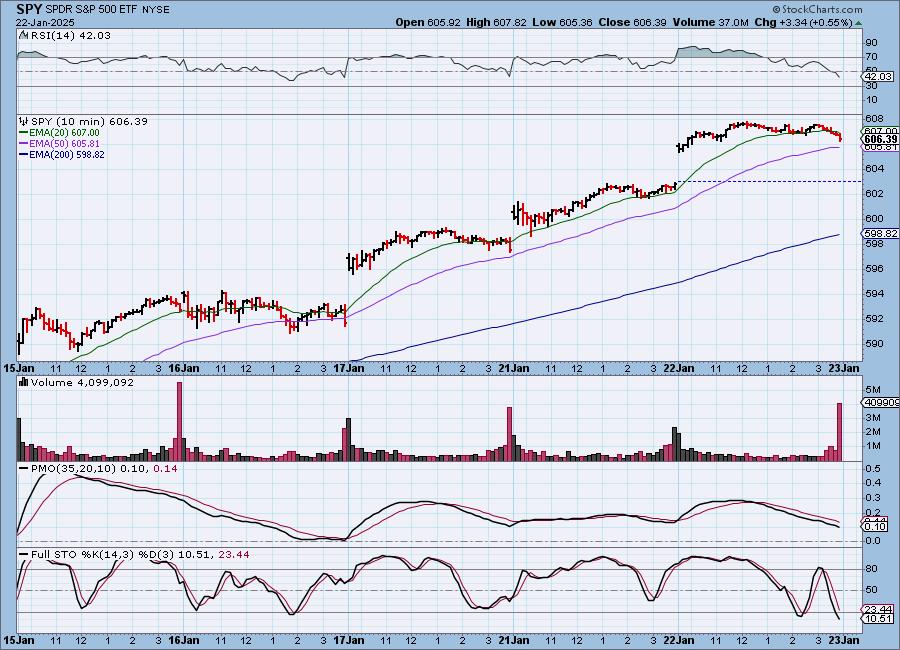
SPY 10-Minute Chart: Intraday the S&P 500 made new, all-time highs by a mere 0.84 of a point. It also closed at a new, all-time high (6090.27). Price did curl back down to finish the day and the 10-minute PMO is in decline.
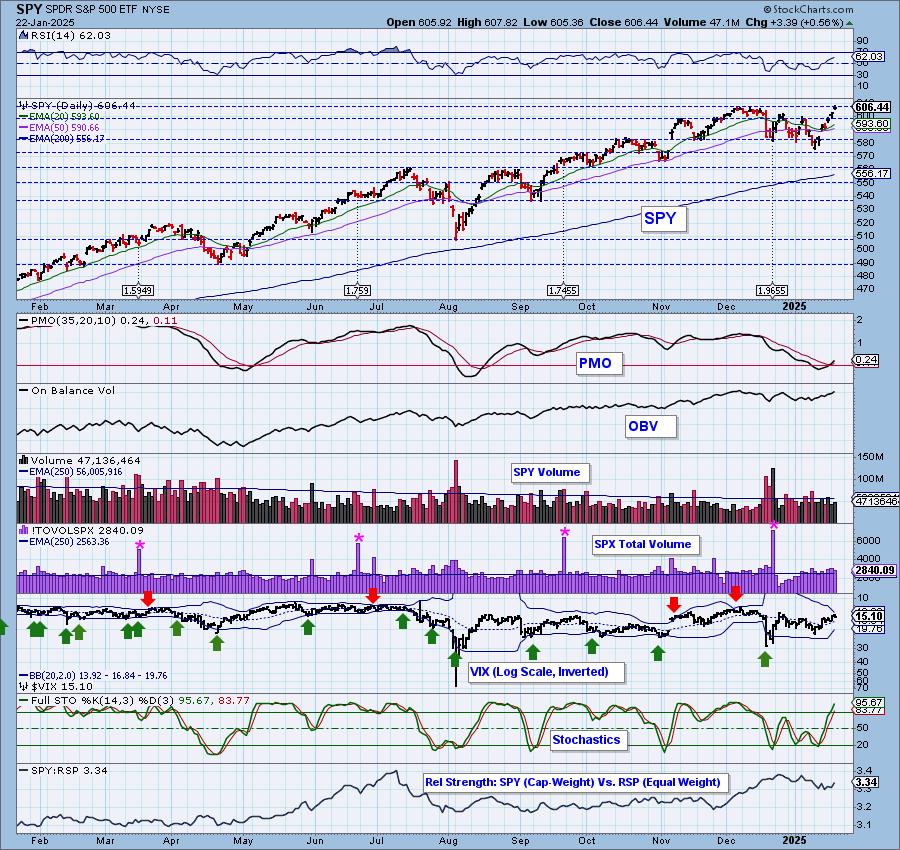
SPY Daily Chart: The rally continues to march on out of the declining trend channel. The RSI looks good as it isn't overbought yet despite hitting all-time highs. The PMO continues to rise on a Crossover BUY Signal. The OBV didn't quite overcome previous highs so there is a very slight reverse divergence as the OBV should make new highs with price.
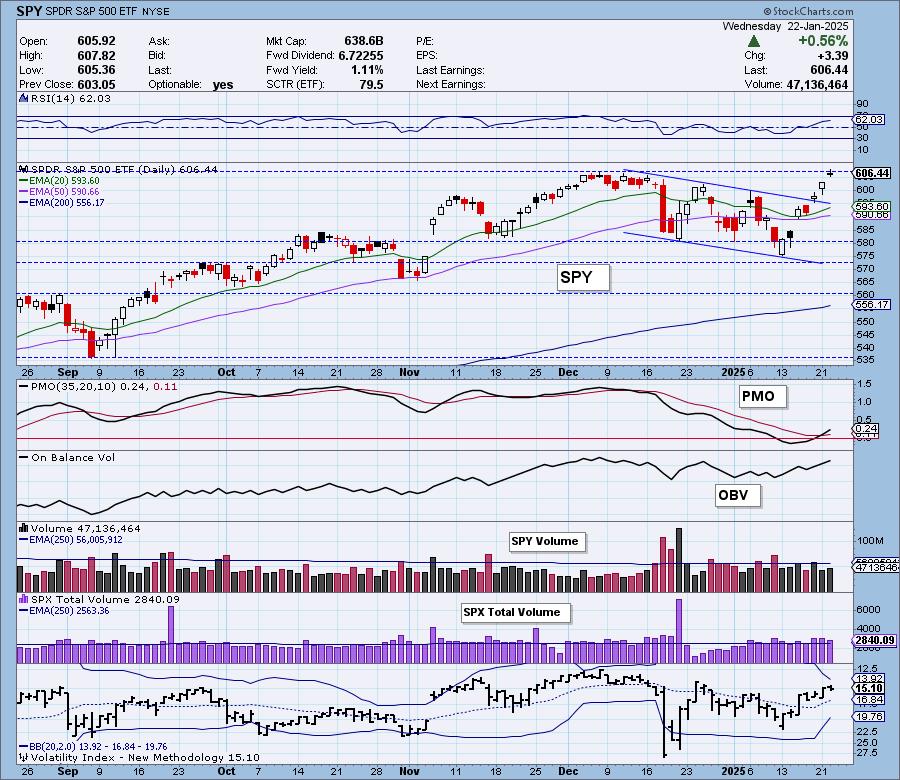
The VIX is above its moving average on the inverted scale, but it is getting close to its upper Bollinger Band. Many times punctures of that upper Band lead to price declines. Stochastics however look very bullish as they rise above 80. We do note that mega-caps are starting to outperform equal-weight RSP so it could be that mega-caps will strengthen while the broad market is already participating.

Here is the latest recording from 1/3 (No trading room 1/10 or 1/27). Click HERE to get to our video list.:
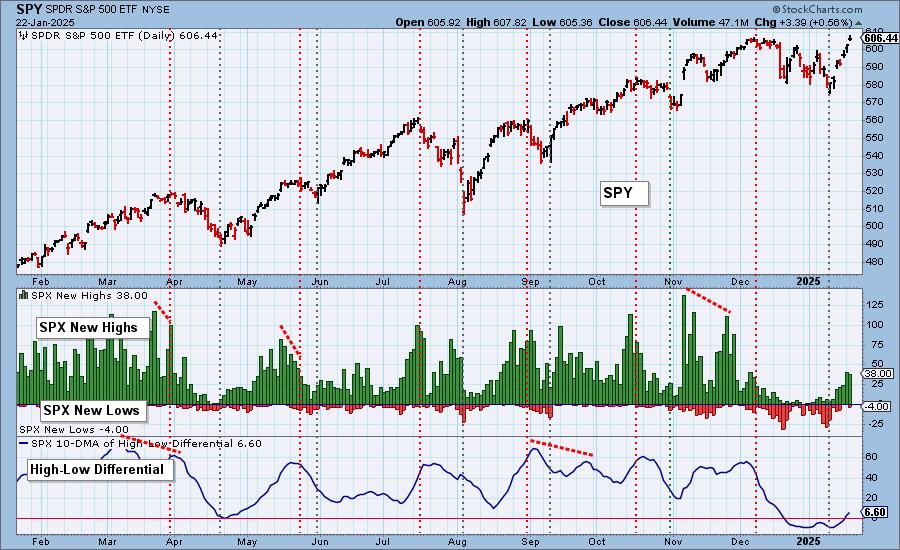
S&P 500 New 52-Week Highs/Lows: New Highs did pare back slightly today on the rally, but they were still prevalent. The High-Low Differential is rising above the zero line very bullishly. New Lows made an appearance.
Climax* Analysis: There were no climax readings today. However, we did notice that on a market up day SPX Net A-D and SPX Net A-D Volume was negative, which is a caution flag.
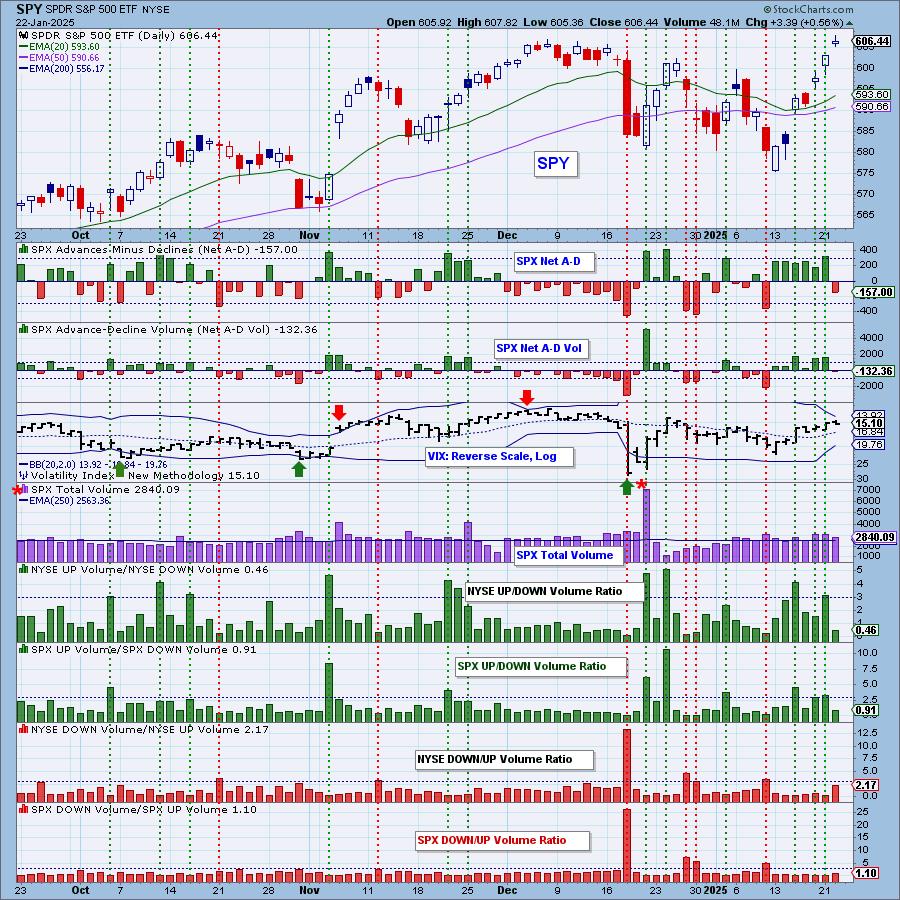
*A climax is a one-day event when market action generates very high readings in, primarily, breadth and volume indicators. We also include the VIX, watching for it to penetrate outside the Bollinger Band envelope. The vertical dotted lines mark climax days -- red for downside climaxes, and green for upside. Climaxes are at their core exhaustion events; however, at price pivots they may be initiating a change of trend.
Short-Term Market Indicators: The short-term market trend is UP and the condition is OVERBOUGHT.
The Swenlin Trading Oscillator for Breadth (STO-B) did turn down today out of overbought territory. We don't like it. At least we did see the Swenlin Trading Oscillator for Volume (STO-V) did continue to rise. Both are quite overbought and could be setting up for a market pullback. Participation and rising momentum both topped today on a rally to all-time highs.
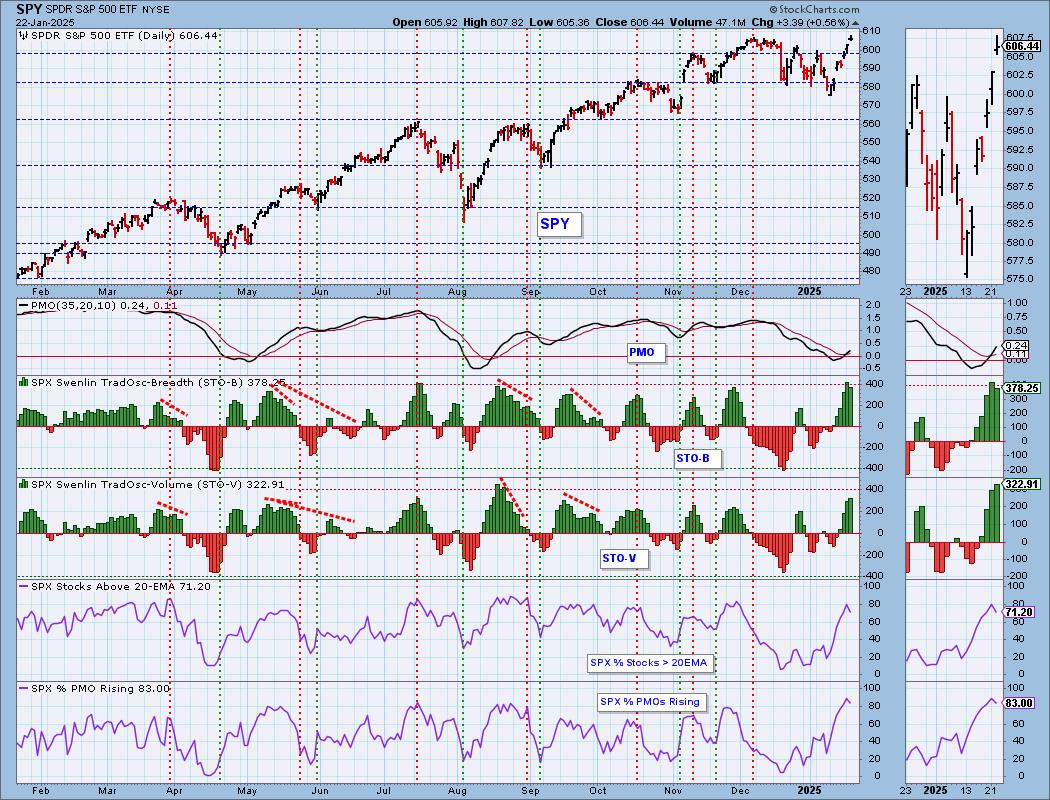
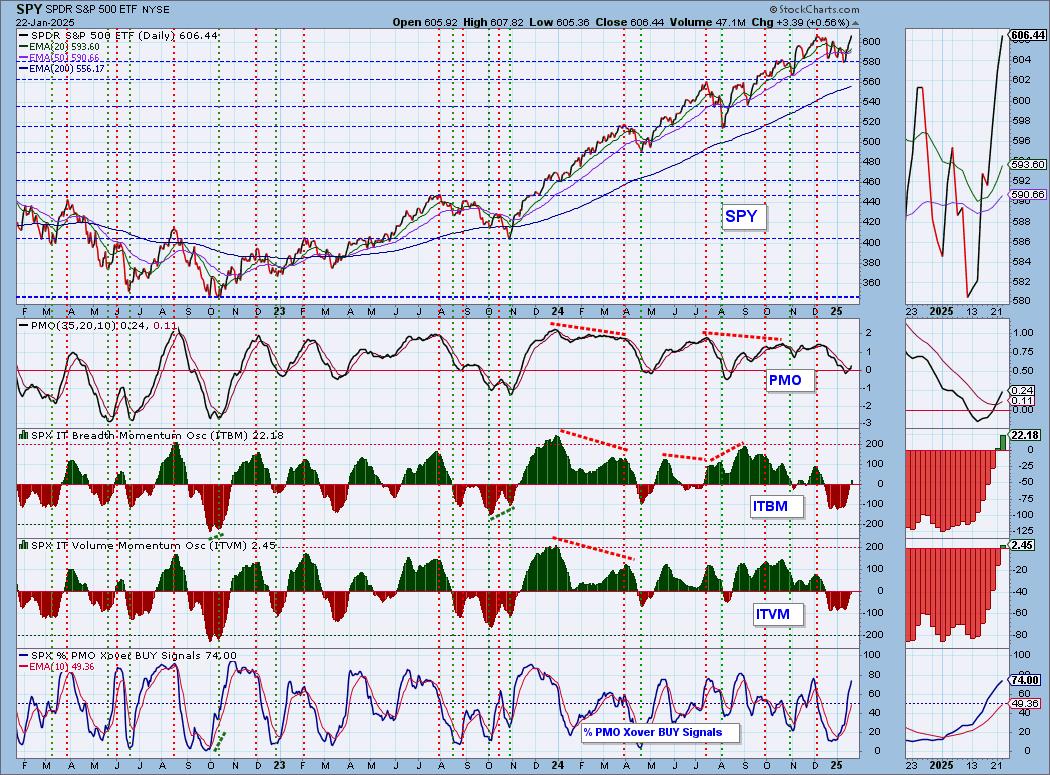
Intermediate-Term Market Indicators: The intermediate-term market trend is UP and the condition is NEUTRAL.
Today the ITVM joined the ITBM in positive territory. Their rise does suggest we won't see a bad decline in the intermediate term. Mushy STOs are still worrisome. It is positive to see nearly 3/4ths of the index holding PMO Crossover BUY Signals.
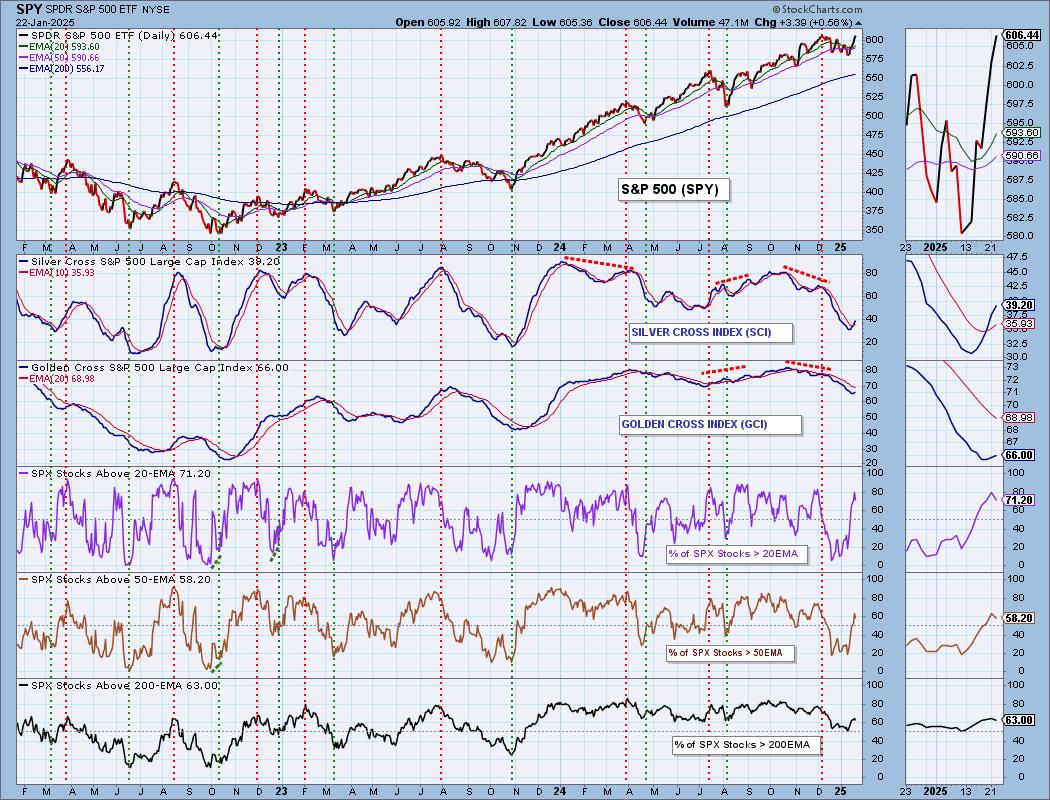
PARTICIPATION CHART (S&P 500): The following chart objectively shows the depth and trend of participation for the SPX in two time frames.
- Intermediate-Term - the Silver Cross Index (SCI) shows the percentage of SPX stocks on IT Trend Model BUY signals (20-EMA > 50-EMA). The opposite of the Silver Cross is a "Dark Cross" -- those stocks are, at the very least, in a correction.
- Long-Term - the Golden Cross Index (GCI) shows the percentage of SPX stocks on LT Trend Model BUY signals (50-EMA > 200-EMA). The opposite of a Golden Cross is the "Death Cross" -- those stocks are in a bear market.
The market bias is BULLISH in the intermediate term.
The market bias is BEARISH in the long term.
Participation readings all shifted lower on a rally to new all-time highs. This is an attention flag. The Silver Cross Index looks very healthy and given we have far more stocks above their 20/50-day EMAs versus the Silver Cross Index reading, it should continue to rise higher. It is above its signal line so the IT Bias is BULLISH. The Golden Cross Index is now rising, but it remains below its signal line so the LT Bias is BEARISH.
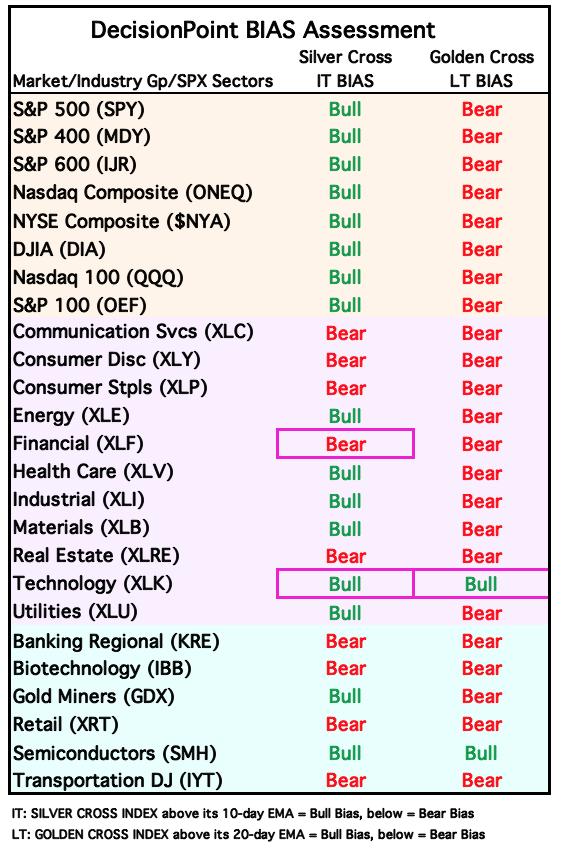
BIAS Assessment: The following table expresses the current BIAS of various price indexes based upon the relationship of the Silver Cross Index to its 10-day EMA (intermediate-term), and of the Golden Cross Index to its 20-day EMA (long-term). When the Index is above the EMA it is bullish, and it is bearish when the Index is below the EMA. The BIAS does not imply that any particular action should be taken. It is information to be used in the decision process.
The items with highlighted borders indicate that the BIAS changed today.
*****************************************************************************************************
CONCLUSION: The market is clicking with mega-caps beginning to outperform again. Given participation is still healthy, we know that the broad market is participating in this rally and that could fuel it higher. However, we had a few attention flags today. Net A-D and Net A-D Volume were both negative on today's rally. The STO-B has topped and participation across the board topped on a rally day. We discussed the possibility of churn off yesterday's upside exhaustion climax. Churn sounds about right. We do have a jobs report tomorrow. A strong labor market will not be what the Fed or investors want to see so it could be a catalyst depending on its content.
Erin is 55% long, 0% short. (This is intended as information, not a recommendation.)
*****************************************************************************************************
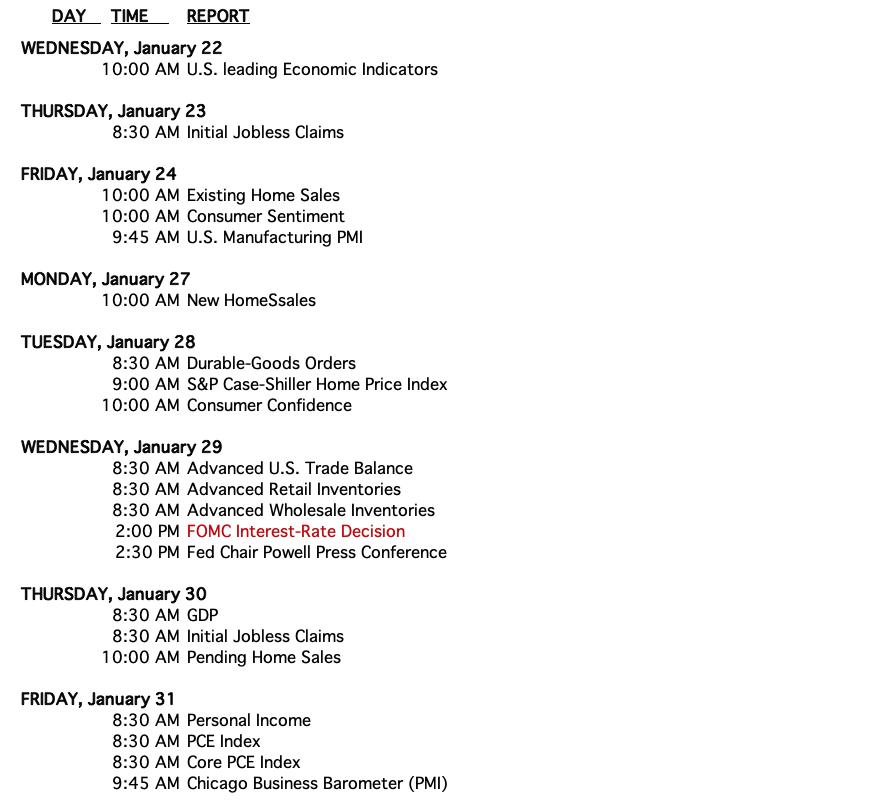
CALENDAR
Have you subscribed the DecisionPoint Diamonds yet? DP does the work for you by providing handpicked stocks/ETFs from exclusive DP scans! Add it with a discount! Contact support@decisionpoint.com for more information!
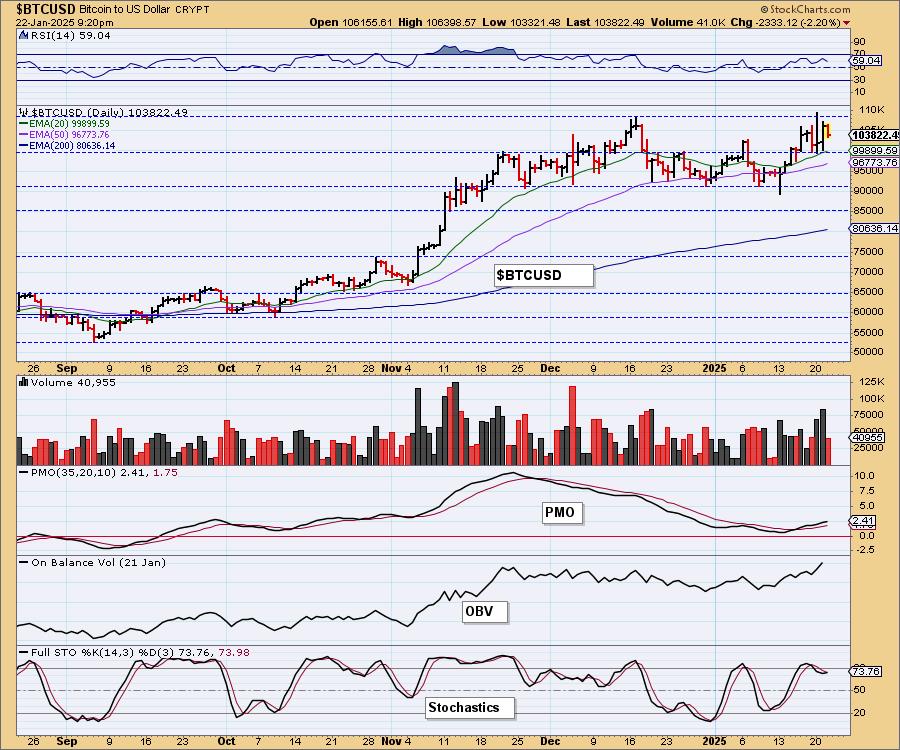
BITCOIN
Bitcoin has hit overhead resistance. We could see this trading range continue, but we did notice Stochastics turned up today and the PMO continues to rise on a Crossover BUY Signal. There is a bullish bias on the chart that does favor a breakout, but we wouldn't be surprised if this trading range remains intact a bit longer.
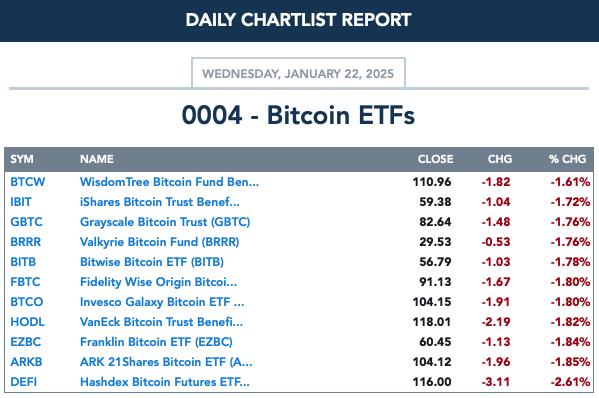
BITCOIN ETFs
INTEREST RATES
Yields tipped upward today but didn't make much headway. They are cooling right now, but we don't think they will move too much lower. Rising trends on long-term yields are still intact.
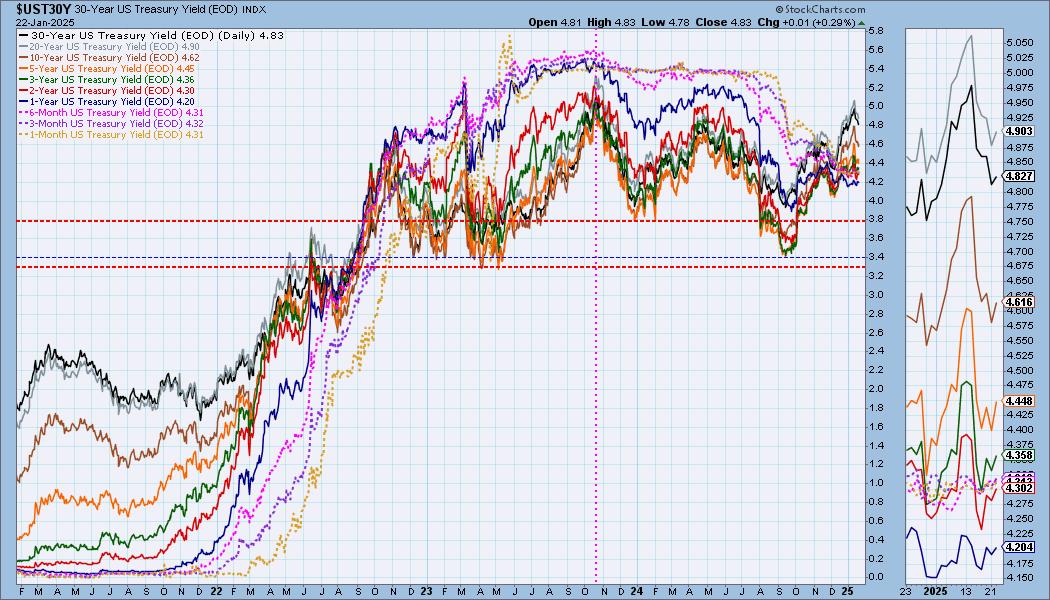
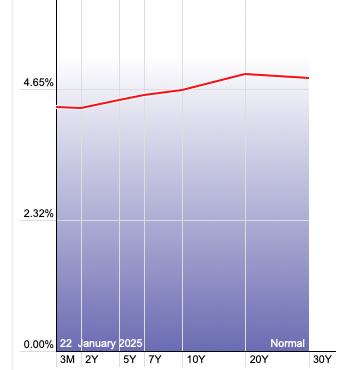
The Yield Curve Chart from StockCharts.com shows us the inversions taking place. The red line should move higher from left to right. Inversions are occurring where it moves downward.
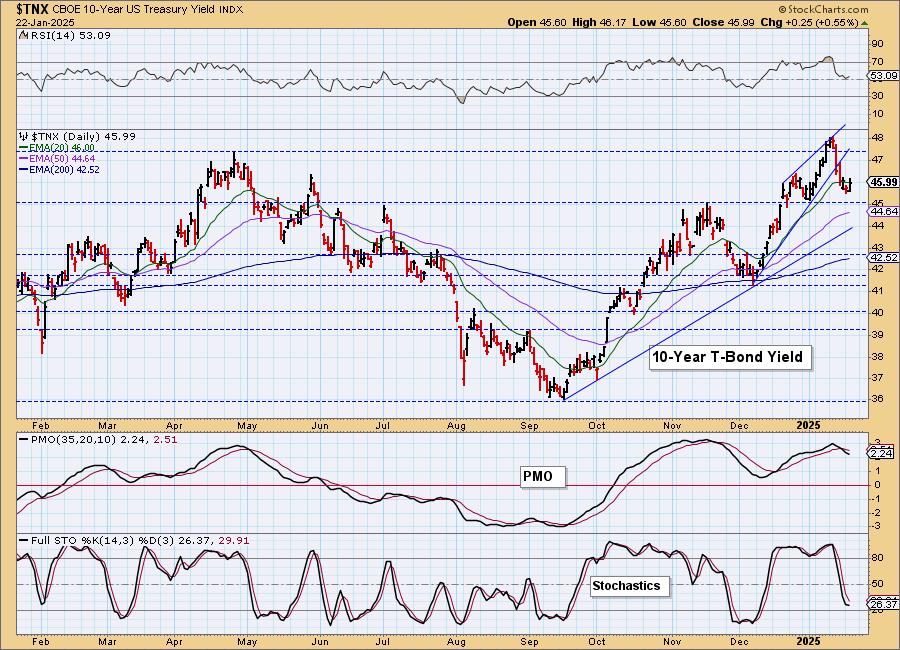
10-YEAR T-BOND YIELD
$TNX reversed before hitting support. That is a bullish sign that could mean $TNX is ready to reverse here. Indicators aren't on board with this thesis, although the RSI is positive and Stochastics paused today. We are somewhat bullish on the 10-year yield.
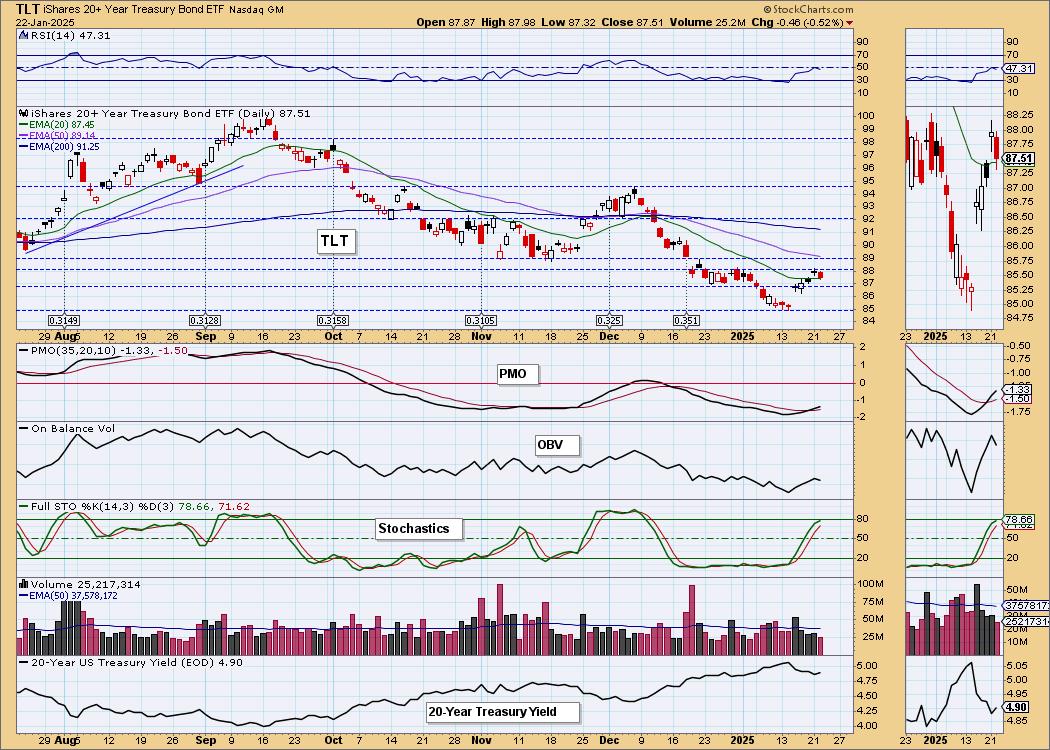
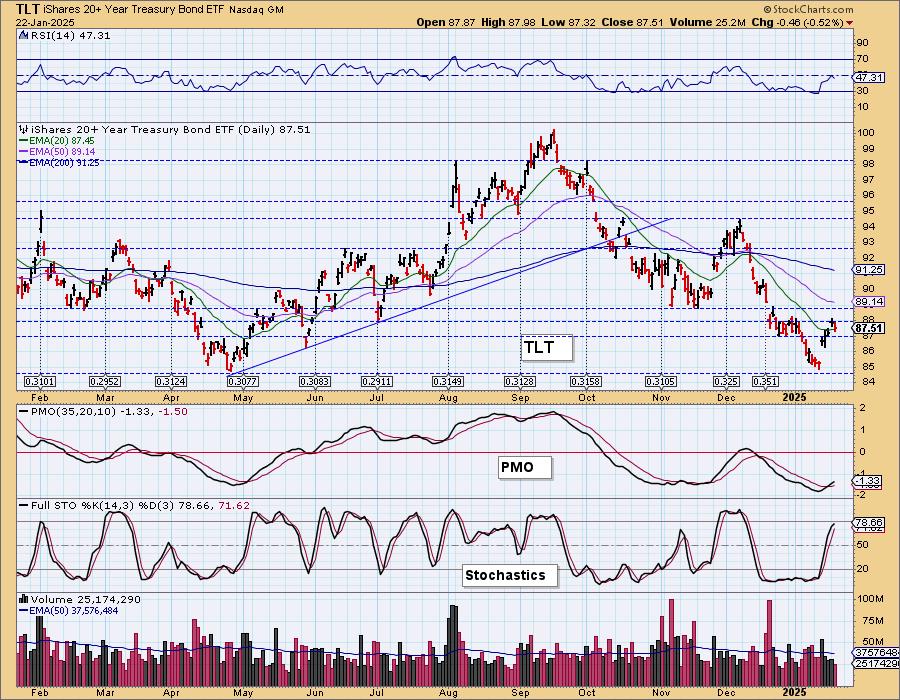
BONDS (TLT)
IT Trend Model: NEUTRAL as of 11/10/2024
LT Trend Model: SELL as of 12/13/2024
TLT Daily Chart: TLT was lower on the day as the 20-year yield did inch higher. Price is at a resistance zone that does look strong. We aren't surprised it pulled back today. Yields have been pulling back, but we see a high likelihood they will start rising again and that will put downside pressure on Bond funds. The PMO does look bullish, but we think upside potential is very limited.
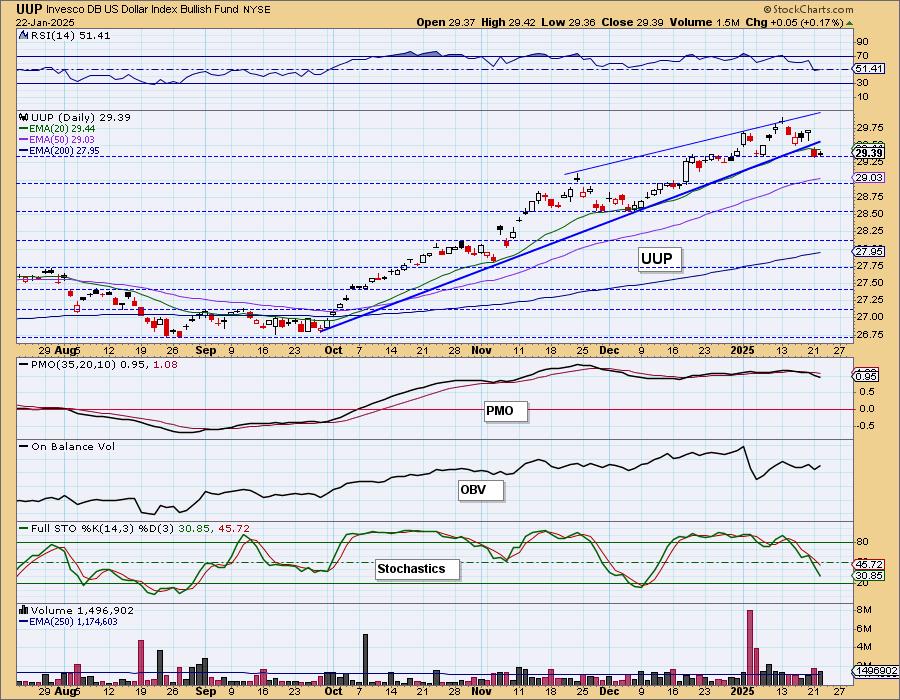
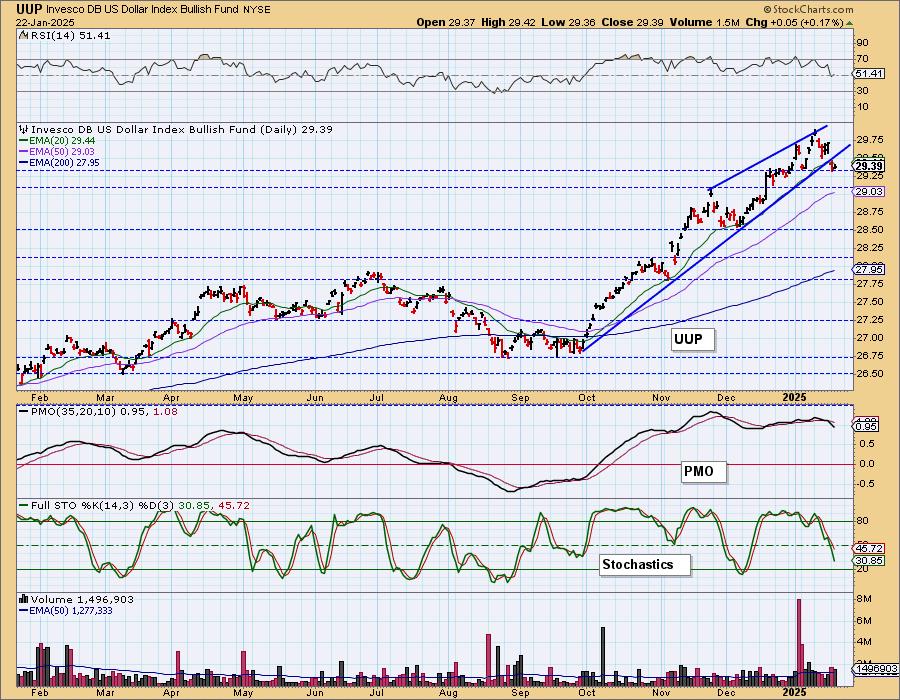
DOLLAR (UUP)
IT Trend Model: BUY as of 10/9/2024
LT Trend Model: BUY as of 5/25/2023
UUP Daily Chart: Price held support, but this does look like a topping formation. The RSI is still holding in positive territory, but the PMO is declining in earnest so we think the Dollar will break below this support level.
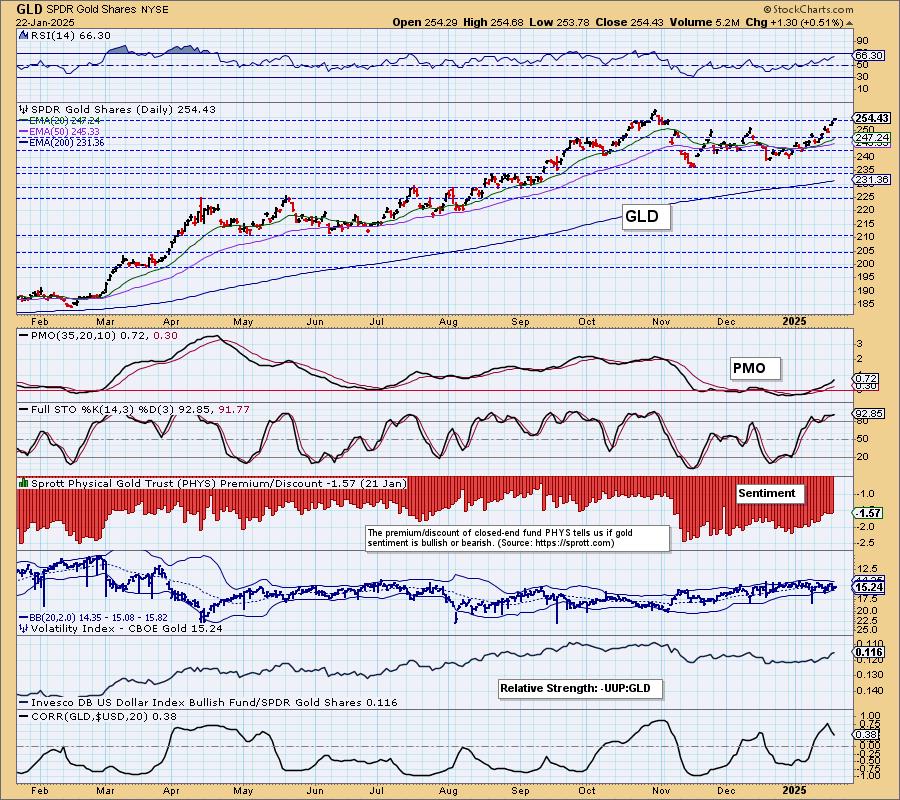
GOLD
IT Trend Model: BUY as of 1/10/2025
LT Trend Model: BUY as of 10/20/2023
GLD Daily Chart: Gold pushed itself above its current rising trend channel which is especially bullish. The PMO is rising strongly and the RSI is not yet overbought. The relative strength line for Gold is rising again and with the Dollar looking somewhat bearish, there is a good chance price will keep on rising.
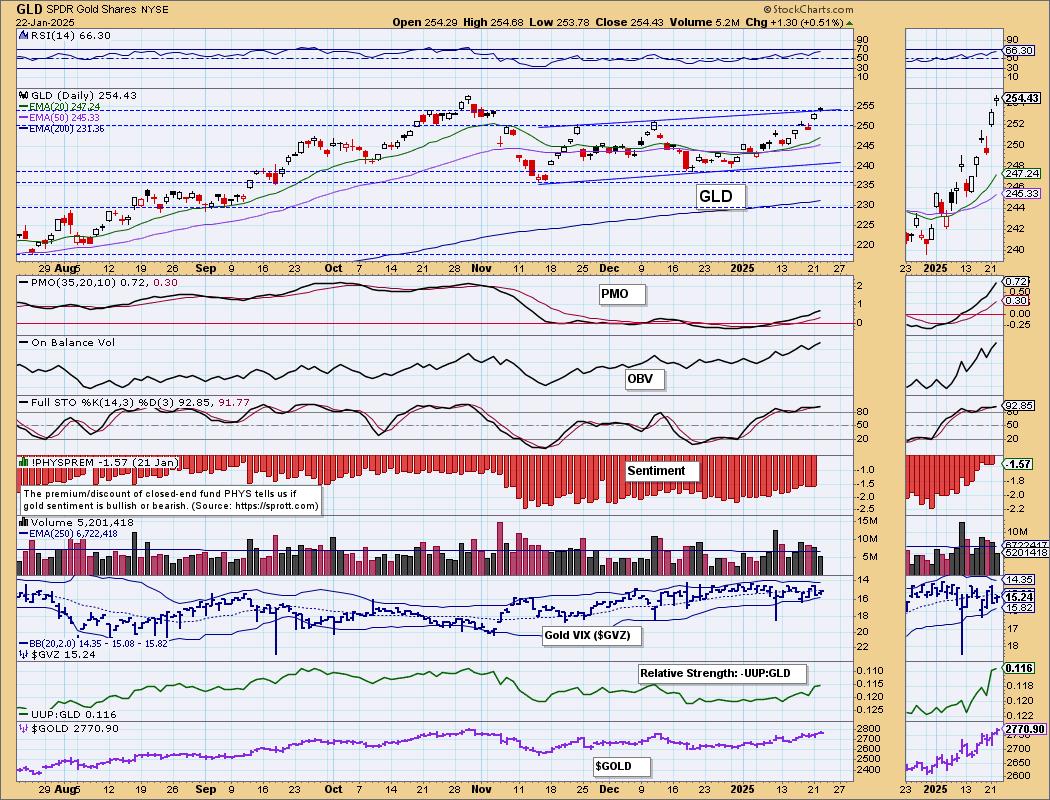
Discounts are still elevated, but they have been paring back as Gold rallies. It isn't a surprise that investors feel more bullish about the metal.
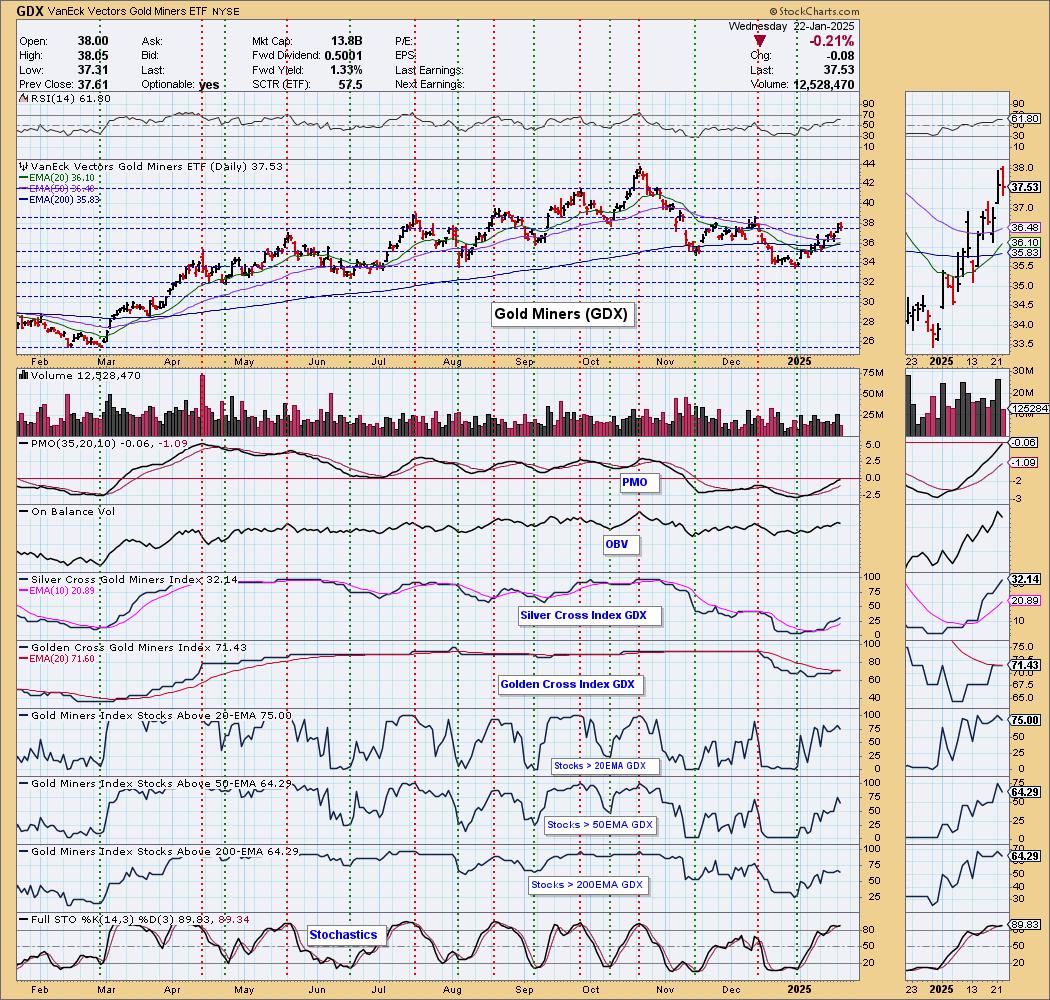
GOLD MINERS (GDX) Daily Chart: Yesterday's comments still apply:
"With Gold looking bullish, we have to be bullish on Gold Miners. GDX is on a steady rising trend and participation readings are strong and not really overbought yet. The Silver Cross Index looks especially bullish. If Gold runs into trouble at the top of its rising trend channel, GDX will likely struggle too, but for now it looks very bullish."
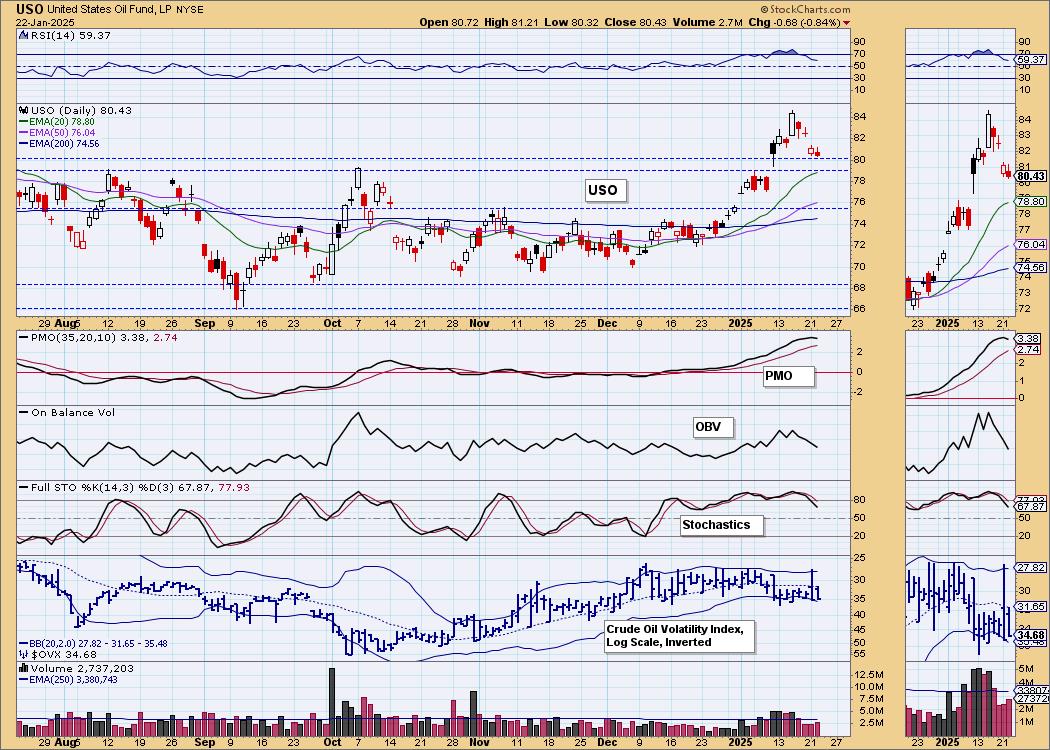
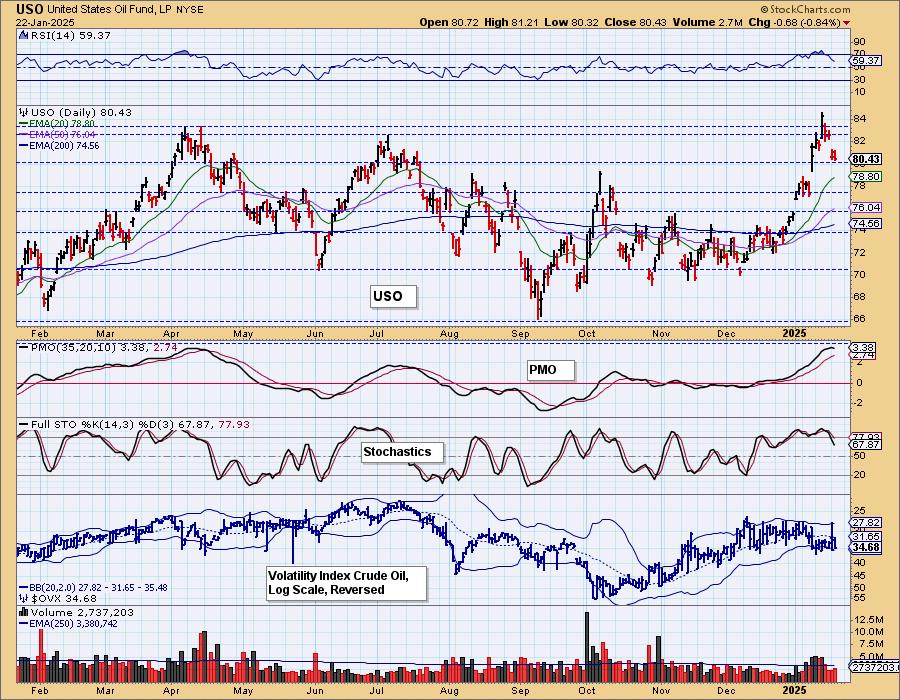
CRUDE OIL (USO)
IT Trend Model: BUY as of 12/24/2024
LT Trend Model: BUY as of 1/10/2025
USO Daily Chart: Crude Oil has pulled back toward a support zone that could protect it from more breakdown. However we do have price forming an island above the support zone. It could turn into a reverse island formation that would call for a gap down move. The outlook for Crude prices is not so bright with the new "drill, baby, drill" agenda as supply should increase. We'll need to see an increase in demand to keep prices stable and we don't see that yet. The PMO has topped and Stochastics are falling so it doesn't look that good for Crude.
Good Luck & Good Trading!
Erin Swenlin and Carl Swenlin
Technical Analysis is a windsock, not a crystal ball. --Carl Swenlin
(c) Copyright 2025 DecisionPoint.com
Disclaimer: This blog is for educational purposes only and should not be construed as financial advice. The ideas and strategies should never be used without first assessing your own personal and financial situation, or without consulting a financial professional. Any opinions expressed herein are solely those of the author, and do not in any way represent the views or opinions of any other person or entity.
DecisionPoint is not a registered investment advisor. Investment and trading decisions are solely your responsibility. DecisionPoint newsletters, blogs or website materials should NOT be interpreted as a recommendation or solicitation to buy or sell any security or to take any specific action.
NOTE: The signal status reported herein is based upon mechanical trading model signals, specifically, the DecisionPoint Trend Model. They define the implied bias of the price index based upon moving average relationships, but they do not necessarily call for a specific action. They are information flags that should prompt chart review. Further, they do not call for continuous buying or selling during the life of the signal. For example, a BUY signal will probably (but not necessarily) return the best results if action is taken soon after the signal is generated. Additional opportunities for buying may be found as price zigzags higher, but the trader must look for optimum entry points. Conversely, exit points to preserve gains (or minimize losses) may be evident before the model mechanically closes the signal.
Helpful DecisionPoint Links:
DecisionPoint Alert Chart List
DecisionPoint Golden Cross/Silver Cross Index Chart List
DecisionPoint Sector Chart List
Price Momentum Oscillator (PMO)