
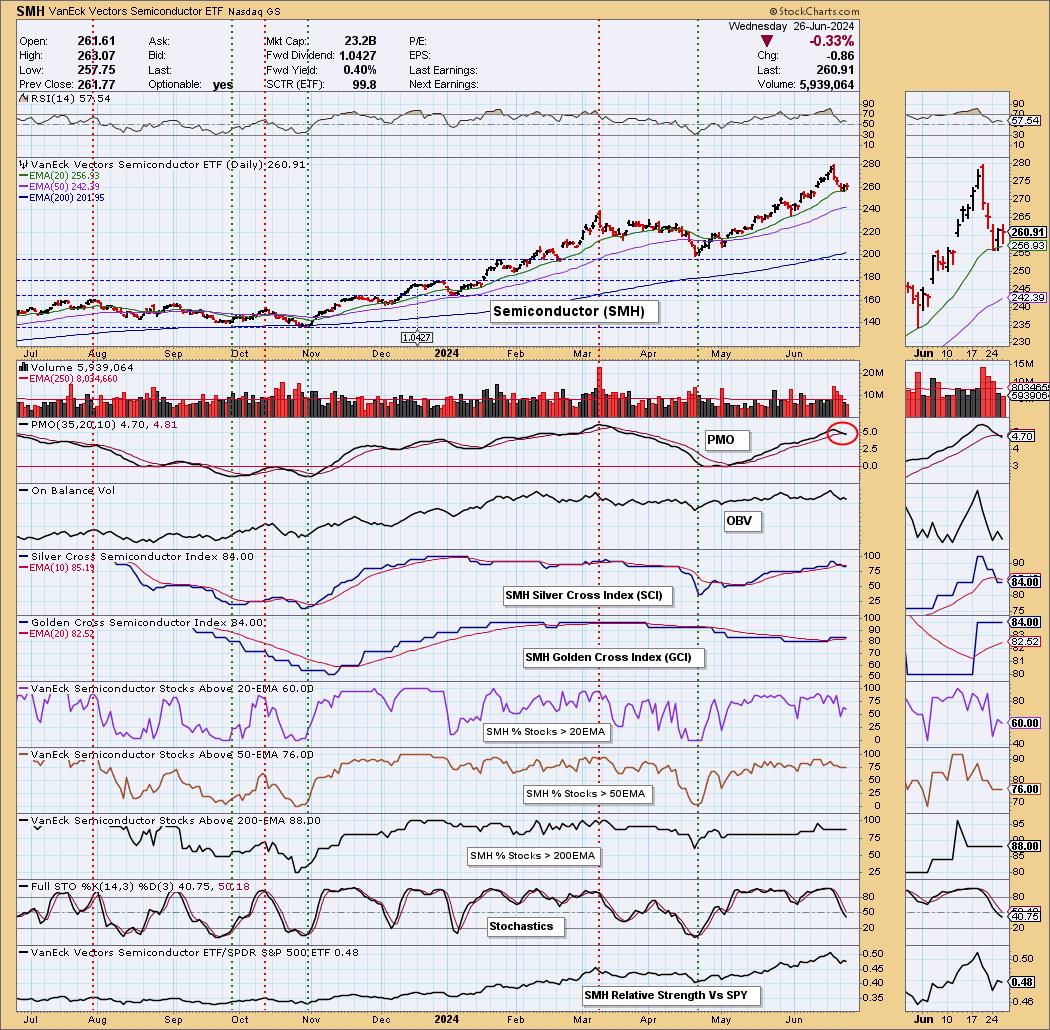
NVDA's recent decline weighed heavy on the Semiconductor ETF (SMH). We now have a PMO Crossover SELL Signal. Stochastics have also tanked and are moving lower in negative territory. We do see that support at the 20-day EMA is still holding up, but momentum is likely to carry it lower. The Silver Cross Index remains quite elevated so the group hasn't completely fallen apart, but we do see participation of stocks above the 20/50-day EMAs is lukewarm. This group has been entirely too overbought for too long. Investors may be ready to rotate elsewhere. Although we wouldn't be completely surprised if a 'buy the dip' phenomenon lifts prices temporarily. This wasn't much of a correction and thus we feel it is vulnerable to more decline.
The DecisionPoint Alert Weekly Wrap presents an end-of-week assessment of the trend and condition of the Stock Market, the U.S. Dollar, Gold, Crude Oil, and Bonds. The DecisionPoint Alert daily report (Monday through Thursday) is abbreviated and gives updates on the Weekly Wrap assessments.
Watch the latest episode of DecisionPoint on our YouTube channel here!
MARKET/INDUSTRY GROUP/SECTOR INDEXES
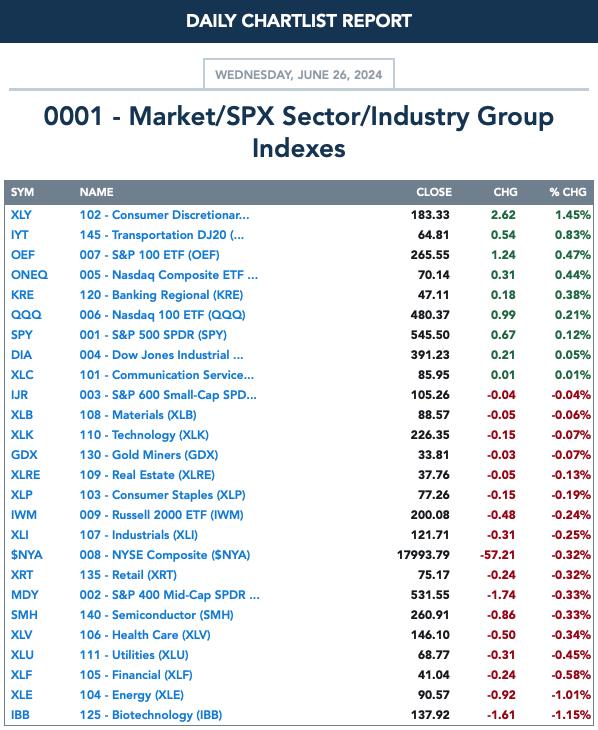
CLICK HERE for Carl's annotated Market Index, Sector, and Industry Group charts.
THE MARKET (S&P 500)
IT Trend Model: BUY as of 11/14/2023
LT Trend Model: BUY as of 3/29/2023
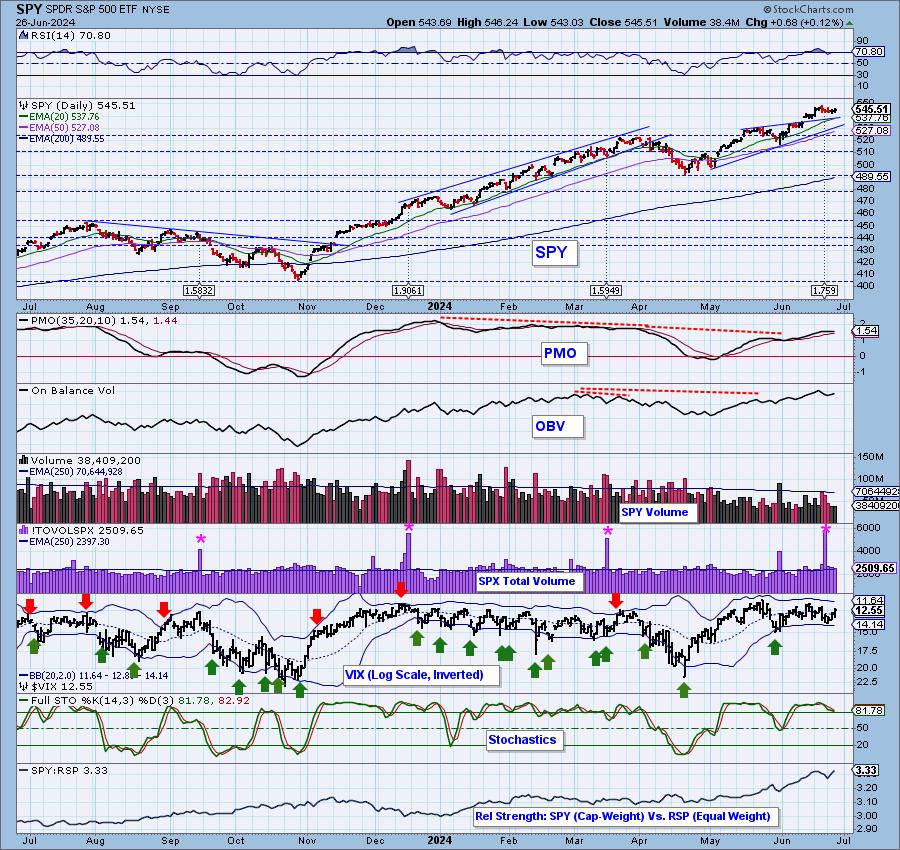
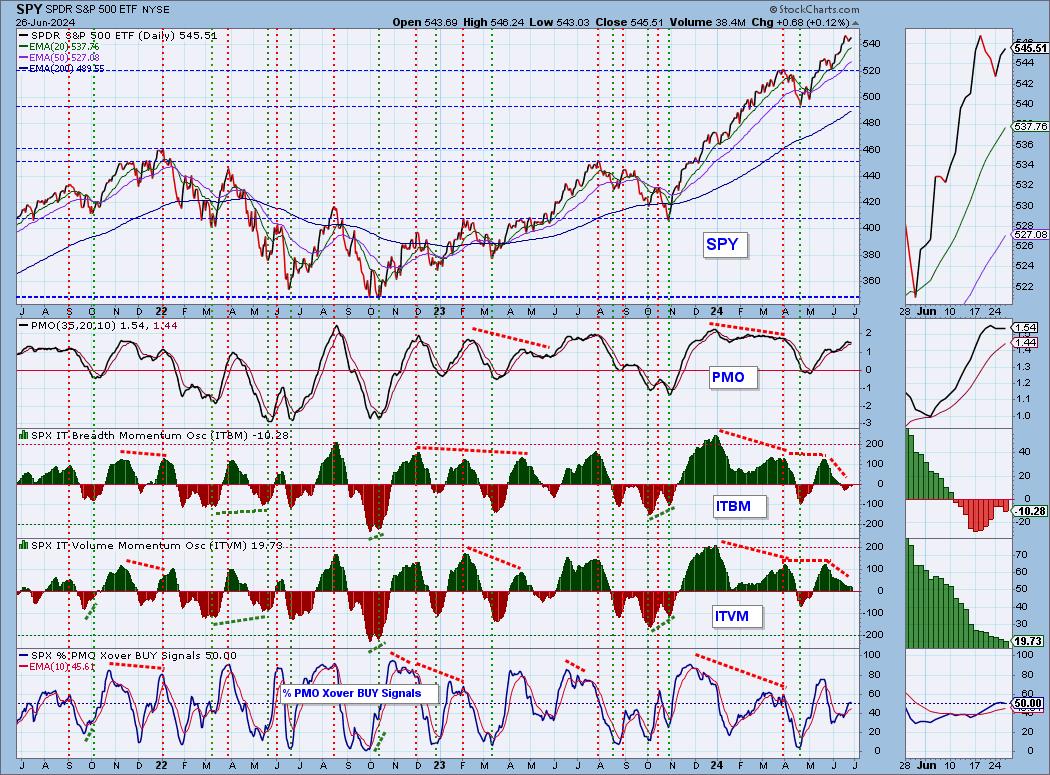
SPY Daily Chart: The PMO is technically rising and we do see a bull flag formation. The RSI remains overbought as price continues to push higher.
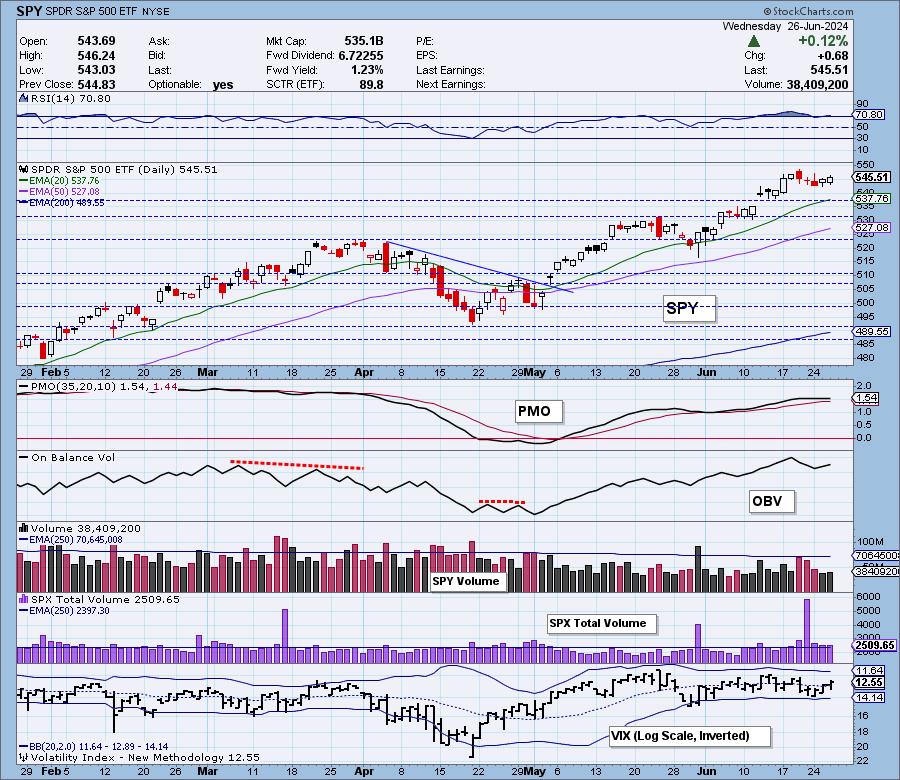
The relative strength line of SPY v. RSP ticked up again today as the mega-caps continued to lead the market higher. Stochastics are now falling, but so far remain above 80 which does imply internal price strength. We just see it as deteriorating. You want to see them rise on rallies.

Here is the latest recording from 6/24:
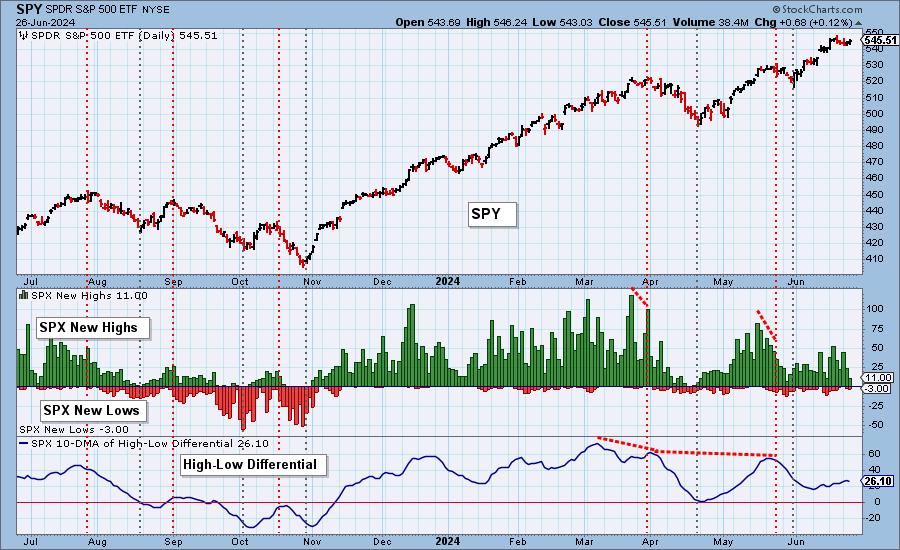
S&P 500 New 52-Week Highs/Lows: New Highs contracted while New Lows expanded. Not a good look on a rally day. The High-Low Differential topped today but so far it is holding a rising trend.
Climax* Analysis: There were no climax readings today.
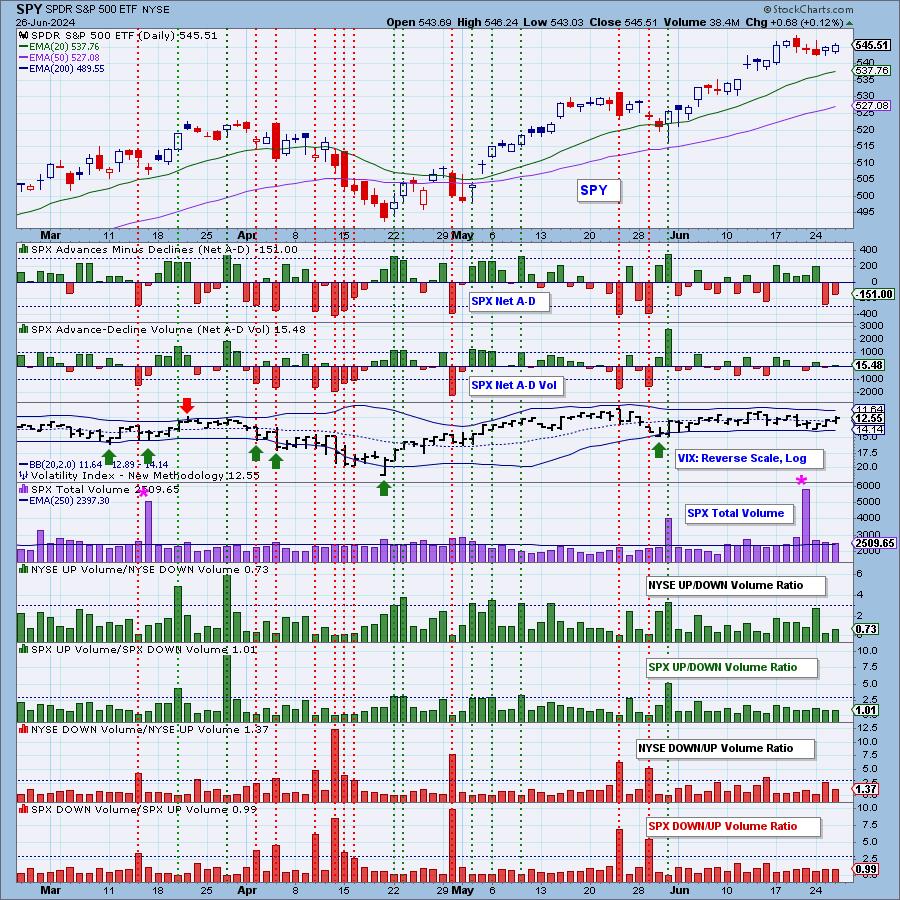
*A climax is a one-day event when market action generates very high readings in, primarily, breadth and volume indicators. We also include the VIX, watching for it to penetrate outside the Bollinger Band envelope. The vertical dotted lines mark climax days -- red for downside climaxes, and green for upside. Climaxes are at their core exhaustion events; however, at price pivots they may be initiating a change of trend.
Short-Term Market Indicators: The short-term market trend is UP and the condition is NEUTRAL.
Swenlin Trading Oscillators (STOs) pulled back again on a rally day. For a second day in a row, participation thinned. This shouldn't happen on rally days. We should have seen at least an expansion in the number of PMOs rising.
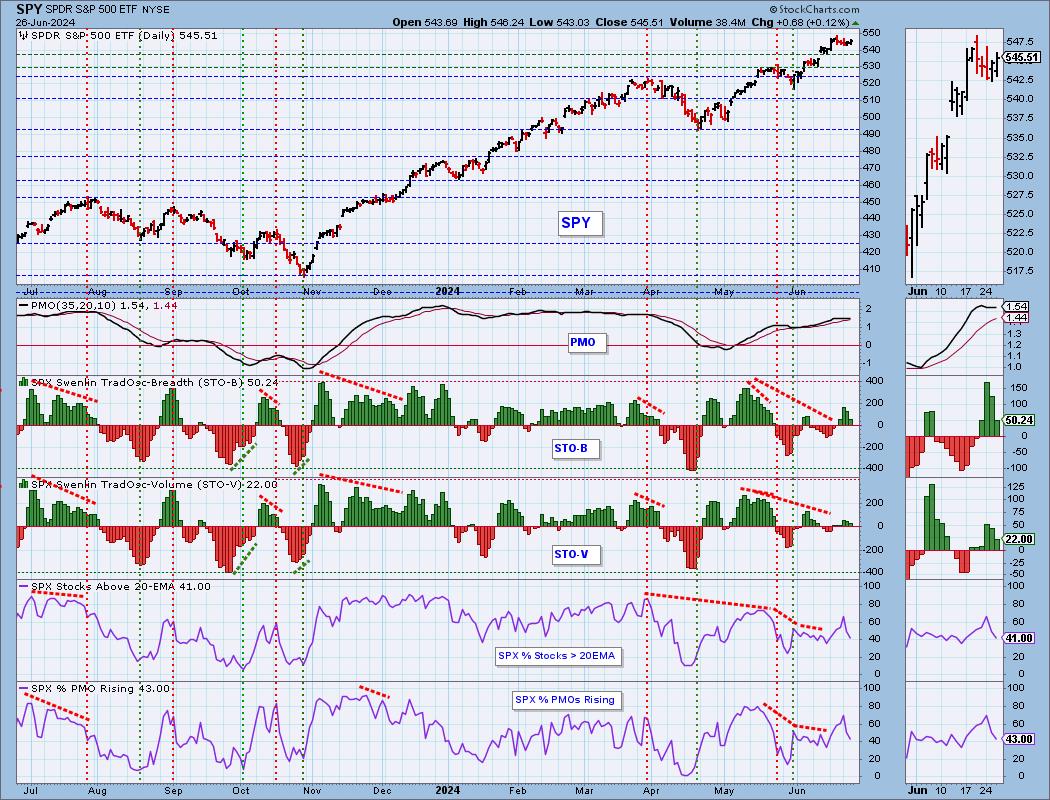
Intermediate-Term Market Indicators: The intermediate-term market trend is UP and the condition is NEUTRAL.
The ITBM turned lower in negative territory and the ITVM continued its slide lower. %PMO BUY Signals topped today with only half of the index now holding Crossover BUY Signals.
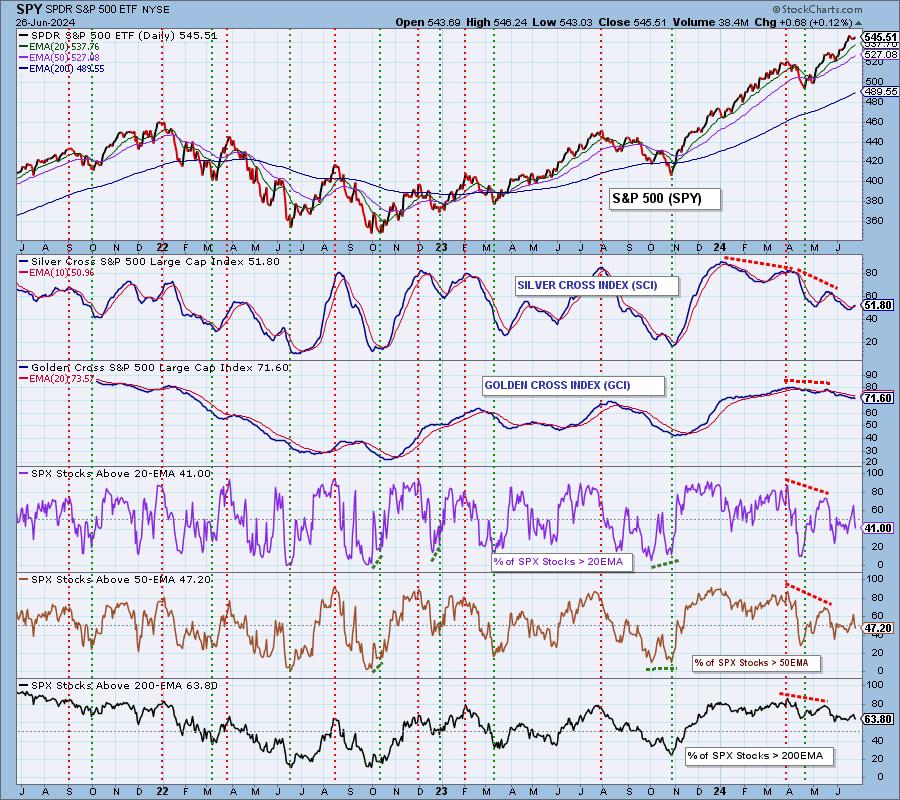
PARTICIPATION: The following chart objectively shows the depth and trend of participation in two time frames.
- Intermediate-Term - the Silver Cross Index (SCI) shows the percentage of SPX stocks on IT Trend Model BUY signals (20-EMA > 50-EMA). The opposite of the Silver Cross is a "Dark Cross" -- those stocks are, at the very least, in a correction.
- Long-Term - the Golden Cross Index (GCI) shows the percentage of SPX stocks on LT Trend Model BUY signals (50-EMA > 200-EMA). The opposite of a Golden Cross is the "Death Cross" -- those stocks are in a bear market.
The market bias is BEARISH in the short term.
The market bias is BULLISH in the intermediate term.
The market bias is BEARISH in the long term.
The ST Bias continues to deteriorate as more stocks fell below their 20/50-day EMAs. The Silver Cross Index is at a low value and should be much higher given the rise in price. Almost half of the index are in corrections based on the Silver Cross Index value. It is above its signal line so it does give us a BULLISH bias in the intermediate term. The Golden Cross Index is still trending lower and is below its signal line so the LT Bias is BEARISH.
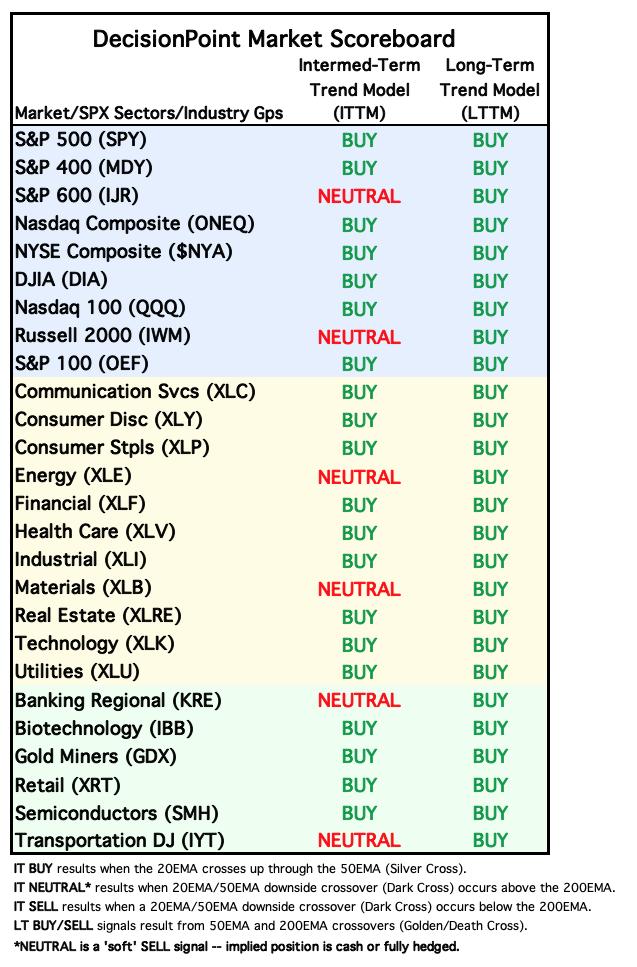
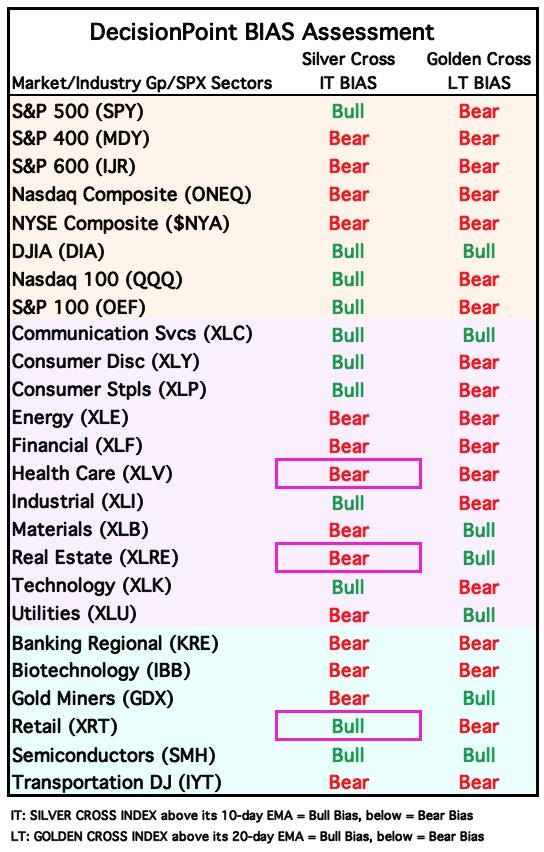
BIAS Assessment: The following table expresses the current BIAS of various price indexes based upon the relationship of the Silver Cross Index to its 10-day EMA (intermediate-term), and of the Golden Cross Index to its 20-day EMA (long-term). When the Index is above the EMA it is bullish, and it is bearish when the Index is below the EMA. The BIAS does not imply that any particular action should be taken. It is information to be used in the decision process.
The items with highlighted borders indicate that the BIAS changed today.
**************************************************************************************
CONCLUSION: We did see another market rally, but internals failed to improve again. The STOs, ITBM and ITVM are in decline. Participation is thinning on this rally. There is a negative divergence with New Highs and New Lows as they contracted on rally days. We keep waiting for the broad market to catch up to the mega-caps, but it continues to languish as evidenced by a decline in the NYSE today and our low Silver Cross Index reading on the SPY. Semiconductors are cracking and that could pose a problem for the SPY and Nasdaq should investors pack it up and go home, but we will be monitoring smaller-caps to see if the broad market can come to the rescue, but internals leave us pessimistic.
Erin is 45% long, 0% short.
CALENDAR
Thursday: 10:00 am Pending Home Sales
Friday: 8:30 am PCE Index
10:00 am Consumer Sentiment
**************************************************************************************
Have you subscribed the DecisionPoint Diamonds yet? DP does the work for you by providing handpicked stocks/ETFs from exclusive DP scans! Add it with a discount! Contact support@decisionpoint.com for more information!
BITCOIN
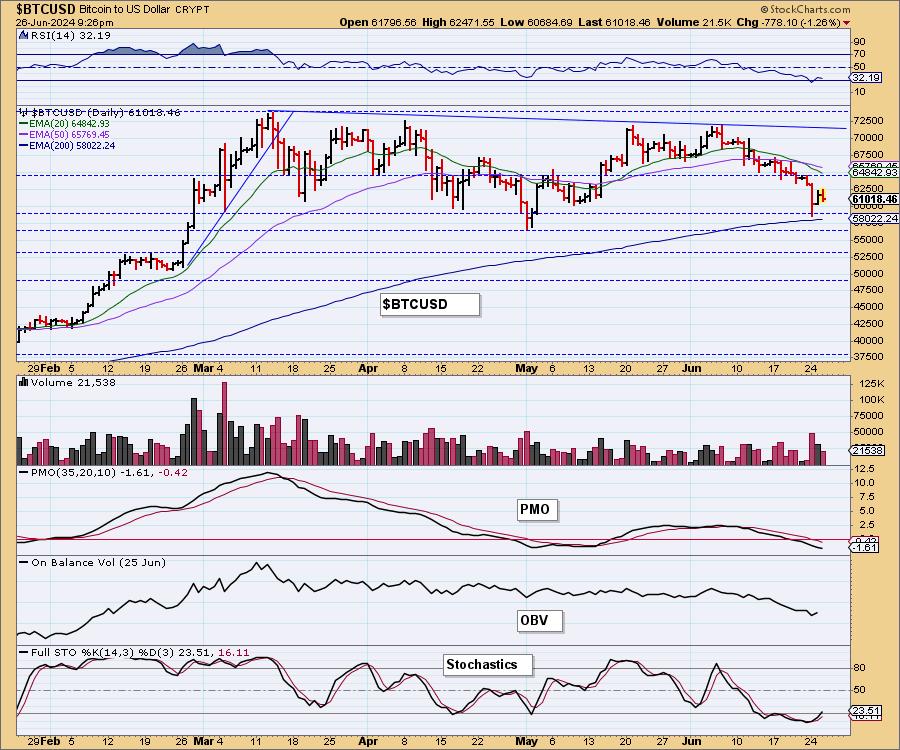
Yesterday's comments still apply:
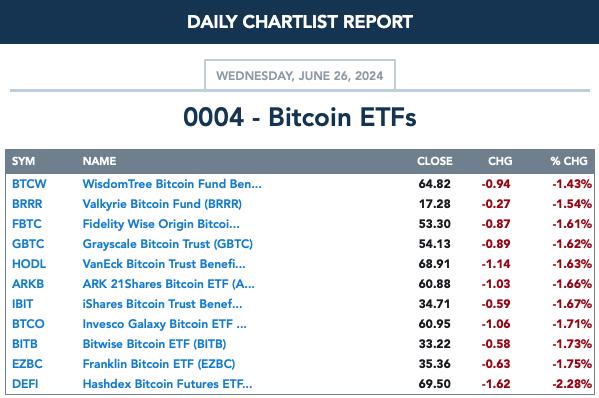
"A large double top dominates the chart. The confirmation line is at the May low. If this pattern is confirmed with a drop below that level, the minimum downside target would take price below 50,000. We're not sure it will fall to that level, but it does look destined to fall further from this current level."
BITCOIN ETFs
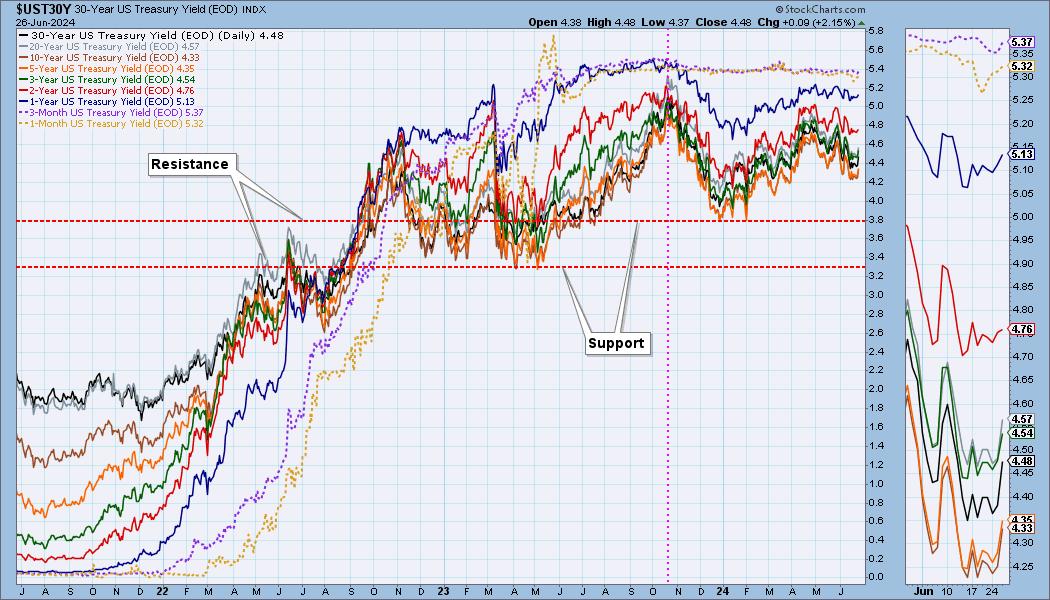
INTEREST RATES
Yields popped higher out of consolidation zones and it has us reevaluating our bearish stance right now in the short term.
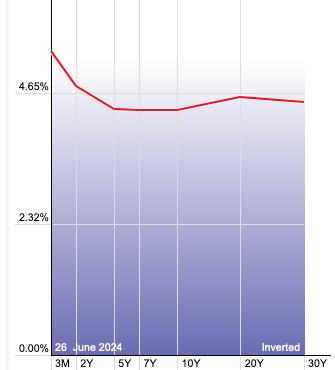
The Yield Curve Chart from StockCharts.com shows us the inversions taking place. The red line should move higher from left to right. Inversions are occurring where it moves downward.
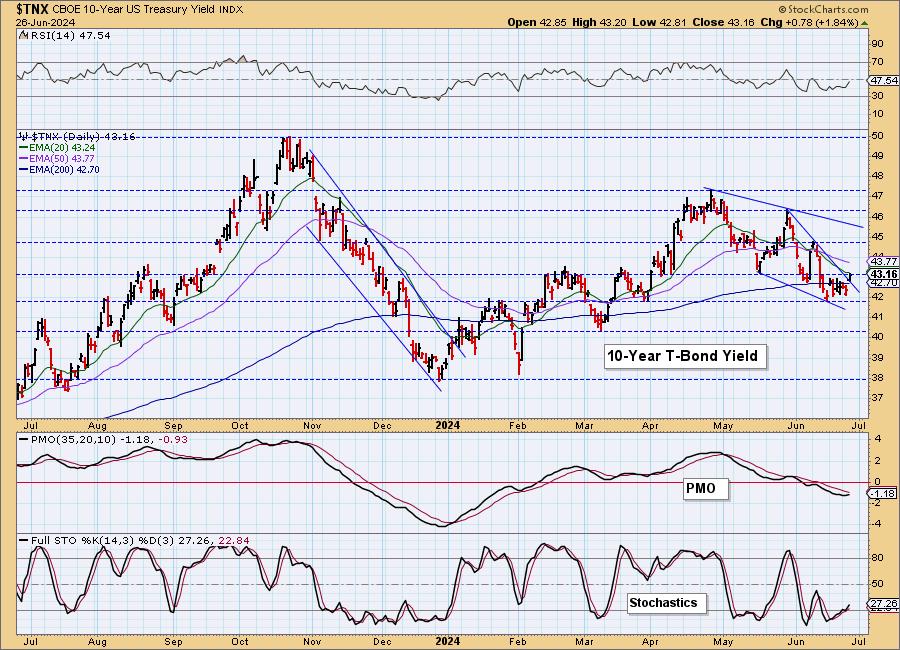
10-YEAR T-BOND YIELD
We got a breakout from the bullish falling wedge today that does suggest we will see yields move higher. There is still resistance at the 20/50-day EMAs to contend with, but we are optimistic given the now rising PMO and Stochastics.
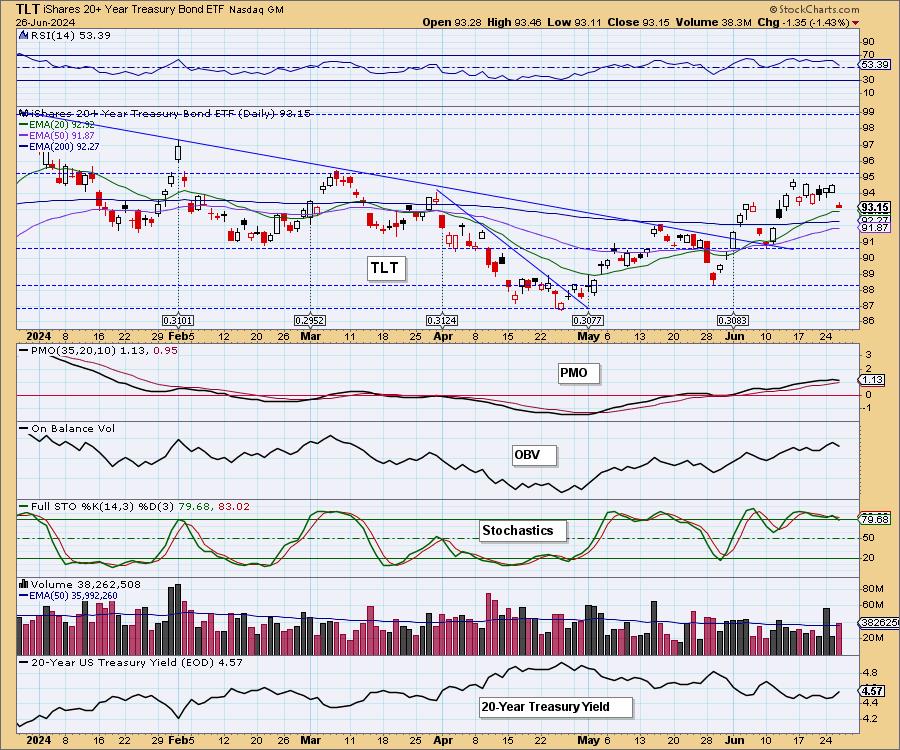
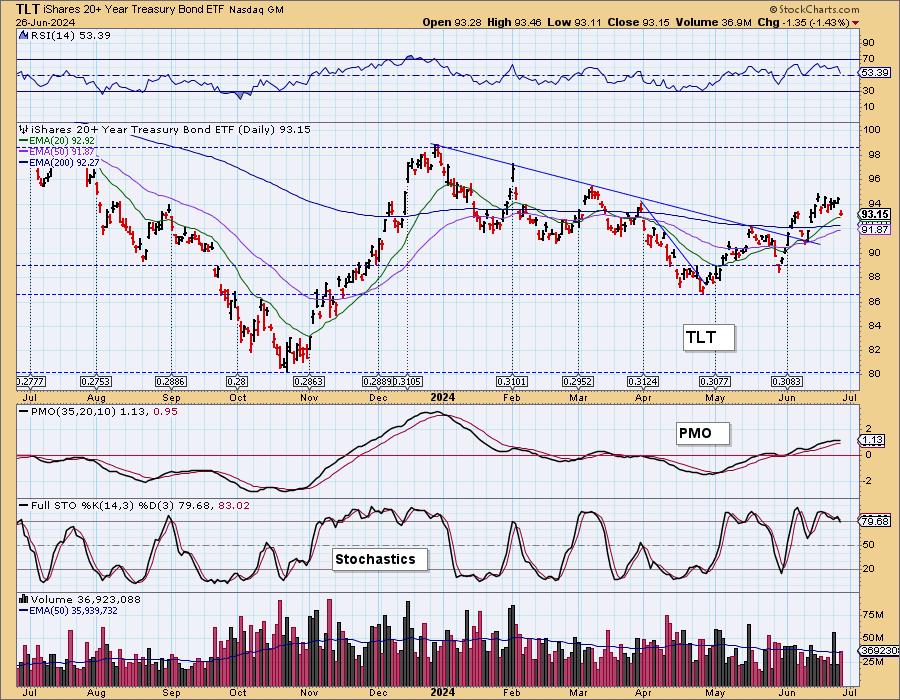
BONDS (TLT)
IT Trend Model: SELL as of 3/20/2024
LT Trend Model: SELL as of 1/19/2022
TLT Daily Chart: TLT gapped lower as the 20-year yield rallied strongly today. The PMO has now topped and Stochastics have dropped below 80. This could be a breakaway gap to the downside which would imply lower prices ahead. Support is still available at key moving averages, but it looks vulnerable given today's strong decline.
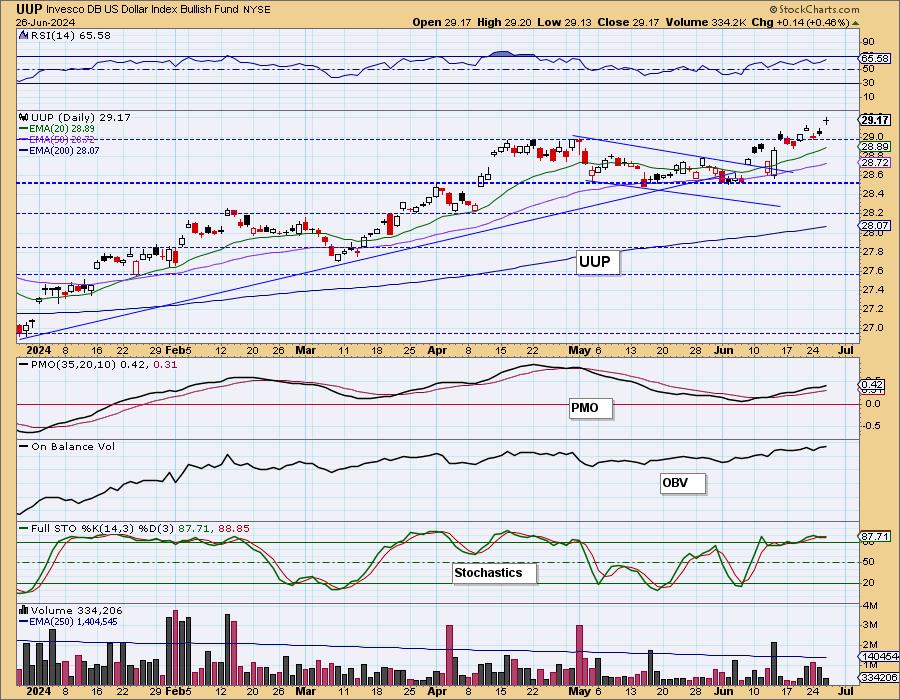
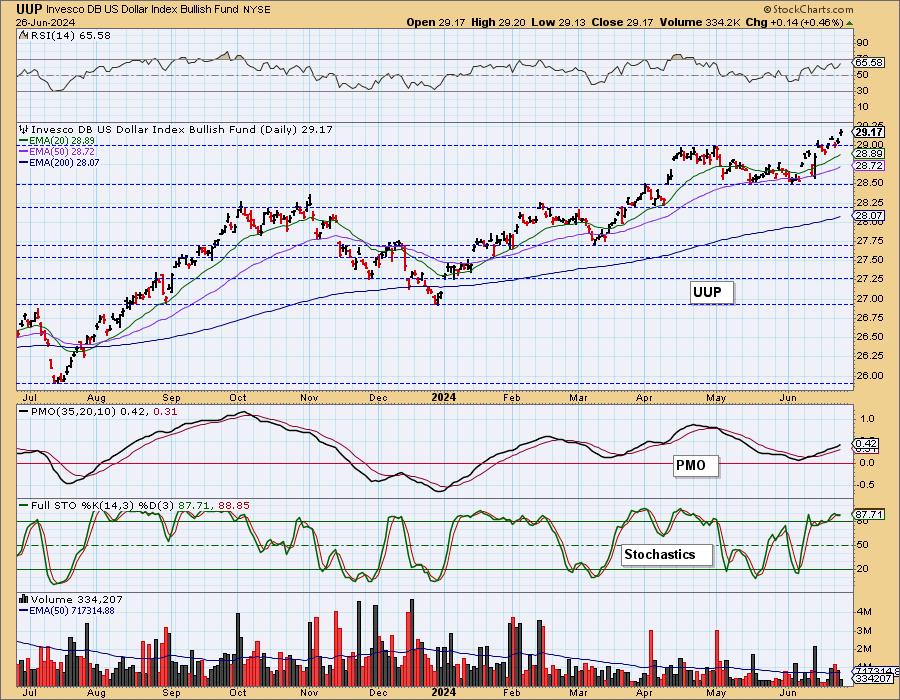
DOLLAR (UUP)
IT Trend Model: BUY as of 1/23/2024
LT Trend Model: BUY as of 5/25/2023
UUP Daily Chart: The Dollar rallied again today as it finally begins to make its way out of the congestion area. The indicators are very favorable so we are looking for the Dollar to continue its rise higher.
GOLD
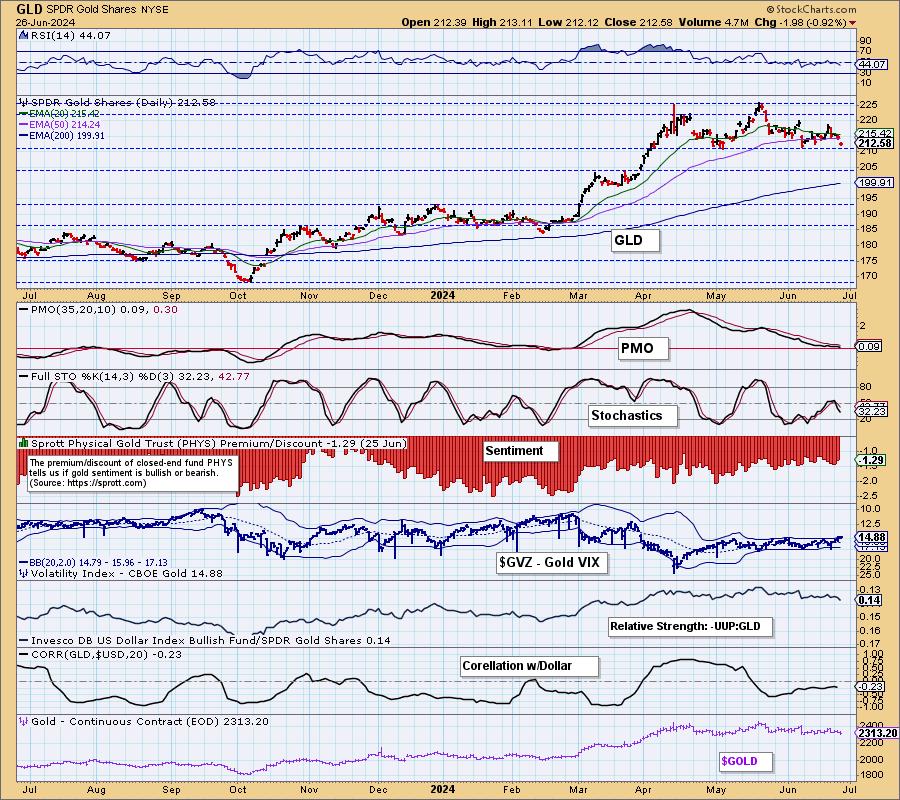
IT Trend Model: BUY as of 10/23/2023
LT Trend Model: BUY as of 10/20/2023
GLD Daily Chart: Gold is about to test support at the confirmation line of the bearish double top formation. We have been looking for more sideways consolidation, but given the strong outlook for the Dollar as well as negative indicators, we should look for a breakdown.
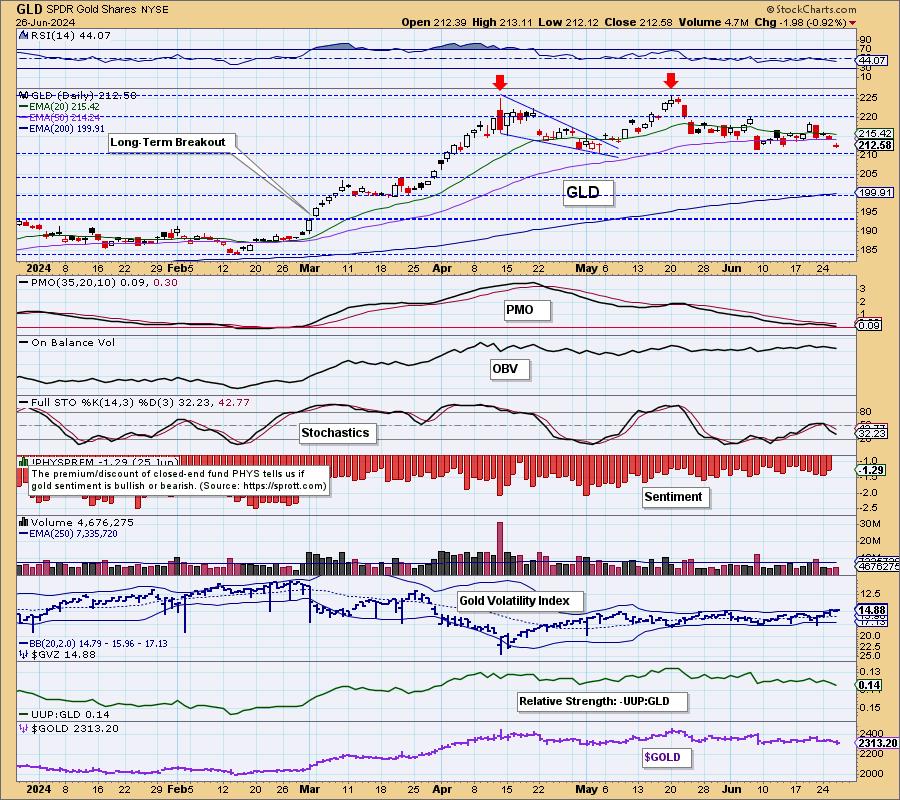
Relative strength is also beginning to give way for Gold versus the Dollar. That will not help matters.
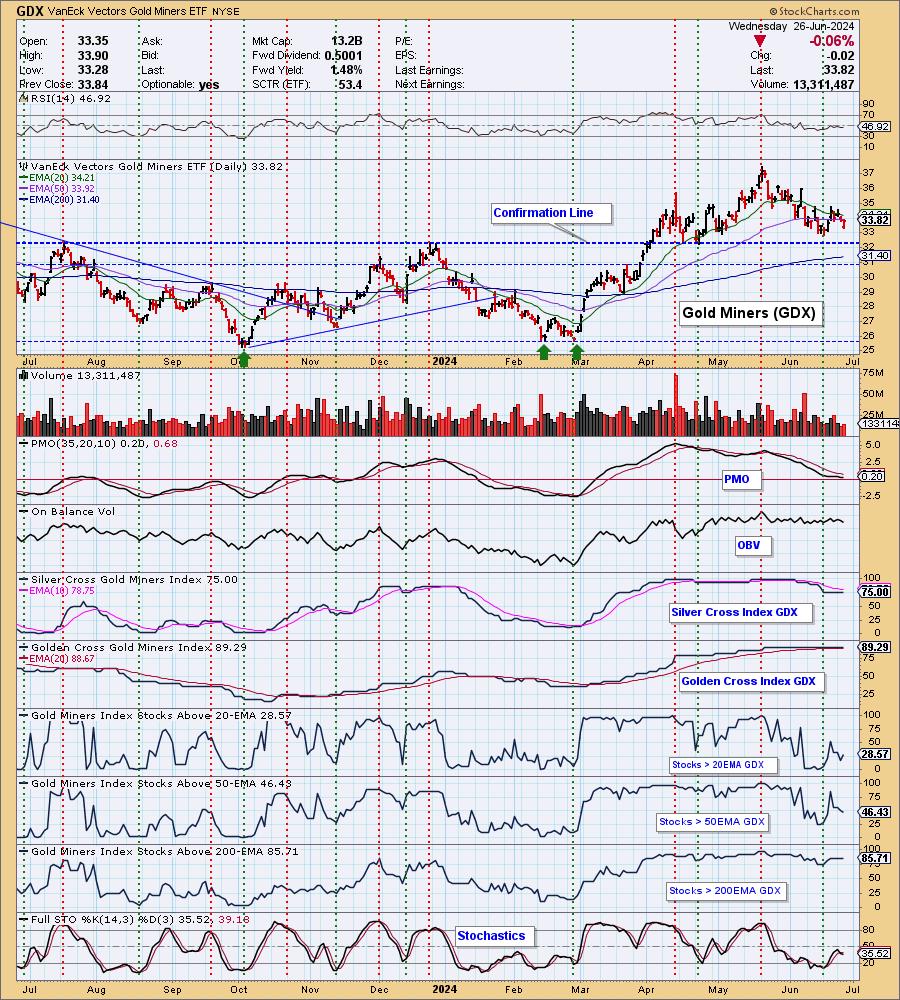
GOLD MINERS (GDX): Yesterday's comments still apply:
"Gold Miners are topping again and with Gold looking lackluster, we would expect this industry group will face some headwinds. Participation has slumped and the PMO is moving lower so we would look for more downside. This is starting to look like a bearish head and shoulders pattern developing."
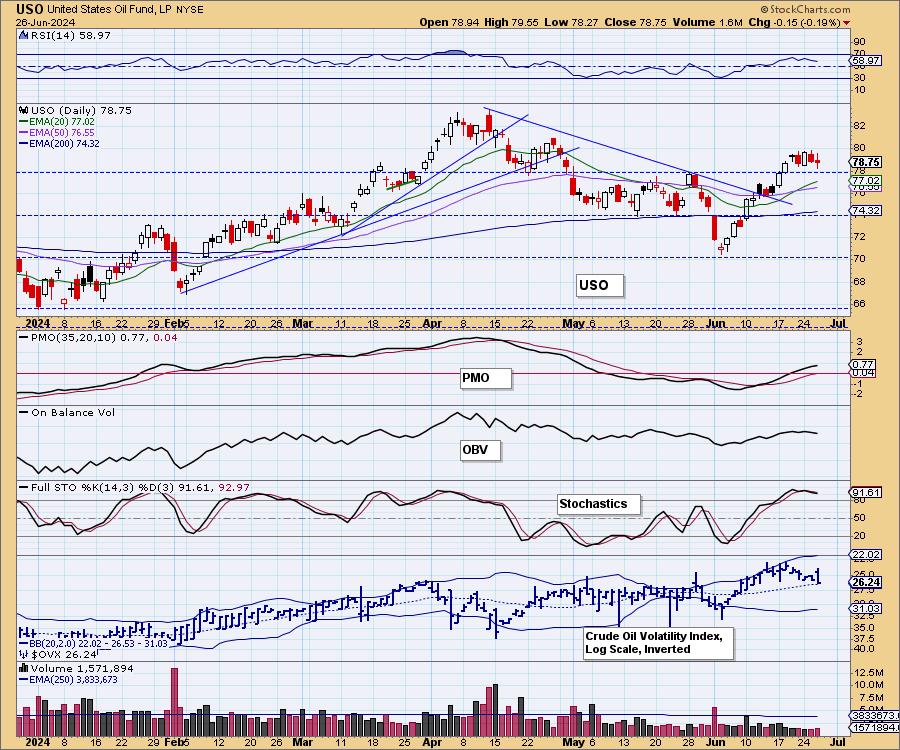
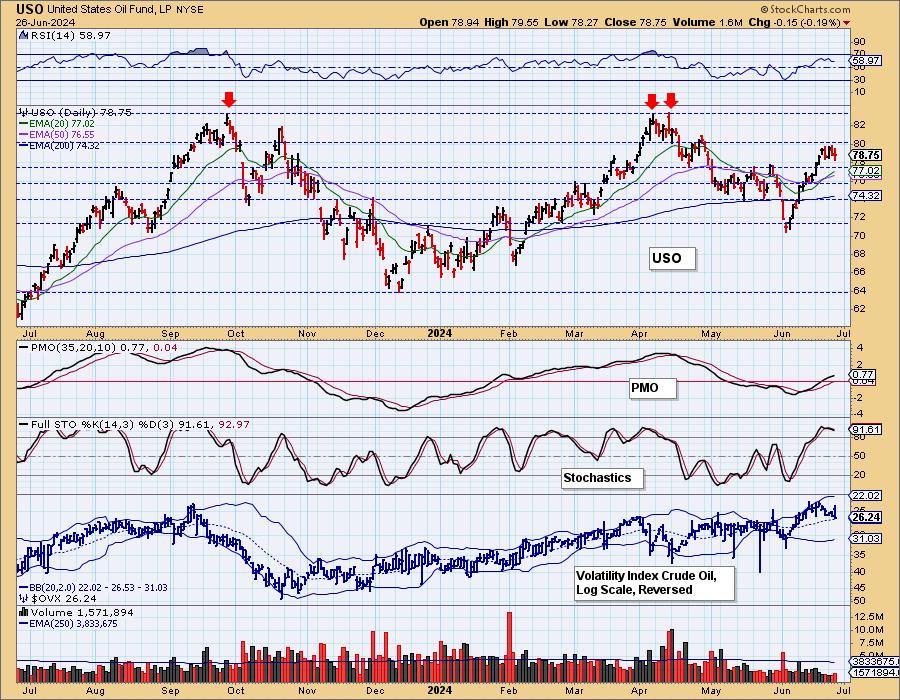
CRUDE OIL (USO)
IT Trend Model: BUY as of 6/21/2024
LT Trend Model: BUY as of 2/27/2024
USO Daily Chart: We see a flag forming on USO. The flag doesn't angle down so it isn't a strong pattern. So far support is holding on this consolidation phase. The indicators have not been compromised. After a period of consolidation, we should see a resumption of the rally. Summer months are upon us so demand is likely to pick up and add to the rally.
Good Luck & Good Trading!
Erin Swenlin and Carl Swenlin
Technical Analysis is a windsock, not a crystal ball. --Carl Swenlin
(c) Copyright 2024 DecisionPoint.com
Disclaimer: This blog is for educational purposes only and should not be construed as financial advice. The ideas and strategies should never be used without first assessing your own personal and financial situation, or without consulting a financial professional. Any opinions expressed herein are solely those of the author, and do not in any way represent the views or opinions of any other person or entity.
DecisionPoint is not a registered investment advisor. Investment and trading decisions are solely your responsibility. DecisionPoint newsletters, blogs or website materials should NOT be interpreted as a recommendation or solicitation to buy or sell any security or to take any specific action.
NOTE: The signal status reported herein is based upon mechanical trading model signals, specifically, the DecisionPoint Trend Model. They define the implied bias of the price index based upon moving average relationships, but they do not necessarily call for a specific action. They are information flags that should prompt chart review. Further, they do not call for continuous buying or selling during the life of the signal. For example, a BUY signal will probably (but not necessarily) return the best results if action is taken soon after the signal is generated. Additional opportunities for buying may be found as price zigzags higher, but the trader must look for optimum entry points. Conversely, exit points to preserve gains (or minimize losses) may be evident before the model mechanically closes the signal.
Helpful DecisionPoint Links:
DecisionPoint Alert Chart List
DecisionPoint Golden Cross/Silver Cross Index Chart List
DecisionPoint Sector Chart List
Price Momentum Oscillator (PMO)
Swenlin Trading Oscillators (STO-B and STO-V)
Bear Market Rulesctor Gets Dark Cross NEUTRAL Signak=l