
We may've lost some participation under the hood today, but it did not deter the Silver Cross Index from crossing above its signal line for a Bullish "Shift" that moved the IT Bias to BULLISH. However, we have a feeling that this signal won't be maintained given we have a smaller percentage of stocks above both their 20/50-day EMAs. Tomorrow's headline could very well be: "Silver Cross Index Bearish Shift". Nonetheless this was newsworthy.

The DecisionPoint Alert Weekly Wrap presents an end-of-week assessment of the trend and condition of the Stock Market, the U.S. Dollar, Gold, Crude Oil, and Bonds. The DecisionPoint Alert daily report (Monday through Thursday) is abbreviated and gives updates on the Weekly Wrap assessments.
Watch the latest episode of DecisionPoint on our YouTube channel here!
MARKET/INDUSTRY GROUP/SECTOR INDEXES


CLICK HERE for Carl's annotated Market Index, Sector, and Industry Group charts.
THE MARKET (S&P 500)
IT Trend Model: BUY as of 11/14/2023
LT Trend Model: BUY as of 3/29/2023
SPY Daily Chart: We are now on alert given today's gap down move that was instigated by losses in the Magnificent 7 (or should we say "Spectacular 6" as some are now calling them (Mag 7 minus Tesla)). The past five times we've see gap down or strongly declining trading days, it has not been met with any follow through. The PMO generated a new Crossover SELL Signal.

Looking at the relative strength line between SPY and equally-weighted RSP, we can see that mega-caps are losing some ground. That will need to be met with a broadening of the market rally and we aren't so sure the rest of the gang is up for the challenge. The VIX dropped perilously on our inverted scale. Investors are nervous.


Here is the latest recording from 3/4:
SUBSCRIBE TO THE DECISIONPOINT YOUTUBE CHANNEL HERE!
S&P 500 New 52-Week Highs/Lows: New Lows saw an expansion today suggesting all is not well within the index right now. The 10-DMA of the High-Low Differential is incredibly overbought right now. We should see it top if New Lows continue to expand.

Climax* Analysis: There were no climax readings today.

*A climax is a one-day event when market action generates very high readings in, primarily, breadth and volume indicators. We also include the VIX, watching for it to penetrate outside the Bollinger Band envelope. The vertical dotted lines mark climax days -- red for downside climaxes, and green for upside. Climaxes are at their core exhaustion events; however, at price pivots they may be initiating a change of trend.
Short-Term Market Indicators: The short-term market trend is UP and the condition is NEUTRAL.
Swenlin Trading Oscillators (STOs) twitched again today moving lower. We aren't emphasizing the direction of the STOs as they aren't too helpful with all of the twitching. What we do want to monitor right now are the negative divergences that are in play on these indicators. We now have less than half of the index holding rising momentum. That will make a rally continuation difficult right now.

Intermediate-Term Market Indicators: The intermediate-term market trend is UP and the condition is NEUTRAL.
The ITBM and ITVM were mixed. The ITBM topped today which is concerning, especially given the decline in STOs right now. This has sealed in the negative divergence on the ITBM. A top on the ITVM would seal that negative divergence in as well. Not surprisingly we lost some PMO BUY Signals. The indicator is still above 50%, but barely.

PARTICIPATION: The following chart objectively shows the depth and trend of participation in two time frames.
- Intermediate-Term - the Silver Cross Index (SCI) shows the percentage of SPX stocks on IT Trend Model BUY signals (20-EMA > 50-EMA). The opposite of the Silver Cross is a "Dark Cross" -- those stocks are, at the very least, in a correction.
- Long-Term - the Golden Cross Index (GCI) shows the percentage of SPX stocks on LT Trend Model BUY signals (50-EMA > 200-EMA). The opposite of a Golden Cross is the "Death Cross" -- those stocks are in a bear market.
The market bias is BULLISH in all three timeframes.
The ST Bias is BULLISH due to all of the participation indicators holding above 50%. As noted in the opening, the IT Bias changed to BULLISH today on the positive crossover its signal line. It isn't likely to last. The Golden Cross Index is above its signal line and so the LT Bias is BULLISH as well.

BIAS Assessment: The following table expresses the current BIAS of various price indexes based upon the relationship of the Silver Cross Index to its 10-day EMA (intermediate-term), and of the Golden Cross Index to its 20-day EMA (long-term). When the Index is above the EMA it is bullish, and it is bearish when the Index is below the EMA. The BIAS does not imply that any particular action should be taken. It is information to be used in the decision process.
The items with highlighted borders indicate that the BIAS changed today.

**************************************************************************************
CONCLUSION: The IT Bias has turned BULLISH, but we don't expect that condition to last. The ITBM topped today and that detracts from the bullish IT Bias. Additionally we saw a PMO Crossover SELL Signal. Cracks in the foundation are appearing as the Magnificent 7 are seeing weakness with Apple (AAPL) looking the most bearish in our estimation. We will see shortly what this rally is made of should they continue to slide. Participation is currently broad enough, but that will likely change if the index begins to top more meaningfully. Be careful buying into these conditions. Stops should be set for protection.
Erin is 60% long, 0% short.
**************************************************************************************
Have you subscribed the DecisionPoint Diamonds yet? DP does the work for you by providing handpicked stocks/ETFs from exclusive DP scans! Add it with a discount! Contact support@decisionpoint.com for more information!
BITCOIN
Bitcoin fell off the map today after soaring the past week and half. It may be time to consider Bitcoin ready for some consolidation. With "halving" occurring soon, Bitcoin miners will get 'half' of what they do now for producing Bitcoins. We're unsure how that will affect the price of Bitcoin, but it is something to be aware of nonetheless. It may add to the scarcity?

BITCOIN ETFs

INTEREST RATES
Yields fell on the day and appear ready to take another run at support. We're not so sure they'll make their way down that far, but near-term we should expect more decline.

The Yield Curve Chart from StockCharts.com shows us the inversions taking place. The red line should move higher from left to right. Inversions are occurring where it moves downward.
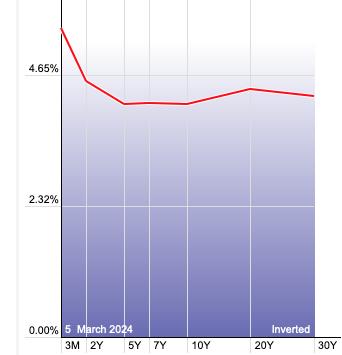
10-YEAR T-BOND YIELD
$TNX saw a decline that took it down to support at the 200-day EMA. There is a new PMO Crossover SELL Signal and Stochastics are tanking. The RSI has moved into negative territory. We don't think this support level will hold.

BONDS (TLT)
IT Trend Model: SELL as of 2/20/2024
LT Trend Model: SELL as of 1/19/2022
TLT Daily Chart: TLT and all Bond funds for that matter are enjoying new life. There is a nice bullish double bottom forming. Yields are looking particularly bearish so we see more opportunity for TLT to rally further. The PMO is on a new Crossover BUY Signal and Stochastics are above 80. We should see overhead resistance challenged and likely overcome.


DOLLAR (UUP)
IT Trend Model: BUY as of 1/23/2024
LT Trend Model: BUY as of 5/25/2023
UUP Daily Chart: Yesterday's comments still apply:
"The Dollar is reading neutral right now. The rising trend was broken, but drifted out, it didn't see a heavy decline. We are looking for more of the same. The PMO is on a SELL Signal but is still flat above the zero line so while it is a SELL Signal, we see it as diminishing strength versus pure weakness at this time."


GOLD
IT Trend Model: BUY as of 10/23/2023
LT Trend Model: BUY as of 10/20/2023
GLD Daily Chart: Gold rallied today but did form a bearish filled black candlestick. We aren't particularly concerned about this given the strength of the PMO. The RSI is now a problem as it is situated in overbought territory. Discounts are paring back quickly which tells us that investors have finally begun to warm to Gold. And why not? It looks very bullish right now.

Gold's relative strength to the Dollar is barreling higher so even if the Dollar finds its legs, Gold should still do well. We expect fresh all-time highs.

GOLD MINERS Golden and Silver Cross Indexes: Yesterday's comments still apply:
"Gold Miners are off to the races as well. The rally Gold goosed this group which is finally waking up. Participation woke up with a bang! %Stocks indicators rocketed skyward and today the Silver Cross Index shifted above its signal line giving GDX a bullish IT Bias. The PMO is rising resolutely upward. We would look for this move to propel GDX toward overhead resistance at 32.00."

CRUDE OIL (USO)
IT Trend Model: BUY as of 2/12/2024
LT Trend Model: BUY as of 2/27/2024
USO Daily Chart: Crude Oil was lower on the day, but is holding above support. We do think that Crude is vulnerable right now as the PMO has topped and Stochastics are falling. We may need to see a "handle" put on this cup.


Good Luck & Good Trading!
Erin Swenlin and Carl Swenlin
Technical Analysis is a windsock, not a crystal ball. --Carl Swenlin
(c) Copyright 2024 DecisionPoint.com
Disclaimer: This blog is for educational purposes only and should not be construed as financial advice. The ideas and strategies should never be used without first assessing your own personal and financial situation, or without consulting a financial professional. Any opinions expressed herein are solely those of the author, and do not in any way represent the views or opinions of any other person or entity.
DecisionPoint is not a registered investment advisor. Investment and trading decisions are solely your responsibility. DecisionPoint newsletters, blogs or website materials should NOT be interpreted as a recommendation or solicitation to buy or sell any security or to take any specific action.
NOTE: The signal status reported herein is based upon mechanical trading model signals, specifically, the DecisionPoint Trend Model. They define the implied bias of the price index based upon moving average relationships, but they do not necessarily call for a specific action. They are information flags that should prompt chart review. Further, they do not call for continuous buying or selling during the life of the signal. For example, a BUY signal will probably (but not necessarily) return the best results if action is taken soon after the signal is generated. Additional opportunities for buying may be found as price zigzags higher, but the trader must look for optimum entry points. Conversely, exit points to preserve gains (or minimize losses) may be evident before the model mechanically closes the signal.
Helpful DecisionPoint Links:
DecisionPoint Alert Chart List
DecisionPoint Golden Cross/Silver Cross Index Chart List
DecisionPoint Sector Chart List
Price Momentum Oscillator (PMO)