
Trading was primarily done in a sideways trading range today with neither the bulls nor the bears really winning the day. We can see in the chart below that the final five minute rally dragged 5-minute indicators upward setting up what could be an interesting start to the trading day tomorrow.

The Magnificent 7 likely contributed to today's muted trading but we also know investors are waiting on the CPE report tomorrow to gauge whether the Fed will consider lowering rates sooner rather than later.

The DecisionPoint Alert Weekly Wrap presents an end-of-week assessment of the trend and condition of the Stock Market, the U.S. Dollar, Gold, Crude Oil, and Bonds. The DecisionPoint Alert daily report (Monday through Thursday) is abbreviated and gives updates on the Weekly Wrap assessments.
Watch the latest episode of DecisionPoint on our YouTube channel here!
MARKET/INDUSTRY GROUP/SECTOR INDEXES
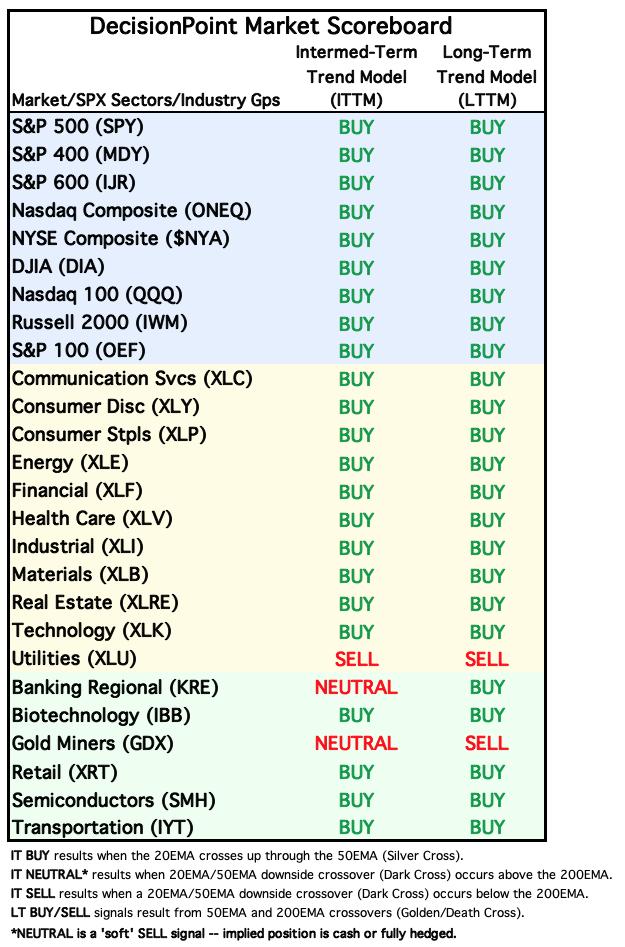

CLICK HERE for Carl's annotated Market Index, Sector, and Industry Group charts.
THE MARKET (S&P 500)
IT Trend Model: BUY as of 11/14/2023
LT Trend Model: BUY as of 3/29/2023
SPY Daily Chart: We still see a small declining trend in price in the very short term. While this is a sign of weakness, we have been fooled numerous times by these declines. The PMO triggered a Crossover SELL Signal today. The other primary indexes all hold negative PMO configurations as well.

We are watching the development of a bearish rising wedge that begs for a decline. At this point, the RSI is in positive territory and not overbought and Stochastics, while declining, are still holding above 80 for now. The VIX did see an increase that put it beneath its moving average on the inverted scale which could alert us to incoming weakness.


Here is the latest recording from 2/26:
Subscribe to our YouTube channel to get notified when recordings have been posted!
S&P 500 New 52-Week Highs/Lows: New Highs expanded on today's decline which is bullish. The 10-DMA of the High-Low Differential is back on the rise again but is very overbought.

Climax* Analysis: There were no climax readings today.

*A climax is a one-day event when market action generates very high readings in, primarily, breadth and volume indicators. We also include the VIX, watching for it to penetrate outside the Bollinger Band envelope. The vertical dotted lines mark climax days -- red for downside climaxes, and green for upside. Climaxes are at their core exhaustion events; however, at price pivots they may be initiating a change of trend.
Short-Term Market Indicators: The short-term market trend is UP and the condition is NEUTRAL.
Swenlin Trading Oscillators (STOs) turned down today. They have been especially twitchy of late but a decline is generally bad news. We only saw a slight decline in participation and we do still have more than half of the index holding rising momentum. We'll need more than that to get this rally back up and running. Negative divergences continue to bother us.

Intermediate-Term Market Indicators: The intermediate-term market trend is UP and the condition is NEUTRAL.
The ITBM and ITVM both rose strongly despite the downturn in the STOs. This does suggest that the weakness seeping in is likely to stay in the short-term timeframe rather than bleed out into the intermediate term. The negative divergences also plague this chart. We should have far more PMO BUY Signals at this point in the rally.

PARTICIPATION: The following chart objectively shows the depth and trend of participation in two time frames.
- Intermediate-Term - the Silver Cross Index (SCI) shows the percentage of SPX stocks on IT Trend Model BUY signals (20-EMA > 50-EMA). The opposite of the Silver Cross is a "Dark Cross" -- those stocks are, at the very least, in a correction.
- Long-Term - the Golden Cross Index (GCI) shows the percentage of SPX stocks on LT Trend Model BUY signals (50-EMA > 200-EMA). The opposite of a Golden Cross is the "Death Cross" -- those stocks are in a bear market.
The market bias is BULLISH in the short term.
The market bias is BEARISH in the intermediate term.
The market bias is BULLISH in the long term.
All of the relevant indicators are reading above 50% which is above our bullish threshold so the ST Bias is listed as BULLISH. The SCI has flattened, but remains beneath its signal line so our IT Bias is BEARISH. The GCI has also flattened, but remains above its signal line so the LT Bias is BULLISH.

BIAS Assessment: The following table expresses the current BIAS of various price indexes based upon the relationship of the Silver Cross Index to its 10-day EMA (intermediate-term), and of the Golden Cross Index to its 20-day EMA (long-term). When the Index is above the EMA it is bullish, and it is bearish when the Index is below the EMA. The BIAS does not imply that any particular action should be taken. It is information to be used in the decision process.
The items with highlighted borders indicate that the BIAS changed today.

**************************************************************************************
CONCLUSION: Indicators were mixed today, but we found it encouraging to see more New Highs and the uptick in the 10-DMA of the High-Low Differential. Unfortunately the STOs turned down and we do have a small declining trend to deal with. The negative divergences are prevalent on all of our indicators, but at least the ITBM and ITVM continue to make their way higher. The Mag7 have essentially hijacked the large-cap indexes so despite some issues with rising momentum within the indexes, the market has moved higher. They showed weakness today and it depressed the market. The NVIDIA hangover isn't helping. The CPE report will be released tomorrow and that could easily sway the market in either direction depending on investors' outlook. Stops are the best protection right now and offer us a way to enjoy more rally if there is more to come, yet have a safety net should the market turn on increasing weakness.
Erin is 65% long, 0% short.
**************************************************************************************
Erin will be presenting a workshop and trading room on Finding Pure Strength with the PMO on Thursday at 9:45a PT with Traders Corner. If you'd like to attend or receive the recording, please sign up HERE.
Have you subscribed the DecisionPoint Diamonds yet? DP does the work for you by providing handpicked stocks/ETFs from exclusive DP scans! Add it with a discount! Contact support@decisionpoint.com for more information!
BITCOIN
Yesterday's comments still apply:
"Bitcoin is off to the races executing the prior bull flag formation to perfection. It is setting up a flagpole for another trip higher. The PMO is showing pure strength as it has surged above the signal line well above the zero line. Overbought conditions aren't generally a problem for Bitcoin. Stochastics are above 80 as well. Bitcoin looks very favorable right now."

BITCOIN ETFs

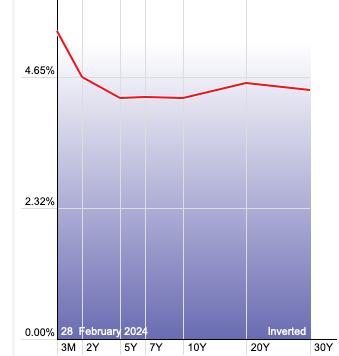
INTEREST RATES
Yields ticked down. Longer-term rates are looking a bit toppy in the thumbnail, but at this point we are still looking for an overall rise in yields.

The Yield Curve Chart from StockCharts.com shows us the inversions taking place. The red line should move higher from left to right. Inversions are occurring where it moves downward.
10-YEAR T-BOND YIELD
Yesterday's comments still apply:
"$TNX is struggling against overhead resistance and Stochastics have dipped below 80. The PMO and RSI remain healthy so our expectation is an eventual breakout. Given Stochastics, we may see more sideways movement along the 20-day EMA before a possible breakout."

BONDS (TLT)
IT Trend Model: SELL as of 2/20/2024
LT Trend Model: SELL as of 1/19/2022
TLT Daily Chart: The 20-year yield is beginning to look toppy and this would benefit TLT. Price action is mostly sideways right now and price is stuck beneath key moving averages currently. Even should the yield turn lower, we don't expect it would be a lasting condition. For now we are seeing diminishing weakness on the PMO. Stochastics are rising again so a little more upside is available.


DOLLAR (UUP)
IT Trend Model: BUY as of 1/23/2024
LT Trend Model: BUY as of 5/25/2023
UUP Daily Chart: The Dollar is trying to make a comeback, but today saw a bearish filled black candlestick which implies tomorrow will be a down day for the Dollar. The RSI is holding in positive territory, but the PMO is declining on a Crossover SELL Signal and Stochastics dipped below 20. We are still bearish on the Dollar.


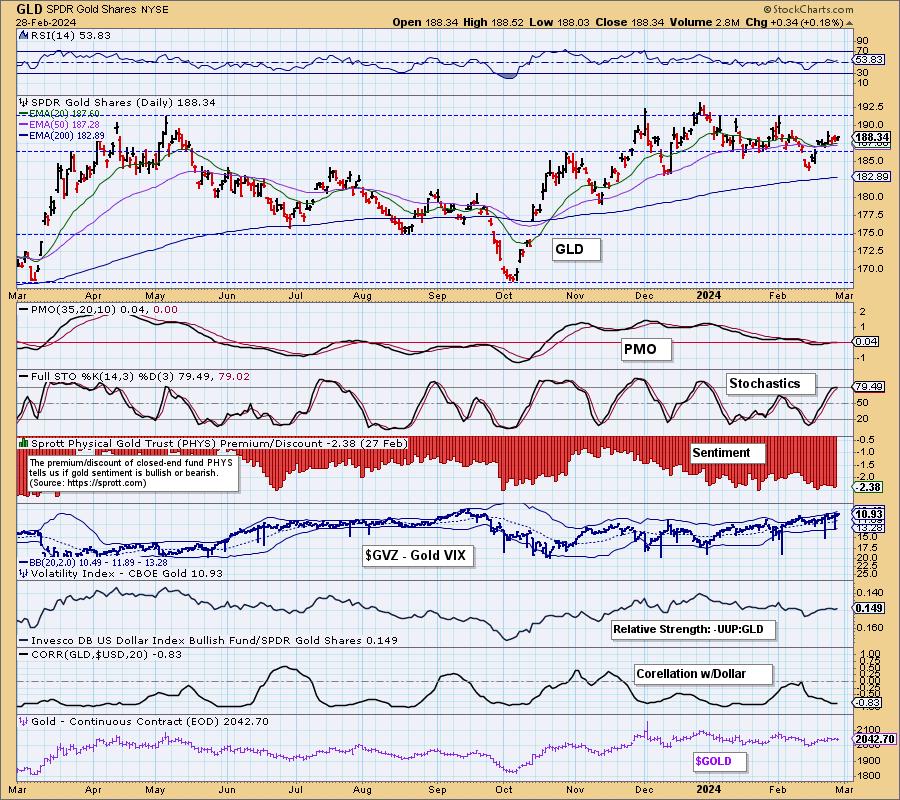
GOLD
IT Trend Model: BUY as of 10/23/2023
LT Trend Model: BUY as of 10/20/2023
GLD Daily Chart: Gold is meandering sideways but does appear to be melting up. The RSI is staying on the positive side of net neutral (50) right now. We have a new PMO Crossover BUY Signal and Stochastics are nearly above 80.

Discounts remain on the high end of the scale. This tells us that investors still very bearish on Gold. This prolonged condition could see an upside price reversal based on prior times we've had discounts at this level.
GOLD MINERS Golden and Silver Cross Indexes: Yesterday's comments still apply:
"We like Gold right now, but it is taking its time to rally. GDX needs the rally now so that we can get a bullish double bottom pattern. The indicators are still very weak as is participation. The market in general looks toppy and that will not work in GDX's favor. This industry group carries a lot of risk right now."

CRUDE OIL (USO)
IT Trend Model: BUY as of 2/12/2024
LT Trend Model: BUY as of 2/27/2024
USO Daily Chart: Crude Oil was lower on the day, but maintained above support and saw a higher low and higher high. We are looking for Crude to rally from here based on this cup-shaped basing pattern and rising PMO. Stochastics also suggest more upside.


Good Luck & Good Trading!
Erin Swenlin and Carl Swenlin
Technical Analysis is a windsock, not a crystal ball. --Carl Swenlin
(c) Copyright 2024 DecisionPoint.com
Disclaimer: This blog is for educational purposes only and should not be construed as financial advice. The ideas and strategies should never be used without first assessing your own personal and financial situation, or without consulting a financial professional. Any opinions expressed herein are solely those of the author, and do not in any way represent the views or opinions of any other person or entity.
DecisionPoint is not a registered investment advisor. Investment and trading decisions are solely your responsibility. DecisionPoint newsletters, blogs or website materials should NOT be interpreted as a recommendation or solicitation to buy or sell any security or to take any specific action.
NOTE: The signal status reported herein is based upon mechanical trading model signals, specifically, the DecisionPoint Trend Model. They define the implied bias of the price index based upon moving average relationships, but they do not necessarily call for a specific action. They are information flags that should prompt chart review. Further, they do not call for continuous buying or selling during the life of the signal. For example, a BUY signal will probably (but not necessarily) return the best results if action is taken soon after the signal is generated. Additional opportunities for buying may be found as price zigzags higher, but the trader must look for optimum entry points. Conversely, exit points to preserve gains (or minimize losses) may be evident before the model mechanically closes the signal.
Helpful DecisionPoint Links:
DecisionPoint Alert Chart List
DecisionPoint Golden Cross/Silver Cross Index Chart List
DecisionPoint Sector Chart List
Price Momentum Oscillator (PMO)
Swenlin Trading Oscillators (STO-B and STO-V)
Bear Market RulesGolden