
We will discuss today's Price Momentum Oscillator (PMO) SELL Signal on the SPY further down in the report. We decided to open with a discussion of the Nasdaq (ONEQ) as today saw the PMO top beneath the signal line.
There is now a declining short-term trend and participation has leveled off and isn't seeing much expansion. The Silver Cross Index (SCI) is still on the rise, but given we have a lower percentage of stocks above their 20/50-day EMAs in comparison to the SCI percentage. This means the SCI will not likely rise from here, but move lower. The chart isn't entirely negative given the positive RSI and rising Stochastics, but problems are developing that you should be aware of.

The DecisionPoint Alert Weekly Wrap presents an end-of-week assessment of the trend and condition of the Stock Market, the U.S. Dollar, Gold, Crude Oil, and Bonds. The DecisionPoint Alert daily report (Monday through Thursday) is abbreviated and gives updates on the Weekly Wrap assessments.
Watch the latest episode of DecisionPoint on StockCharts TV's YouTube channel here!
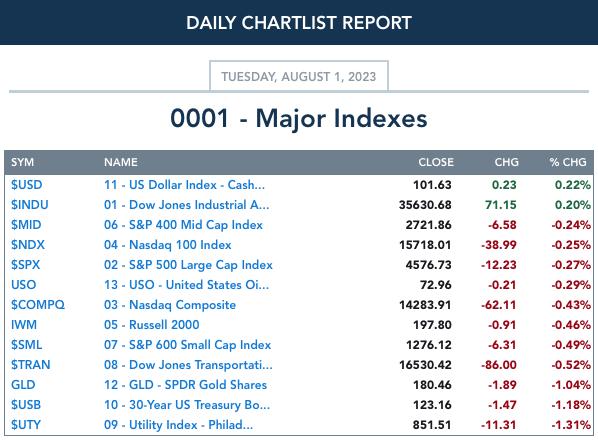
MAJOR MARKET INDEXES

SECTORS
Each S&P 500 Index component stock is assigned to one of 11 major sectors. This is a snapshot of the Intermediate-Term (Silver Cross) and Long-Term (Golden Cross) Trend Model signal status for those sectors.


CLICK HERE for Carl's annotated Market Index, Sector, and Industry Group charts.
THE MARKET (S&P 500)
IT Trend Model: BUY as of 3/30/2023
LT Trend Model: BUY as of 3/29/2023
SPY Daily Chart: The SPY is rising within a bearish rising wedge. With today's decline, a PMO Crossover SELL Signal was triggered.

The PMO isn't the only problem. Stochastics have been falling since last week. They remain over 80 so internal strength is visible, but given the complacent readings on the VIX and the new PMO SELL Signal, we need to be on alert.


Here is the latest recording:
S&P 500 New 52-Week Highs/Lows: Yesterday's comments still apply:
"We're noticing some problems on the NH/NL chart. First we have a clear negative divergence between price and New Highs. We have an overbought 10-DMA of the High-Low Differential and it is now in decline."

Climax* Analysis: There were no climax readings today.

*A climax is a one-day event when market action generates very high readings in, primarily, breadth and volume indicators. We also include the VIX, watching for it to penetrate outside the Bollinger Band envelope. The vertical dotted lines mark climax days -- red for downside climaxes, and green for upside. Climaxes are at their core exhaustion events; however, at price pivots they may be initiating a change of trend.
Short-Term Market Indicators: The short-term market trend is UP and the condition is NEUTRAL.
STOs finished lower with the STO-B flirting with negative territory. Only about 1/3rd of the index have rising momentum. This will reverberate through the market soon.

Intermediate-Term Market Indicators: The intermediate-term market trend is UP and the condition is OVERBOUGHT.
Both the ITBM and ITVM moved lower. They topped in overbought territory and are confirming our declining short-term indicators. Half of the index hold PMO BUY Signals, but given only 36% have rising PMOs, that percentage will be moving lower.

PARTICIPATION and BIAS Assessment: The following chart objectively shows the depth and trend of participation in two time frames.
- Intermediate-Term - the Silver Cross Index (SCI) shows the percentage of SPX stocks on IT Trend Model BUY signals (20-EMA > 50-EMA). The opposite of the Silver Cross is a "Dark Cross" -- those stocks are, at the very least, in a correction.
- Long-Term - the Golden Cross Index (GCI) shows the percentage of SPX stocks on LT Trend Model BUY signals (50-EMA > 200-EMA). The opposite of a Golden Cross is the "Death Cross" -- those stocks are in a bear market.
The market bias is NEUTRAL, but getting bearish.
We are seeing more deterioration of participation of stocks above their 20/50-day EMAs. This deterioration has caused the Silver Cross Index to top. While we still could see more Golden Crosses based on 70%+ readings on %Stocks > 50/200-day EMAs, it has already topped.

CONCLUSION: Two major bearish indications occurred today, a PMO Crossover SELL Signal and a topping Silver Cross Index. Short-term and intermediate-term indicators are in decline and participation continues to thin. With only 36% of the index holding rising momentum, the deterioration is likely to continue. Mega-caps held up the market before and many of their charts hold bullish biases, but looking at the broader market, we see new weakness. It's been a good run, but now it is time to exercise caution.
Erin is 50% long, 0% short.
Have you subscribed the DecisionPoint Diamonds yet? DP does the work for you by providing handpicked stocks/ETFs from exclusive DP scans! Add it with a discount! Contact support@decisionpoint.com for more information!
BITCOIN
We said yesterday that Bitcoin was vulnerable to a breakdown. We did see price dip below support, but it managed to right the ship. Indicators are mostly bearish so we expect the intermediate-term rising trendline to be reached.

INTEREST RATES
Yields are in rising trends and will likely continue to rise and test prior highs.

The Yield Curve Chart from StockCharts.com shows us the inversions taking place. The red line should move higher from left to right. Inversions are occurring where it moves downward.

10-YEAR T-BOND YIELD
Overhead resistance is nearing, but given the new PMO BUY Signal from yesterday, the positive RSI and rising Stochastics, we expect a breakout.

BONDS (TLT)
IT Trend Model: SELL as of 5/16/2023
LT Trend Model: SELL as of 1/19/2022
TLT Daily Chart: Support was broken on a big bearish red candlestick. The 20-year yield is breaking out and will continue to put downside pressure on TLT. The March low is still available to provide support, but given the very negative indicators, we believe price will continue lower.


DOLLAR (UUP)
IT Trend Model: NEUTRAL as of 7/13/2023
LT Trend Model: BUY as of 5/25/2023
UUP Daily Chart: Yesterday's comments still apply:
"The Dollar is making a comeback and the PMO as well as Stochastics suggest this rally will test overhead resistance at the May/June tops."


GOLD
IT Trend Model: BUY as of 7/26/2023
LT Trend Model: BUY as of 1/5/2023
GLD Daily Chart: Support continues to hold on GLD, but the chart doesn't favor a breakout yet. We will say that $GOLD's chart is far more bullish so we expect support will continue to hold in spite of a strong Dollar.

GOLD Daily Chart: As noted above, $GOLD has a bullish chart. Given the strong rally in the Dollar, it wasn't surprising to see a decline on Gold today. However, $GOLD has a rising PMO and positive RSI. Stochastics are rising and are back above 80. We think Gold will hold its rising trend.

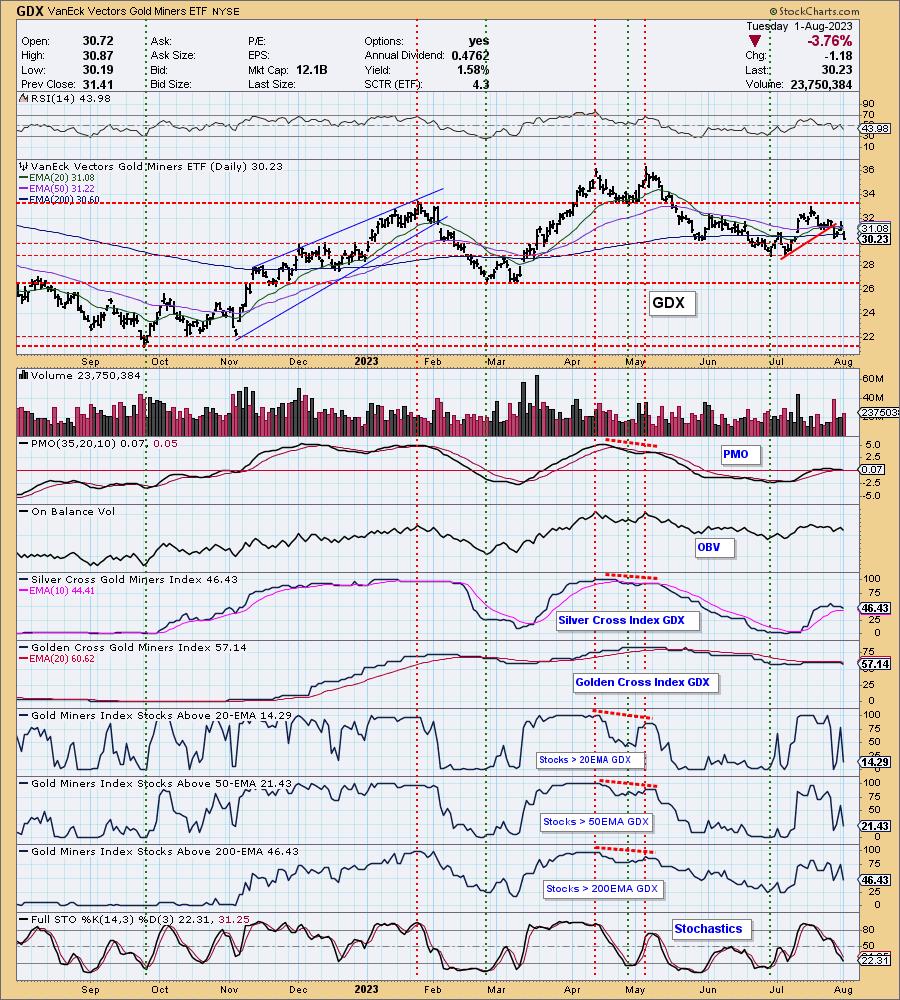
GOLD MINERS Golden and Silver Cross Indexes: Participation shot up yesterday, but was killed on today's big decline. The Silver Cross Index has topped and the Golden Cross Index had a Bearish Shift as it crossed below its signal line. Support is holding at the March low, but the PMO is nearing a Crossover SELL Signal. We don't like how this group is acting.
CRUDE OIL (USO)
IT Trend Model: BUY as of 7/12/2023
LT Trend Model: SELL as of 12/6/2022
USO Daily Chart: Crude Oil backed off today and reentered the bearish rising wedge. The decline nearly brought the RSI out of overbought territory. With such a strong PMO and Stochastics, we expect price to ultimately continue higher, it is simply time to consolidate after days of higher prices.

Price continues to hold above strong support even on today's decline.

Good Luck & Good Trading!
Erin Swenlin and Carl Swenlin
Technical Analysis is a windsock, not a crystal ball. --Carl Swenlin
(c) Copyright 2023 DecisionPoint.com
Disclaimer: This blog is for educational purposes only and should not be construed as financial advice. The ideas and strategies should never be used without first assessing your own personal and financial situation, or without consulting a financial professional. Any opinions expressed herein are solely those of the author, and do not in any way represent the views or opinions of any other person or entity.
NOTE: The signal status reported herein is based upon mechanical trading model signals, specifically, the DecisionPoint Trend Model. They define the implied bias of the price index based upon moving average relationships, but they do not necessarily call for a specific action. They are information flags that should prompt chart review. Further, they do not call for continuous buying or selling during the life of the signal. For example, a BUY signal will probably (but not necessarily) return the best results if action is taken soon after the signal is generated. Additional opportunities for buying may be found as price zigzags higher, but the trader must look for optimum entry points. Conversely, exit points to preserve gains (or minimize losses) may be evident before the model mechanically closes the signal.
Helpful DecisionPoint Links:
DecisionPoint Alert Chart List
DecisionPoint Golden Cross/Silver Cross Index Chart List
DecisionPoint Sector Chart List
Price Momentum Oscillator (PMO)
Swenlin Trading Oscillators (STO-B and STO-V)
DecisionPoint is not a registered investment advisor. Investment and trading decisions are solely your responsibility. DecisionPoint newsletters, blogs or website materials should NOT be interpreted as a recommendation or solicitation to buy or sell any security or to take any specific action.