
Just a reminder that we are in a period of negative seasonality until November 1. Seasonality is the tendency of the market to be weak or strong based on the seasonal activities of investors. For example, summer is weak due to vacations. Seasonal tendencies can be completely overcome by other market forces. On the chart below I have annotated the seasonal periods of the last three years, and we can conclude that seasonal gains and losses that comply with the seasonal tendency are purely coincidental.
Currently, we have a strong rally two and a half months into an unfavorable period. A seasonal decline can still emerge, but we may just need to beat the previous all-time high first.

The DecisionPoint Alert Weekly Wrap presents an end-of-week assessment of the trend and condition of the Stock Market, the U.S. Dollar, Gold, Crude Oil, and Bonds. The DecisionPoint Alert daily report (Monday through Thursday) is abbreviated and gives updates on the Weekly Wrap assessments.
Watch the latest episode of DecisionPoint on StockCharts TV's YouTube channel here!
MAJOR MARKET INDEXES


SECTORS
Each S&P 500 Index component stock is assigned to one of 11 major sectors. This is a snapshot of the Intermediate-Term (Silver Cross) and Long-Term (Golden Cross) Trend Model signal status for those sectors.


CLICK HERE for Carl's annotated Market Index, Sector, and Industry Group charts.
THE MARKET (S&P 500)
IT Trend Model: BUY as of 3/30/2023
LT Trend Model: BUY as of 3/29/2023
SPY Daily Chart: The market made another new 52-week high today, and it was confirmed by solid volume.

Today's new high was also confirmed by OBV.


Here is the latest recording:
S&P 500 New 52-Week Highs/Lows: New Highs contracted today, preserving the negative divergence versus another new high for SPY. Yesterday I said: "These negative divergences, though very short-term, can signal sharp reversals in that time frame." That still goes.

Climax* Analysis: There were no climax readings today.

*A climax is a one-day event when market action generates very high readings in, primarily, breadth and volume indicators. We also include the VIX, watching for it to penetrate outside the Bollinger Band envelope. The vertical dotted lines mark climax days -- red for downside climaxes, and green for upside. Climaxes are at their core exhaustion events; however, at price pivots they may be initiating a change of trend.
Short-Term Market Indicators: The short-term market trend is UP and the condition is OVERBOUGHT. The STOs continued to fall, so we're still looking for a pullback.
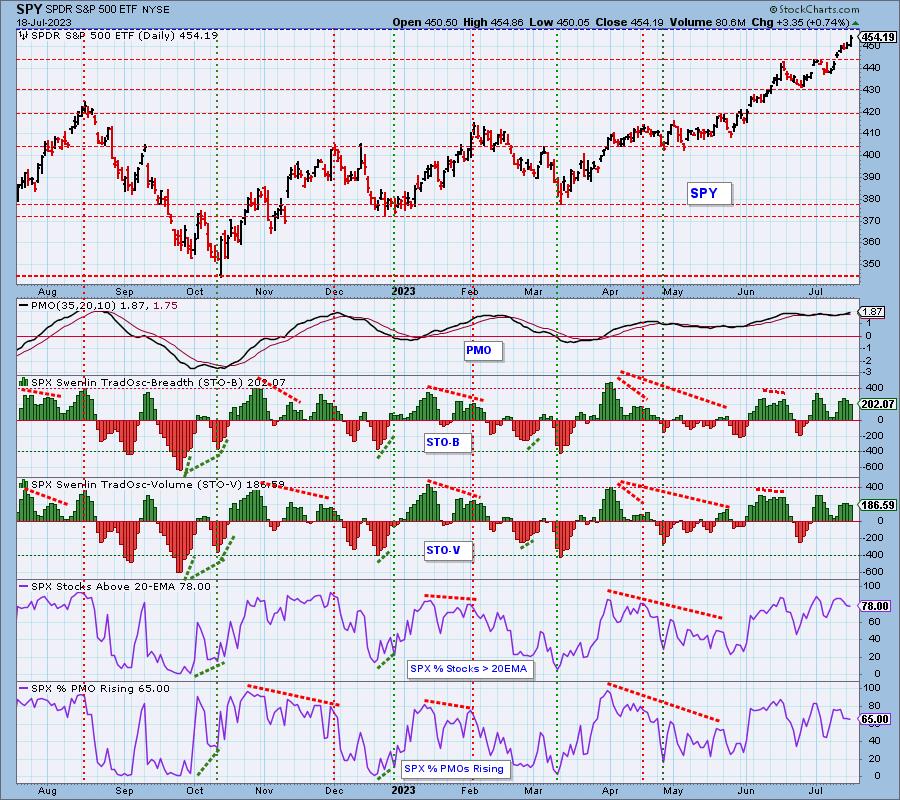
Intermediate-Term Market Indicators: The intermediate-term market trend is UP and the condition is OVERBOUGHT. Still looking for a pullback in this time frame.

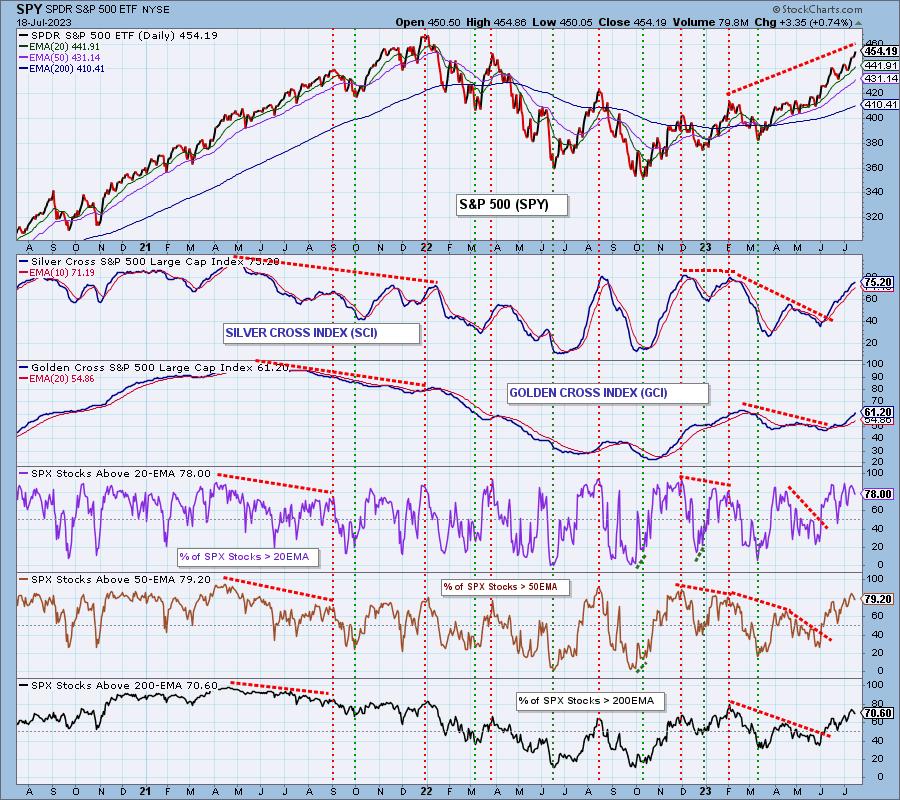
PARTICIPATION and BIAS Assessment: The following chart objectively shows the depth and trend of participation in two time frames.
- Intermediate-Term - the Silver Cross Index (SCI) shows the percentage of SPX stocks on IT Trend Model BUY signals (20-EMA > 50-EMA). The opposite of the Silver Cross is a "Dark Cross" -- those stocks are, at the very least, in a correction.
- Long-Term - the Golden Cross Index (GCI) shows the percentage of SPX stocks on LT Trend Model BUY signals (50-EMA > 200-EMA). The opposite of a Golden Cross is the "Death Cross" -- those stocks are in a bear market.
The SCI and GCI continue higher, but Stocks Above Their 20/50/200 EMAs have topped.
CONCLUSION: In spite of the market being overdue for some corrective action, we noticed that the SPY is within about 3.50 percent of making a new, all-time high, so we may be entering a stampede phase that will persist until those new record highs are made. Just speculating, of course, but the record is awfully close.
Of increasing interest is Gold. Be sure and see our comments below.
Erin is 50% long, 0% short.
Have you subscribed the DecisionPoint Diamonds yet? DP does the work for you by providing handpicked stocks/ETFs from exclusive DP scans! Add it with a discount! Contact support@decisionpoint.com for more information!
BITCOIN
Bitcoin continues to drift away (downward) from the overhead resistance.

INTEREST RATES
Rates have been rising within the trading range since the May lows.

The Yield Curve Chart from StockCharts.com shows us the inversions taking place. The red line should move higher from left to right. Inversions are occurring where it moves downward.

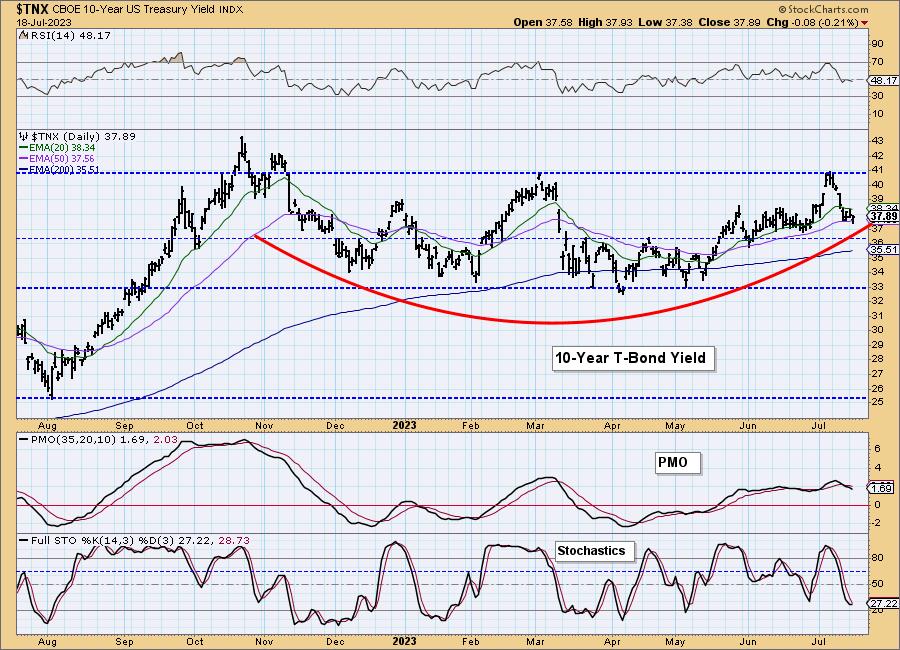
10-YEAR T-BOND YIELD
We have proposed a saucer formation, and now we wait for the handle to form, or for the saucer to break down.
BONDS (TLT)
IT Trend Model: SELL as of 5/16/2023
LT Trend Model: SELL as of 1/19/2022
TLT Daily Chart: TLT rallied off the July lows and is about to set up a rising trend. It just needs to exceed last week's high.

Price remains within an seven-month trading range.

DOLLAR (UUP)
IT Trend Model: NEUTRAL as of 7/13/2023
LT Trend Model: BUY as of 5/25/2023
UUP Daily Chart: UUP has found short-term support, but the bad news it that it is forming a bearish reverse flag.

UUP is currently testing the bottom of a five-month trading range.

GOLD
IT Trend Model: NEUTRAL as of 6/8/2023
LT Trend Model: BUY as of 1/5/2023
GLD Daily Chart: GLD ended the handle formation in four days and broke up and away from it today. While this cup with handle formation is short-term in nature, the fact that it has occurred after a longer-term bearish rounded top, today's break away has much stronger bullish implications.

GOLD Daily Chart: We should note that the May top is the all-time high for $GOLD, and it is about 5.5% away from exceeding that high. We think that will happen soon. It is also interesting to note that sentiment has still not caught up with the rising trend.

GOLD MINERS Golden and Silver Cross Indexes: Gold Miners broke out of the flag formation today.

CRUDE OIL (USO)
IT Trend Model: BUY as of 7/12/2023
LT Trend Model: SELL as of 12/6/2022
USO Daily Chart: After breaking above short-term resistance, USO made a technical pullback to the point of breakout and is now continuing the rising trend. Textbook.
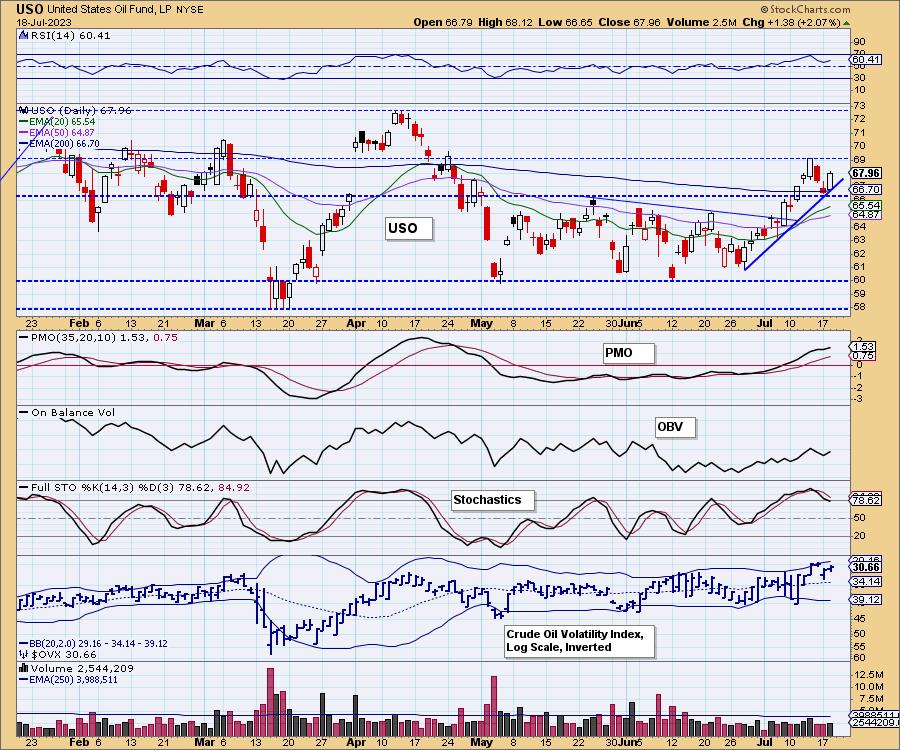
We'll be looking for a break above the horizontal overhead resistance, as well as the top of the triangle.

Good Luck & Good Trading!
Erin Swenlin and Carl Swenlin
Technical Analysis is a windsock, not a crystal ball. --Carl Swenlin
(c) Copyright 2023 DecisionPoint.com
Disclaimer: This blog is for educational purposes only and should not be construed as financial advice. The ideas and strategies should never be used without first assessing your own personal and financial situation, or without consulting a financial professional. Any opinions expressed herein are solely those of the author, and do not in any way represent the views or opinions of any other person or entity.
NOTE: The signal status reported herein is based upon mechanical trading model signals, specifically, the DecisionPoint Trend Model. They define the implied bias of the price index based upon moving average relationships, but they do not necessarily call for a specific action. They are information flags that should prompt chart review. Further, they do not call for continuous buying or selling during the life of the signal. For example, a BUY signal will probably (but not necessarily) return the best results if action is taken soon after the signal is generated. Additional opportunities for buying may be found as price zigzags higher, but the trader must look for optimum entry points. Conversely, exit points to preserve gains (or minimize losses) may be evident before the model mechanically closes the signal.
Helpful DecisionPoint Links:
DecisionPoint Alert Chart List
DecisionPoint Golden Cross/Silver Cross Index Chart List
DecisionPoint Sector Chart List
Price Momentum Oscillator (PMO)
Swenlin Trading Oscillators (STO-B and STO-V)
DecisionPoint is not a registered investment advisor. Investment and trading decisions are solely your responsibility. DecisionPoint newsletters, blogs or website materials should NOT be interpreted as a recommendation or solicitation to buy or sell any security or to take any specific action.