
Headline on FOX Business: FTC Readies Anti-Trust Lawsuit Against Amazon
I have been wondering when this was going to happen, but it is just the beginning of a process that will take years. I don't want to hurt my brain by speculating about how this will ultimately end, but the working through it won't be a good thing. AMZN was under some pressure today, but still looks relatively bullish. The rising trend got to be a little steep, and price is currently correcting back to a less accelerated rising trend line.

________________
Comments regarding Gold will be found in the Gold Section below.
The DecisionPoint Alert Weekly Wrap presents an end-of-week assessment of the trend and condition of the Stock Market, the U.S. Dollar, Gold, Crude Oil, and Bonds. The DecisionPoint Alert daily report (Monday through Thursday) is abbreviated and gives updates on the Weekly Wrap assessments.
Watch the latest episode of DecisionPoint on StockCharts TV's YouTube channel here!
MAJOR MARKET INDEXES


SECTORS
Each S&P 500 Index component stock is assigned to one of 11 major sectors. This is a snapshot of the Intermediate-Term (Silver Cross) and Long-Term (Golden Cross) Trend Model signal status for those sectors.


CLICK HERE for Carl's annotated Market Index, Sector, and Industry Group charts.
THE MARKET (S&P 500)
IT Trend Model: BUY as of 3/30/2023
LT Trend Model: BUY as of 3/29/2023
SPY Daily Chart: The Fed raised rates 25 basis points, as expected. Chairman Powell's comments weren't particularly encouraging to interest rate doves. The inverted scale VIX is close to the upper Bollinger Band, a level we consider to be overbought.


Here is the latest recording:
S&P 500 New 52-Week Highs/Lows: New Highs contracted today, and we still have a negative divergence.
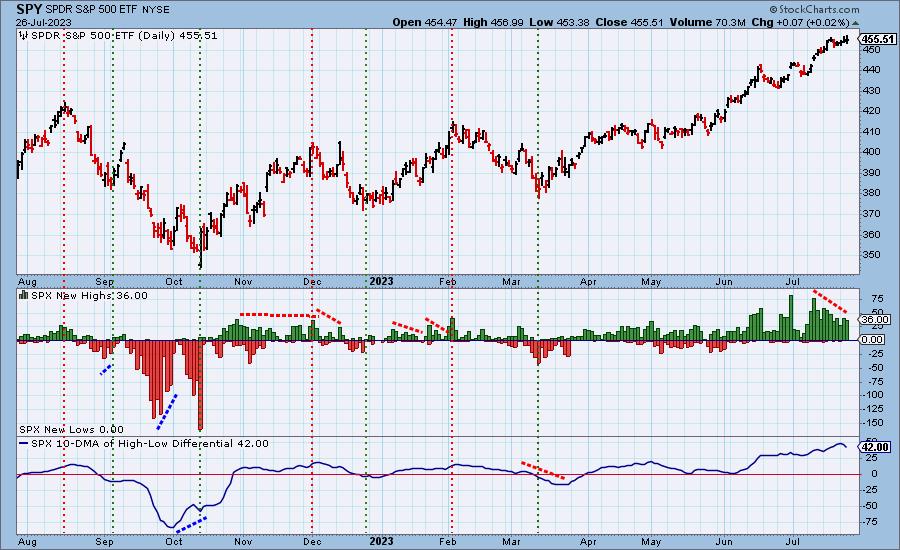
Climax* Analysis: There were no climax readings today.

*A climax is a one-day event when market action generates very high readings in, primarily, breadth and volume indicators. We also include the VIX, watching for it to penetrate outside the Bollinger Band envelope. The vertical dotted lines mark climax days -- red for downside climaxes, and green for upside. Climaxes are at their core exhaustion events; however, at price pivots they may be initiating a change of trend.
Short-Term Market Indicators: The short-term market trend is UP and the condition is OVERBOUGHT. Both of the STOs ticked downward today.

Intermediate-Term Market Indicators: The intermediate-term market trend is UP and the condition is OVERBOUGHT. We're still looking for tops on the ITBM and ITVM.

PARTICIPATION and BIAS Assessment: The following chart objectively shows the depth and trend of participation in two time frames.
- Intermediate-Term - the Silver Cross Index (SCI) shows the percentage of SPX stocks on IT Trend Model BUY signals (20-EMA > 50-EMA). The opposite of the Silver Cross is a "Dark Cross" -- those stocks are, at the very least, in a correction.
- Long-Term - the Golden Cross Index (GCI) shows the percentage of SPX stocks on LT Trend Model BUY signals (50-EMA > 200-EMA). The opposite of a Golden Cross is the "Death Cross" -- those stocks are in a bear market.
These indicators are all overbought, and the SCI and GCI are still rising.

CONCLUSION: The Fed did as expected, a 25 basis point increase, and Chairman Powell gave no hope that rate cuts would be in the near future. The next Fed meeting is September 19 and 20. Now with this latest Fed meeting out of the way, we go back to the reality of the market being very overbought and due for a correction. The ITBM and ITVM are particularly compelling, and we think it would be the wrong time to be opening new long positions.
Erin is 50% long, 0% short.
Have you subscribed the DecisionPoint Diamonds yet? DP does the work for you by providing handpicked stocks/ETFs from exclusive DP scans! Add it with a discount! Contact support@decisionpoint.com for more information!
BITCOIN
Bitcoin is in a rather large rising wedge, and price is trending toward the bottom.

INTEREST RATES
Rates ticked downward today, but the trend is up within a longer-term trading range.

The Yield Curve Chart from StockCharts.com shows us the inversions taking place. The red line should move higher from left to right. Inversions are occurring where it moves downward.

10-YEAR T-BOND YIELD
The saucer formation is bullish, and price is trending up from last week's low. The down tick on a day the Fed raised rates seems counterintuitive, but there it is.

BONDS (TLT)
IT Trend Model: SELL as of 5/16/2023
LT Trend Model: SELL as of 1/19/2022
TLT Daily Chart: Bonds rallied marginally, but the trend is still down from last week's top.


DOLLAR (UUP)
IT Trend Model: NEUTRAL as of 7/13/2023
LT Trend Model: BUY as of 5/25/2023
UUP Daily Chart: UUP fell today, continuing yesterday's reversal.


GOLD
IT Trend Model: BUY as of 7/26/2023
LT Trend Model: BUY as of 1/5/2023
GLD Daily Chart: Today the Gold Shares ETF (GLD) 20-day EMA crossed up through the 50-day EMA (Silver Cross), generating an IT Trend Model BUY Signal. The chart shows a bullish cup with handle formation, which we think is pointing to higher prices. The 20/50EMA crossover is not particularly robust, but we observe that upward progress with gold is usually tedious.


GOLD MINERS: Today the Gold Miners ETF (GDX) 20-day EMA crossed up through the 50-day EMA (Silver Cross), generating an IT Trend Model BUY Signal.

CRUDE OIL (USO)
IT Trend Model: BUY as of 7/12/2023
LT Trend Model: SELL as of 12/6/2022
USO Daily Chart: Today's decline formed a top, so we now have a bearish rising wedge. It is not too late for that to be reversed, but that's what we have at the moment.


Good Luck & Good Trading!
Erin Swenlin and Carl Swenlin
Technical Analysis is a windsock, not a crystal ball. --Carl Swenlin
(c) Copyright 2023 DecisionPoint.com
Disclaimer: This blog is for educational purposes only and should not be construed as financial advice. The ideas and strategies should never be used without first assessing your own personal and financial situation, or without consulting a financial professional. Any opinions expressed herein are solely those of the author, and do not in any way represent the views or opinions of any other person or entity.
NOTE: The signal status reported herein is based upon mechanical trading model signals, specifically, the DecisionPoint Trend Model. They define the implied bias of the price index based upon moving average relationships, but they do not necessarily call for a specific action. They are information flags that should prompt chart review. Further, they do not call for continuous buying or selling during the life of the signal. For example, a BUY signal will probably (but not necessarily) return the best results if action is taken soon after the signal is generated. Additional opportunities for buying may be found as price zigzags higher, but the trader must look for optimum entry points. Conversely, exit points to preserve gains (or minimize losses) may be evident before the model mechanically closes the signal.
Helpful DecisionPoint Links:
DecisionPoint Alert Chart List
DecisionPoint Golden Cross/Silver Cross Index Chart List
DecisionPoint Sector Chart List
Price Momentum Oscillator (PMO)
Swenlin Trading Oscillators (STO-B and STO-V)
DecisionPoint is not a registered investment advisor. Investment and trading decisions are solely your responsibility. DecisionPoint newsletters, blogs or website materials should NOT be interpreted as a recommendation or solicitation to buy or sell any security or to take any specific action.