
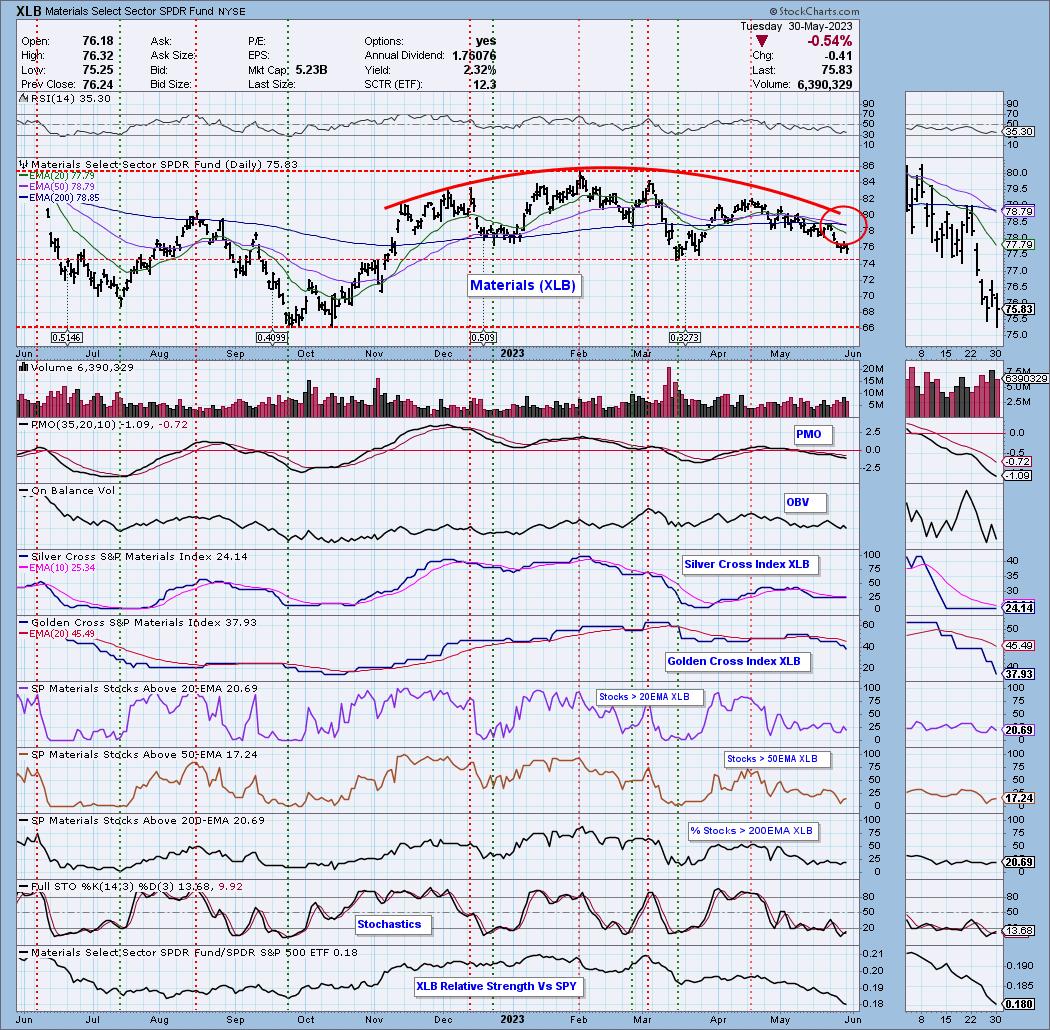
Today the Materials Sector (XLB) 50-day EMA crossed down through the 200-day EMA (Death Cross), generating an LT Trend Model SELL Signal. This signal is generated out of a flat price pattern, but because of the rounded top, we think that this signal has some credibility. Support is arriving soon, but given the negative indicators and poor participation, not to mention the negative configuration of the EMAs, a breakdown seems imminent.
The DecisionPoint Alert Weekly Wrap presents an end-of-week assessment of the trend and condition of the Stock Market, the U.S. Dollar, Gold, Crude Oil, and Bonds. The DecisionPoint Alert daily report (Monday through Thursday) is abbreviated and gives updates on the Weekly Wrap assessments.
Watch the latest episode of DecisionPoint on StockCharts TV's YouTube channel here!
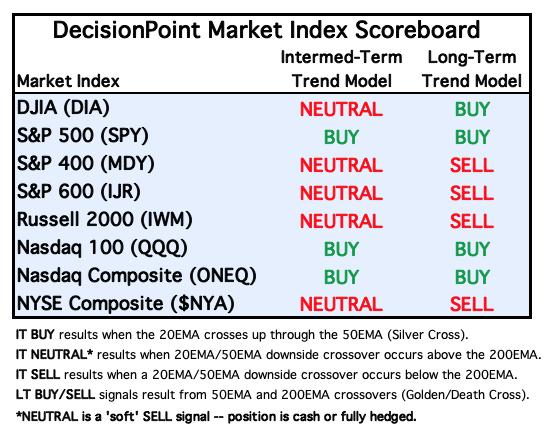
MAJOR MARKET INDEXES

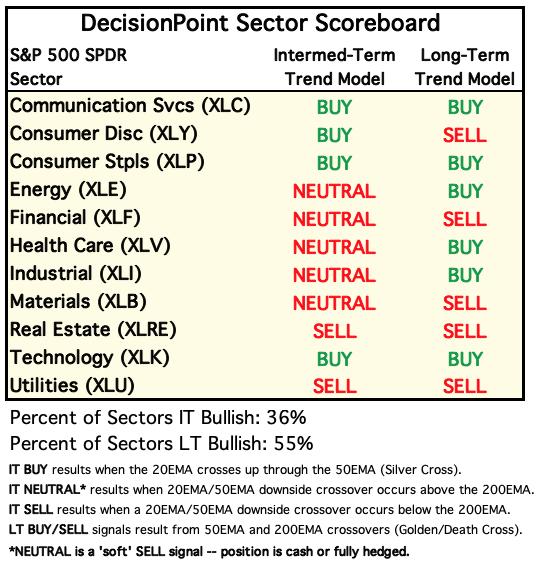
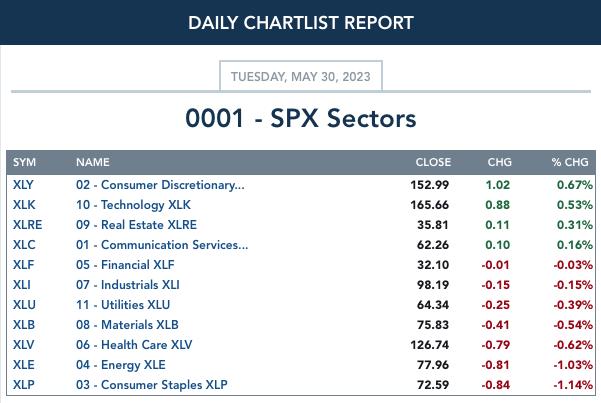
SECTORS
Each S&P 500 Index component stock is assigned to one of 11 major sectors. This is a snapshot of the Intermediate-Term (Silver Cross) and Long-Term (Golden Cross) Trend Model signal status for those sectors.
CLICK HERE for Carl's annotated Market Index, Sector, and Industry Group charts.
THE MARKET (S&P 500)
IT Trend Model: BUY as of 3/30/2023
LT Trend Model: BUY as of 3/29/2023
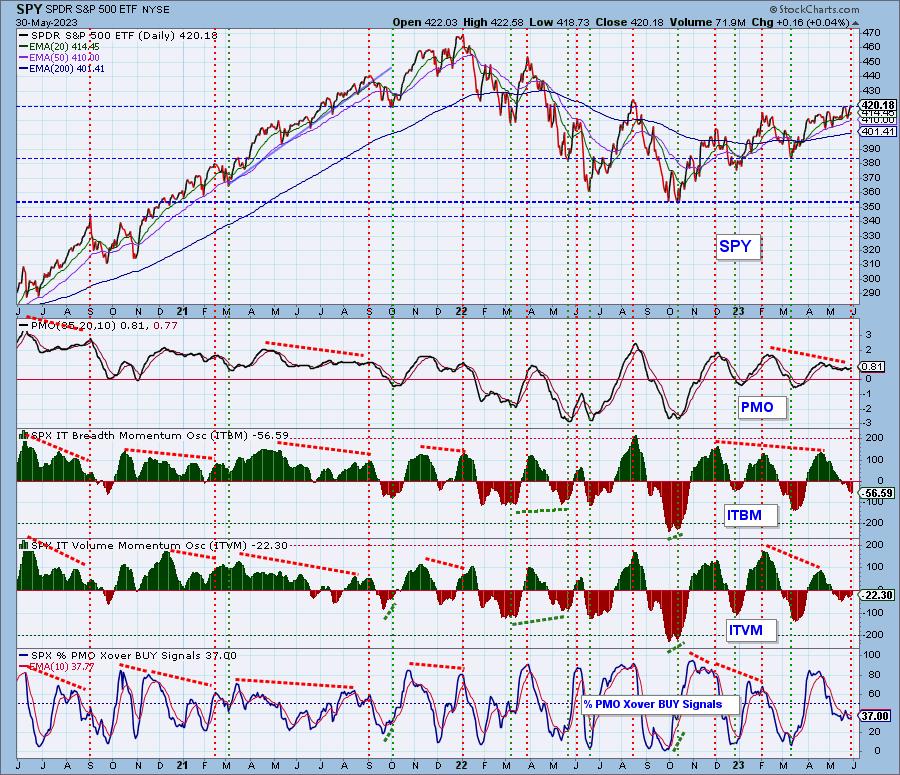
SPY Daily Chart: The day started with a sizable rally, but all of those gains were taken back. The RSI and PMO look healthy enough, but there is very little margin between the PMO and its signal line so a whipsaw SELL signal is dangerously close.
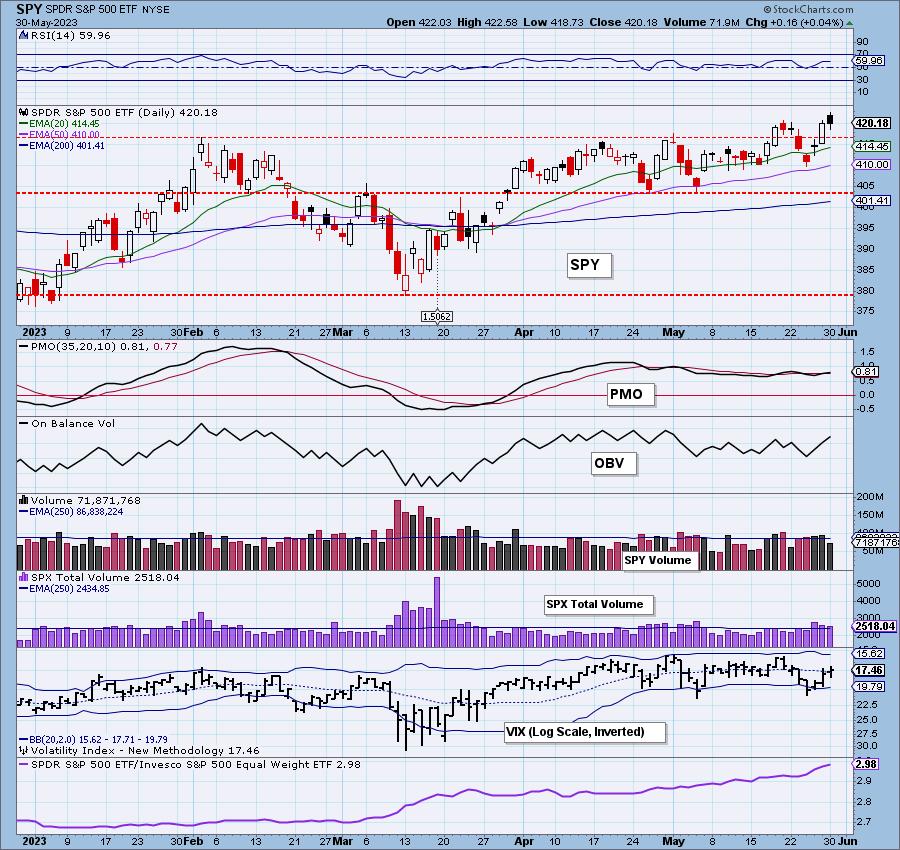
The VIX spent much of the day below its moving average on our inverted scale so that implies internal weakness. However, Stochastics are rising strongly, implying internal strength. We would split the difference and say that not internal weakness nor internal strength is visible.


Here is the latest recording:
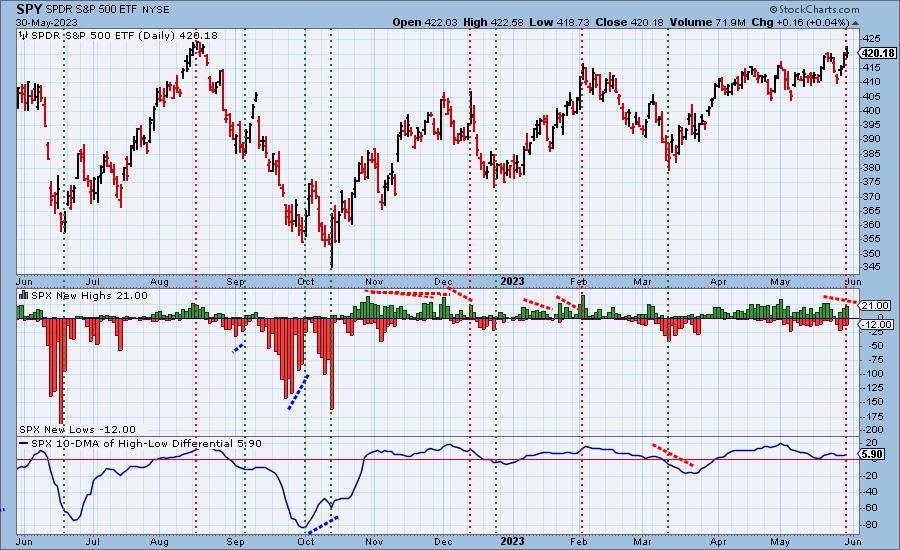
S&P 500 New 52-Week Highs/Lows: We have a clear negative divergence on New Highs. The continuing appearance of New Lows suggests this rally is far from broad.
Climax* Analysis: There were no climax readings today.
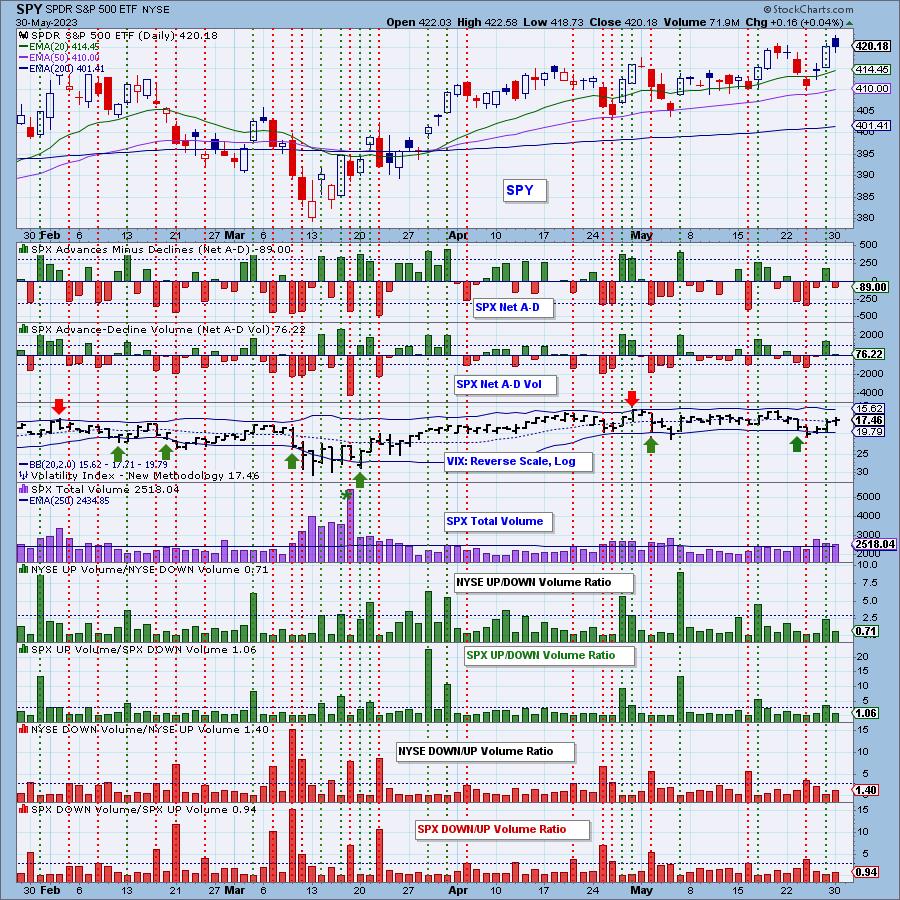
*A climax is a one-day event when market action generates very high readings in, primarily, breadth and volume indicators. We also include the VIX, watching for it to penetrate outside the Bollinger Band envelope. The vertical dotted lines mark climax days -- red for downside climaxes, and green for upside. Climaxes are at their core exhaustion events; however, at price pivots they may be initiating a change of trend.
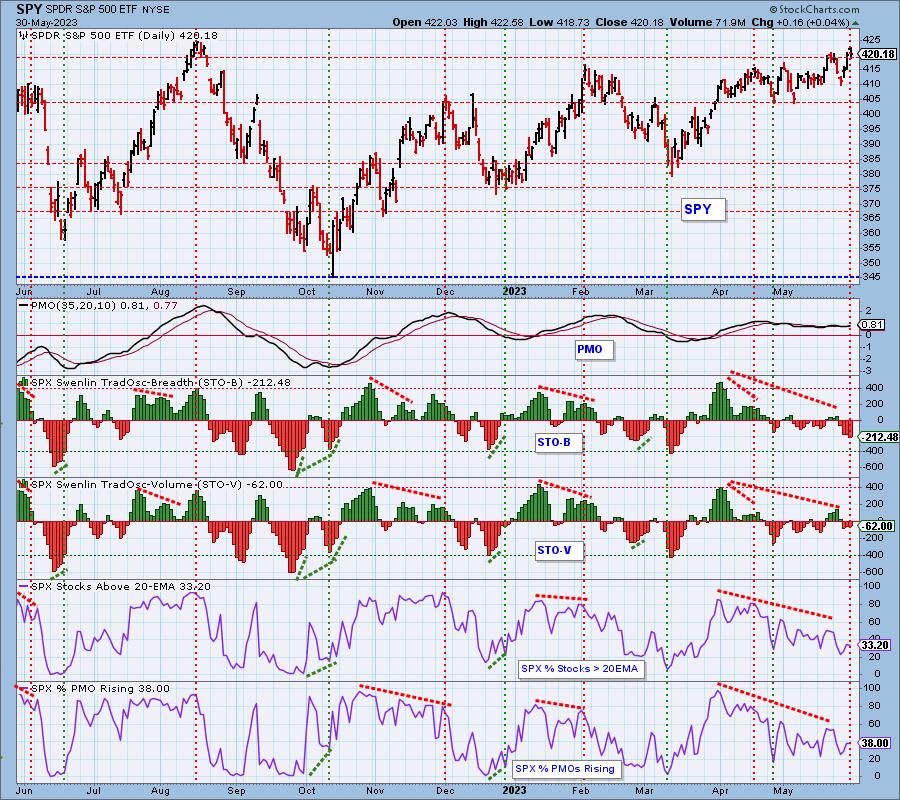
Short-Term Market Indicators: The short-term market trend is UP and the condition is OVERSOLD.
We are listing these indicators as "oversold" as they are near-term oversold. Both STOs moved lower on the day suggesting there are problems internally. On a mostly rally day, participation should have expanded, not contracted.
Intermediate-Term Market Indicators: The intermediate-term market trend is UP and the condition is NEUTRAL.
The ITBM continues lower, but the ITVM moved higher again today. Given poor participation and lack of rising momentum and BUY signals, we read this chart as bearish.
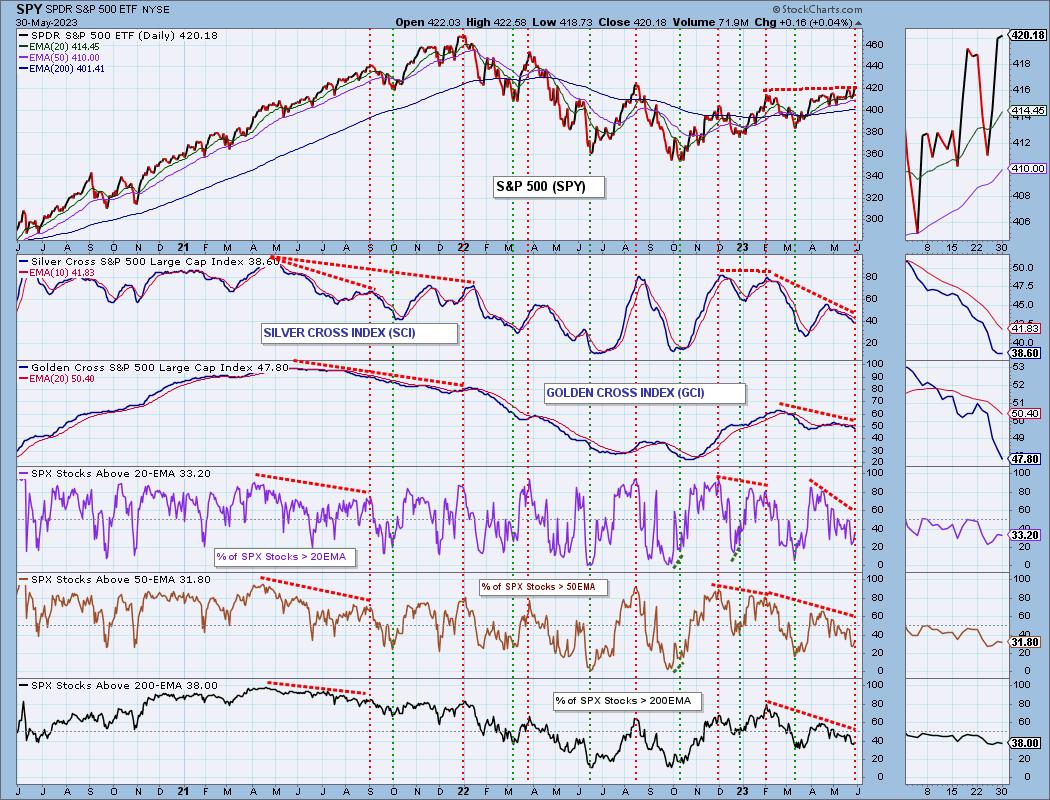
PARTICIPATION and BIAS Assessment: The following chart objectively shows the depth and trend of participation in two time frames.
- Intermediate-Term - the Silver Cross Index (SCI) shows the percentage of SPX stocks on IT Trend Model BUY signals (20-EMA > 50-EMA). The opposite of the Silver Cross is a "Dark Cross" -- those stocks are, at the very least, in a correction.
- Long-Term - the Golden Cross Index (GCI) shows the percentage of SPX stocks on LT Trend Model BUY signals (50-EMA > 200-EMA). The opposite of a Golden Cross is the "Death Cross" -- those stocks are in a bear market.
The bias is BEARISH in all three timeframes.
We have participation numbers all coming in less than our 50% bullish threshold. The Silver Cross Index is below its signal line and is flat. The Golden Cross Index is falling and will likely continue to fall as long as we have fewer stocks above their 50/200-day EMAs than we have Golden Crosses within the index.
CONCLUSION: Considering we had an upside initiation climax yesterday, we should've seen better SPY performance. We did not. While shorter-term indicators like the PMO and Stochastics are positive, our overall market indicators are bearish. We recently heard that the debt ceiling deal may not be as good for the market as many believe. It will open up an opportunity for investors to move back into shorter duration Bonds which would likely dry up much of the liquidity being used to fuel mega-caps higher. When they fail, and they will, the market will struggle and decline. Our bearish outlook has not changed.
Erin is 14% long, 7% short.
Have you subscribed the DecisionPoint Diamonds yet? DP does the work for you by providing handpicked stocks/ETFs from exclusive DP scans! Add it with a discount! Contact support@decisionpoint.com for more information!
BITCOIN
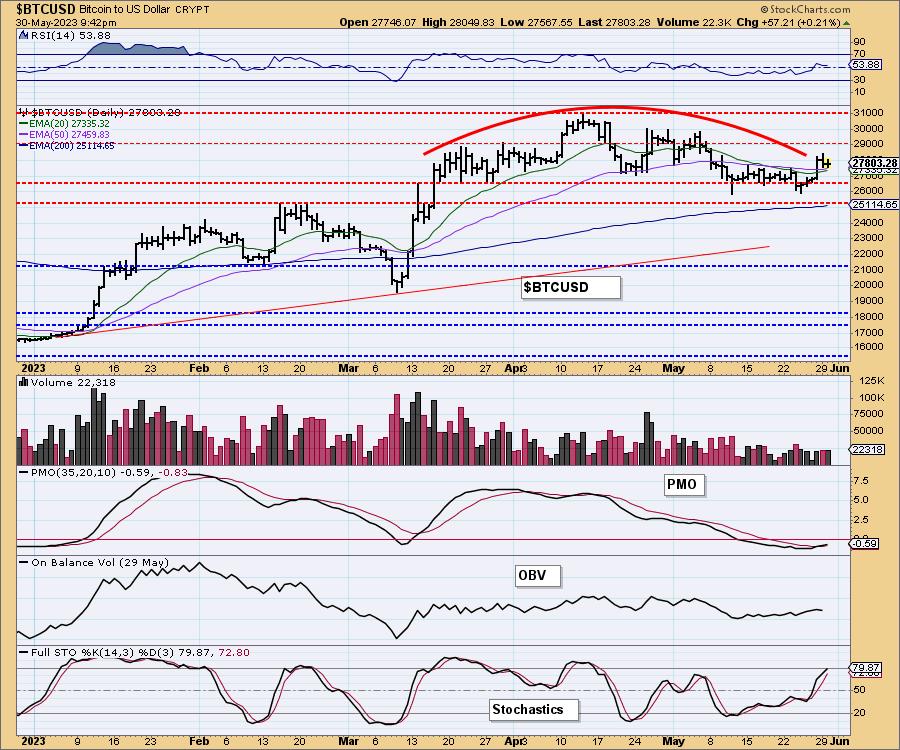
Bitcoin rallied and while it didn't really extinguish the bearish rounded top, it has bolsters the case for Bitcoin to rally higher. The RSI turned up in positive territory and the PMO is rising on a new Crossover BUY Signal. Stochastics are about to move into territory above 80 which is very bullish. We expect Bitcoin to extend its trading range between 27,000 and 31,000.
INTEREST RATES
The one-month yield dropped perilously as other yields also saw some pullback. Debt ceiling deal could work to the advantage of Bonds which would continue to bring rates lower.
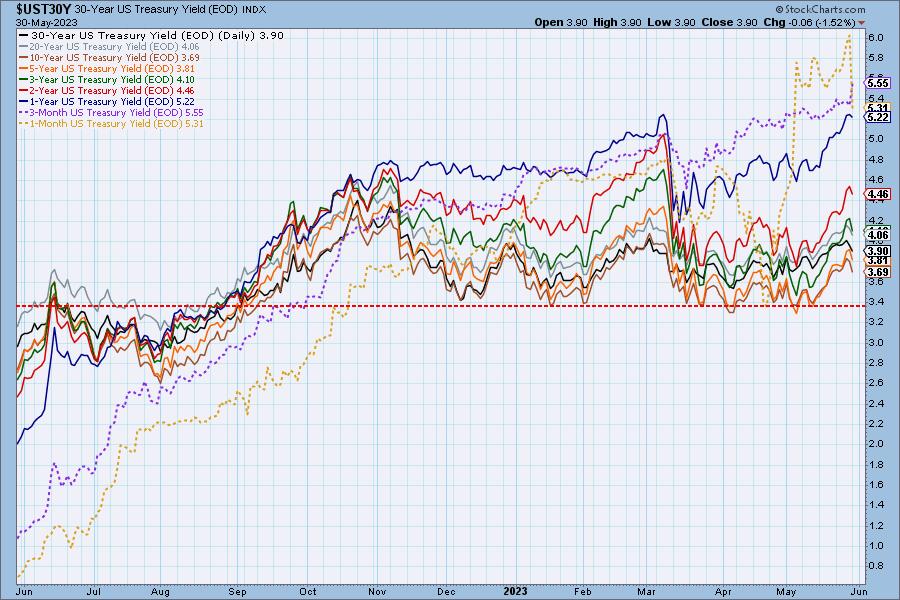
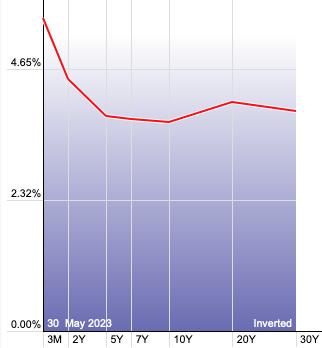
The Yield Curve Chart from StockCharts.com shows us the inversions taking place. The red line should move higher from left to right. Inversions are occurring where it moves downward.
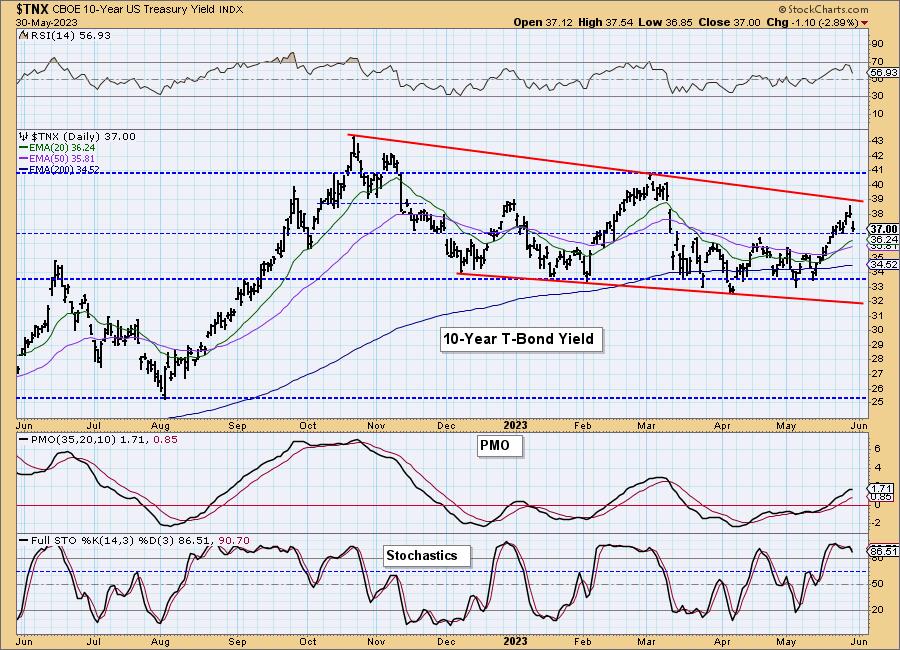
10-YEAR T-BOND YIELD
Today's pullback on $TNX took it back to support. Based on mostly positive indicators, we would look for a rebound here. However, if we are correct regarding the debt ceiling deal pulling liquidity back to Bonds, $TNX will suffer. We'll keep a close eye on this.
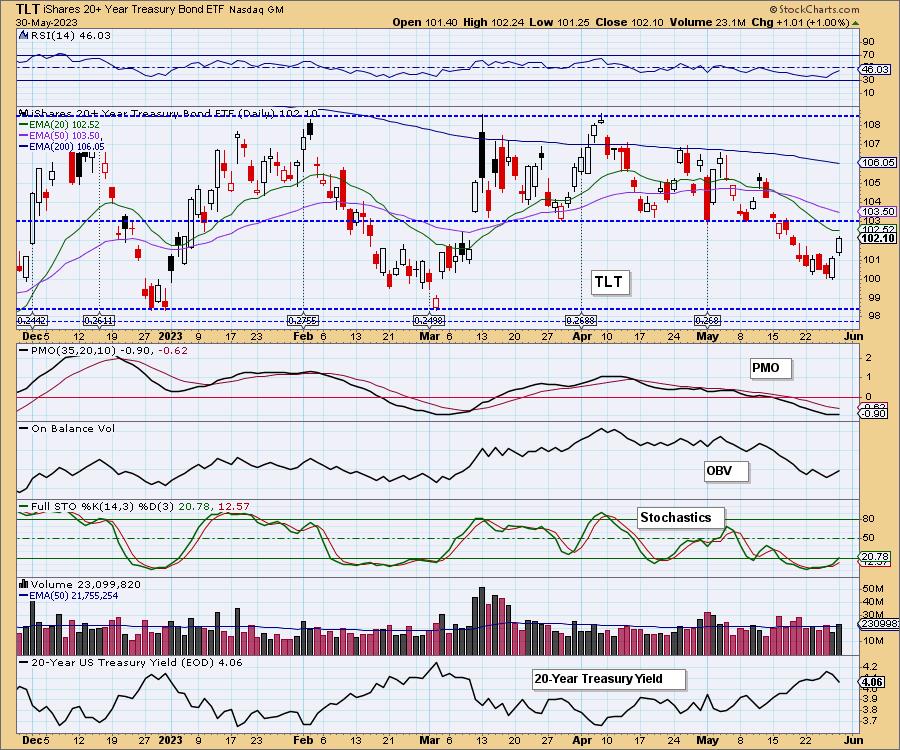
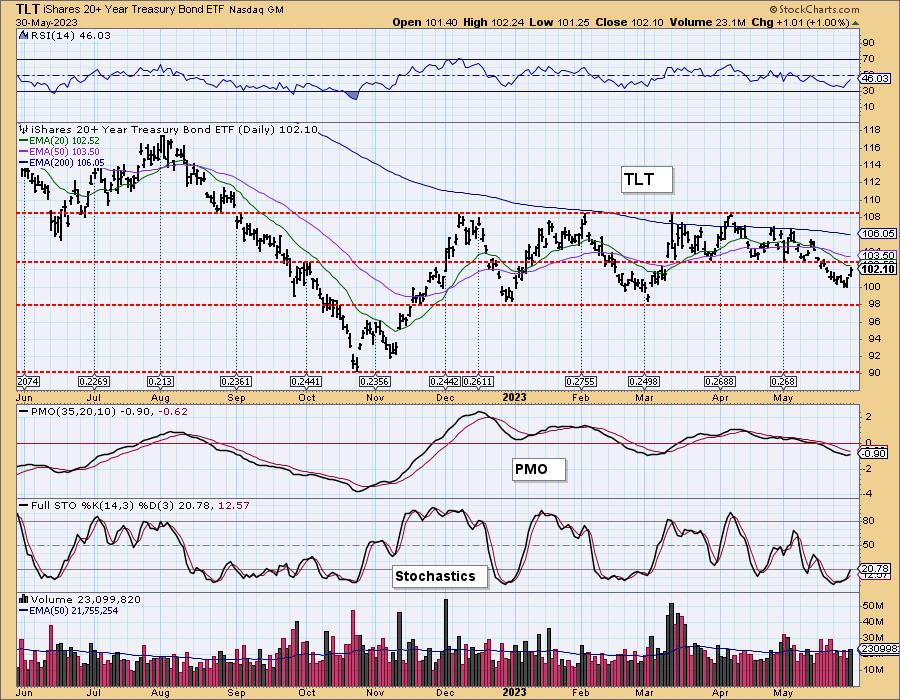
BONDS (TLT)
IT Trend Model: SELL as of 5/16/2023
LT Trend Model: SELL as of 1/19/2022
TLT Daily Chart: Bonds saw strength as the debt ceiling deal calmed fears of non-payment. Indicators are still mostly neutral so TLT will likely pause at overhead resistance or even at the 20-day EMA.
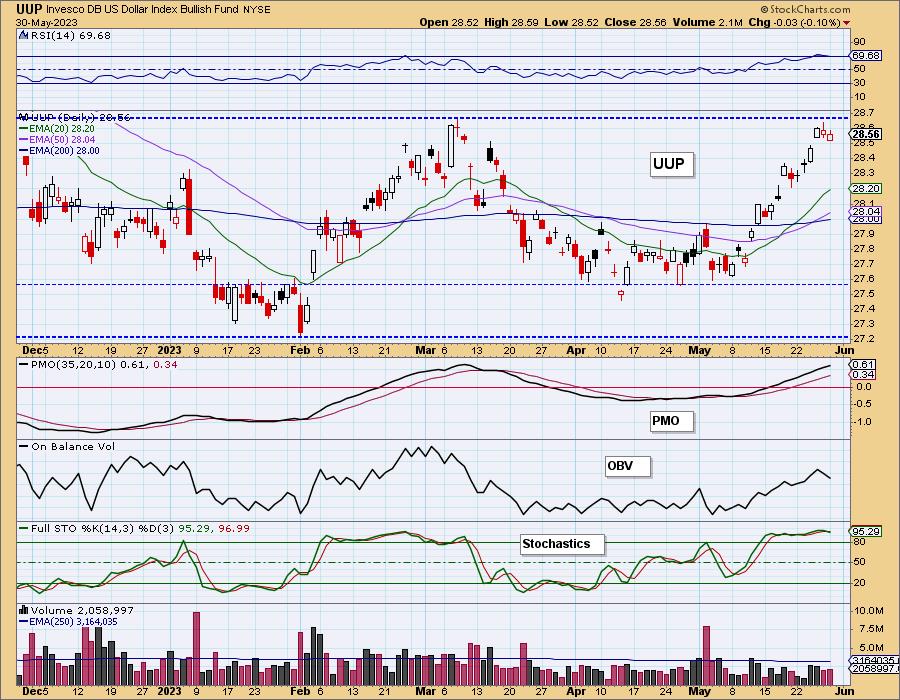
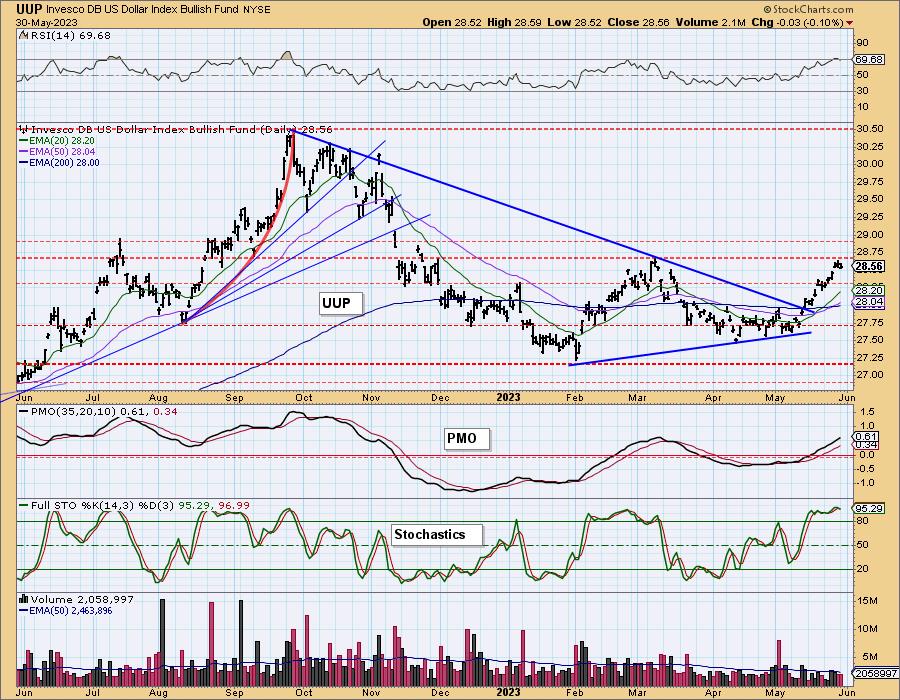
DOLLAR (UUP)
IT Trend Model: BUY as of 5/18/2023
LT Trend Model: SELL as of 4/12/2023
UUP Daily Chart: The Dollar hit overhead resistance and backed off. This moved the RSI out of overbought territory. The PMO and Stochastics are still very bullish so we expect a breakout here.
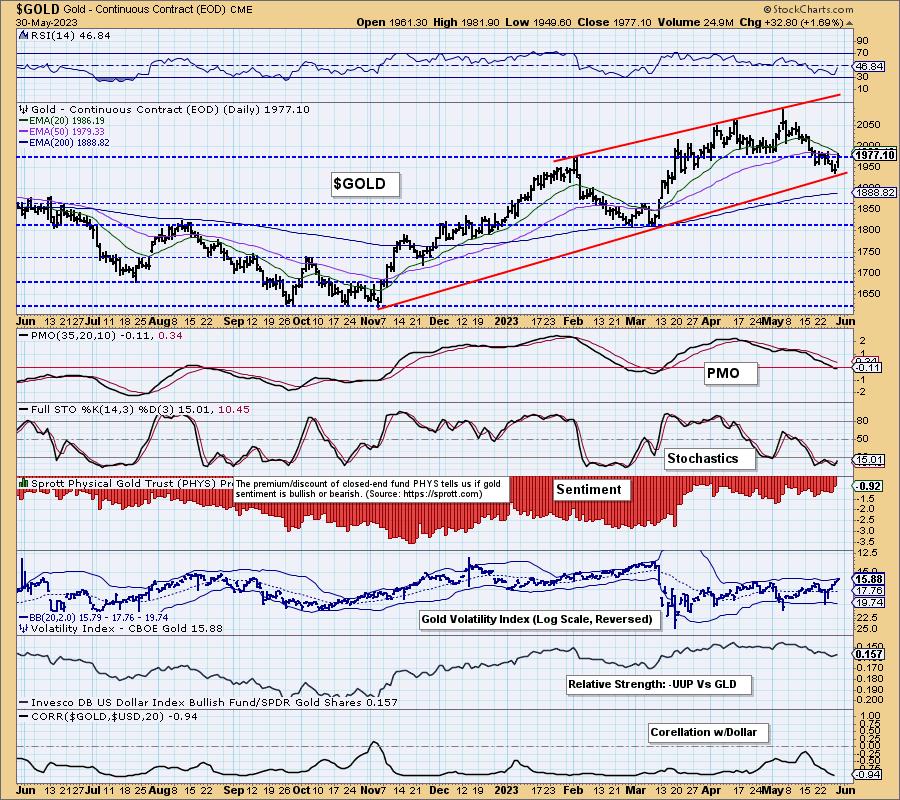
GOLD
IT Trend Model: BUY as of 3/7/2023
LT Trend Model: BUY as of 1/5/2023
GLD Daily Chart: Gold is holding support mainly because the Dollar hasn't broken out at current resistance. The two-day rise hasn't fixed negative indicators yet.

GOLD Daily Chart: The rebound of the long-term rising bottoms trendline is encouraging. If price can stay above the 50-day EMA, a Dark Cross of the 20/50-day EMAs could be avoided. $GVZ is at the top of the upper Bollinger Band on our inverted scale which many times will lead to decline in the very short term.
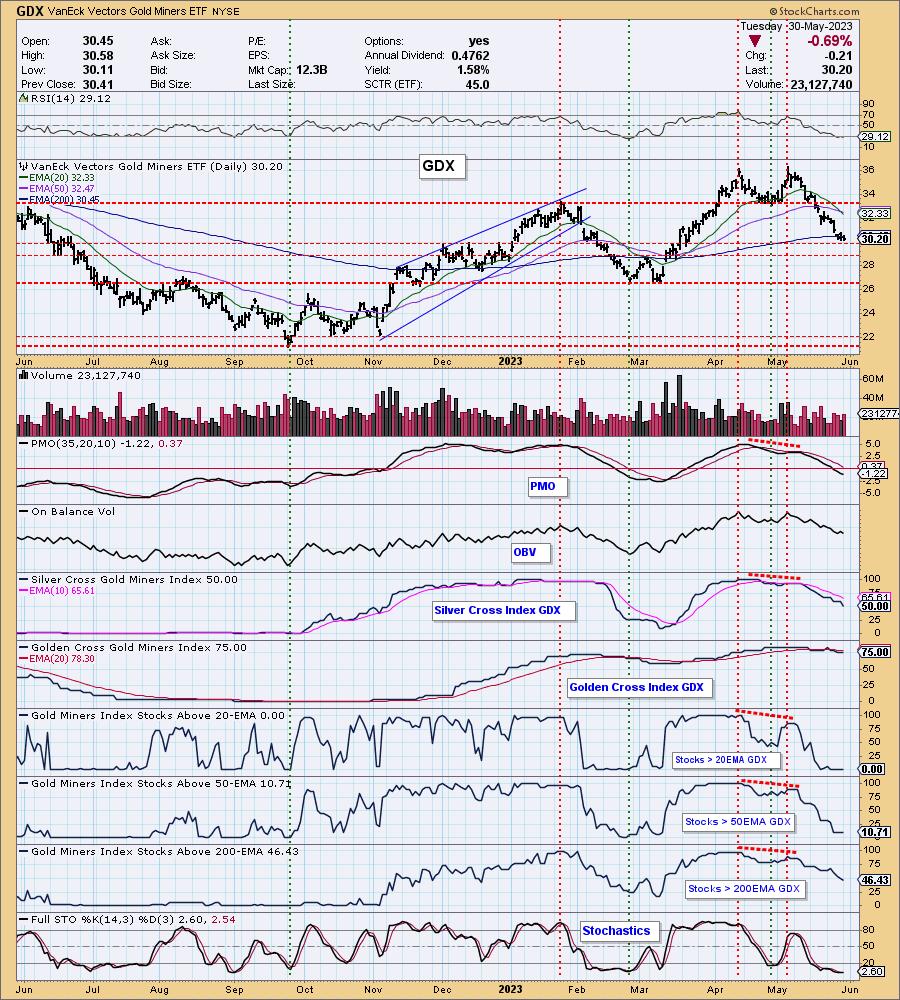
GOLD MINERS Golden and Silver Cross Indexes: It's time for Gold Miners to find support. However, notice the new Dark Cross of the 20/50-day EMAs. Also notice the complete lack of participation of stocks above their 20/50-day EMAs. While this is a good spot for a reversal, the numbers don't support a rally right now.
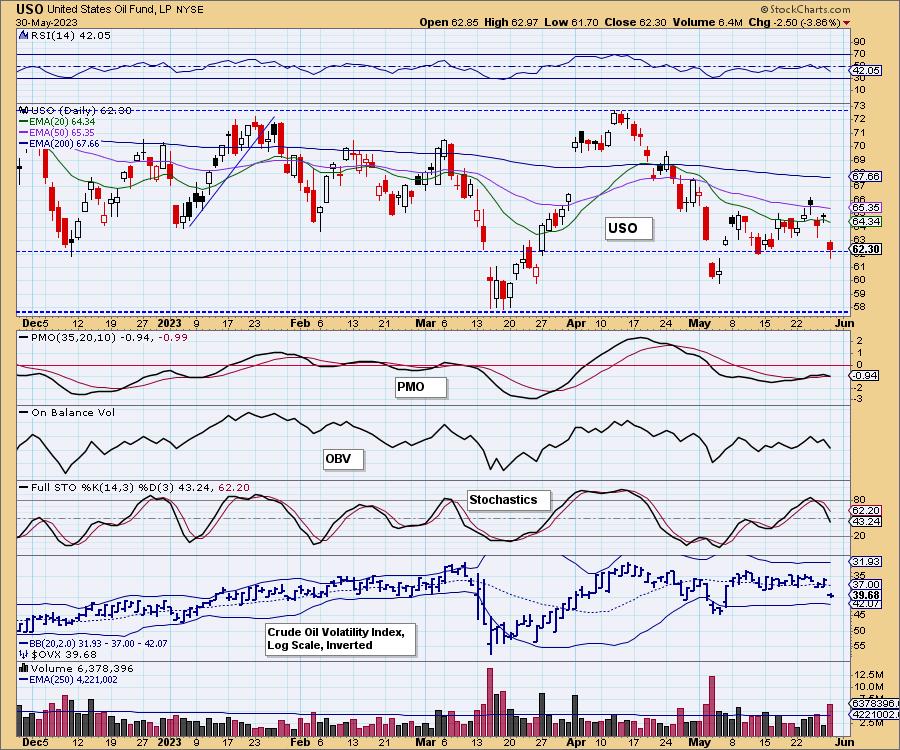
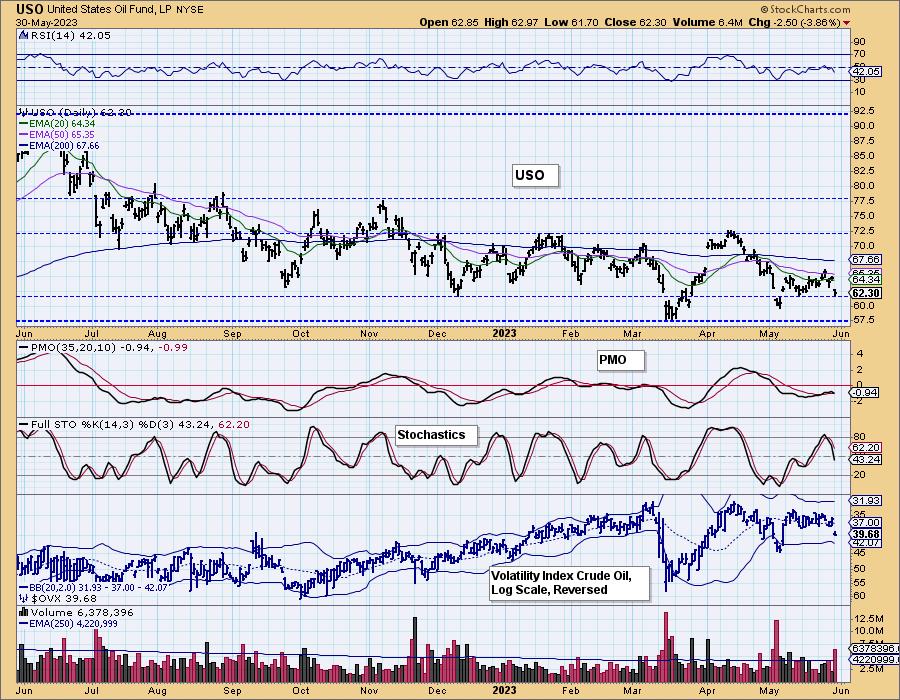
CRUDE OIL (USO)
IT Trend Model: SELL as of 5/3/2023
LT Trend Model: SELL as of 12/6/2022
USO Daily Chart: Crude Oil gapped down. This put the PMO very close to a Crossover SELL Signal. Support is now being tested and based on the quick turnaround on all of the indicators, it appears we will see more decline, likely to the 60.00 level. If it doesn't reverse, we will see a top well below the top of the trading range and that would imply a possible breakdown on the next test at 58.00. This looks very much like a breakaway gap to the downside.
Good Luck & Good Trading!
Erin Swenlin and Carl Swenlin
Technical Analysis is a windsock, not a crystal ball. --Carl Swenlin
(c) Copyright 2023 DecisionPoint.com
Disclaimer: This blog is for educational purposes only and should not be construed as financial advice. The ideas and strategies should never be used without first assessing your own personal and financial situation, or without consulting a financial professional. Any opinions expressed herein are solely those of the author, and do not in any way represent the views or opinions of any other person or entity.
NOTE: The signal status reported herein is based upon mechanical trading model signals, specifically, the DecisionPoint Trend Model. They define the implied bias of the price index based upon moving average relationships, but they do not necessarily call for a specific action. They are information flags that should prompt chart review. Further, they do not call for continuous buying or selling during the life of the signal. For example, a BUY signal will probably (but not necessarily) return the best results if action is taken soon after the signal is generated. Additional opportunities for buying may be found as price zigzags higher, but the trader must look for optimum entry points. Conversely, exit points to preserve gains (or minimize losses) may be evident before the model mechanically closes the signal.
Helpful DecisionPoint Links:
DecisionPoint Alert Chart List
DecisionPoint Golden Cross/Silver Cross Index Chart List
DecisionPoint Sector Chart List
Price Momentum Oscillator (PMO)
Swenlin Trading Oscillators (STO-B and STO-V)
DecisionPoint is not a registered investment advisor. Investment and trading decisions are solely your responsibility. DecisionPoint newsletters, blogs or website materials should NOT be interpreted as a recommendation or solicitation to buy or sell any security or to take any specific action.