
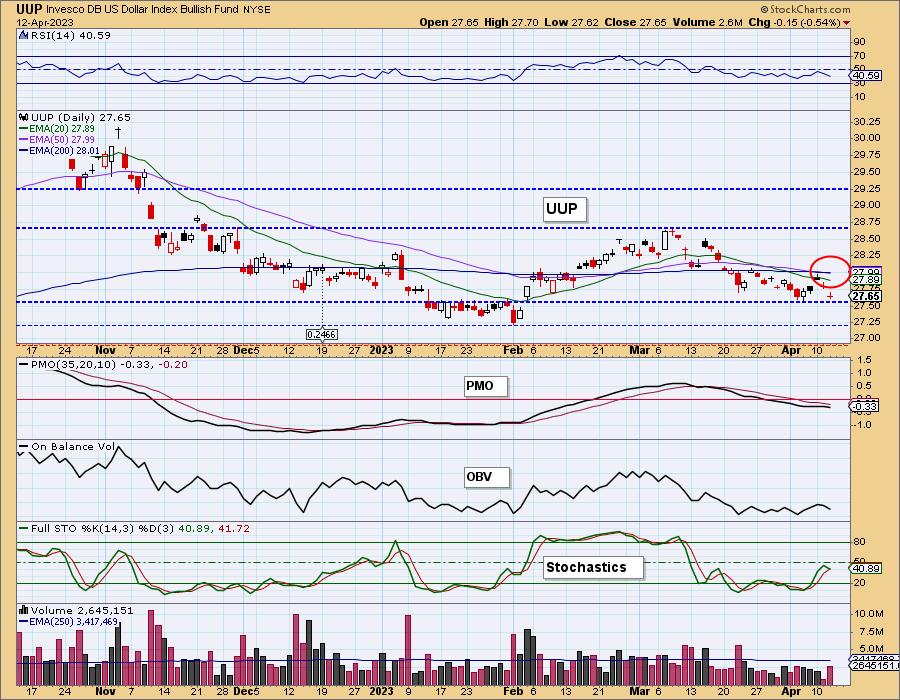
Today the U.S. Dollar ETF (UUP) 50-day EMA crossed down through the 200-day EMA (Death Cross), generating an LT Trend Model SELL Signal. Once again, we're seeing price in a narrow trading range, resulting in three, yes three, 50/200-day EMA crossovers in less than three months. The outlook is bearish, but just barely.
The DecisionPoint Alert Weekly Wrap presents an end-of-week assessment of the trend and condition of the Stock Market, the U.S. Dollar, Gold, Crude Oil, and Bonds. The DecisionPoint Alert daily report (Monday through Thursday) is abbreviated and gives updates on the Weekly Wrap assessments.
Watch the latest episode of DecisionPoint on StockCharts TV's YouTube channel here!
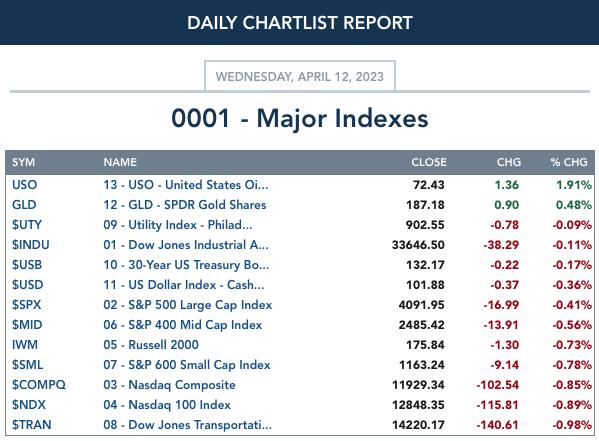
MAJOR MARKET INDEXES
SECTORS
Each S&P 500 Index component stock is assigned to one of 11 major sectors. This is a snapshot of the Intermediate-Term (Silver Cross) and Long-Term (Golden Cross) Trend Model signal status for those sectors.
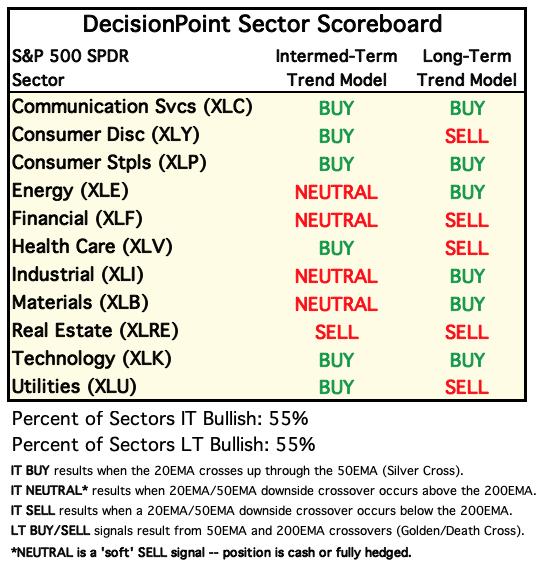
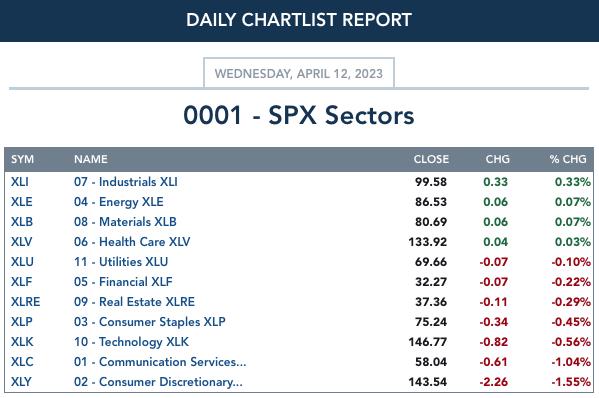
CLICK HERE for Carl's annotated Sector charts.
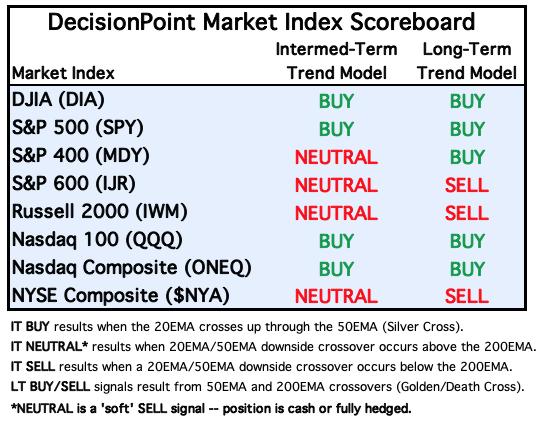
THE MARKET (S&P 500)
IT Trend Model: BUY as of 3/30/2023
LT Trend Model: BUY as of 3/29/2023
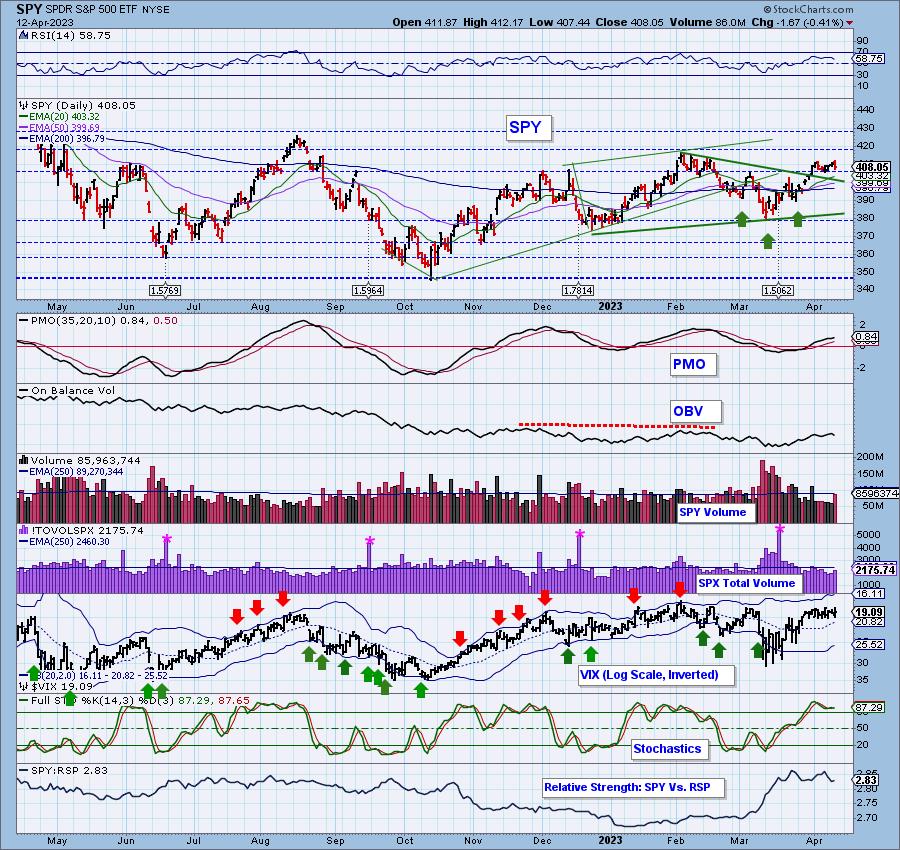
SPY Daily Chart: Today saw a big bearish engulfing candlestick suggesting this isn't the end of this decline. Indicators haven't broken down yet so the bullish bias of the bull market is still intact, for now.
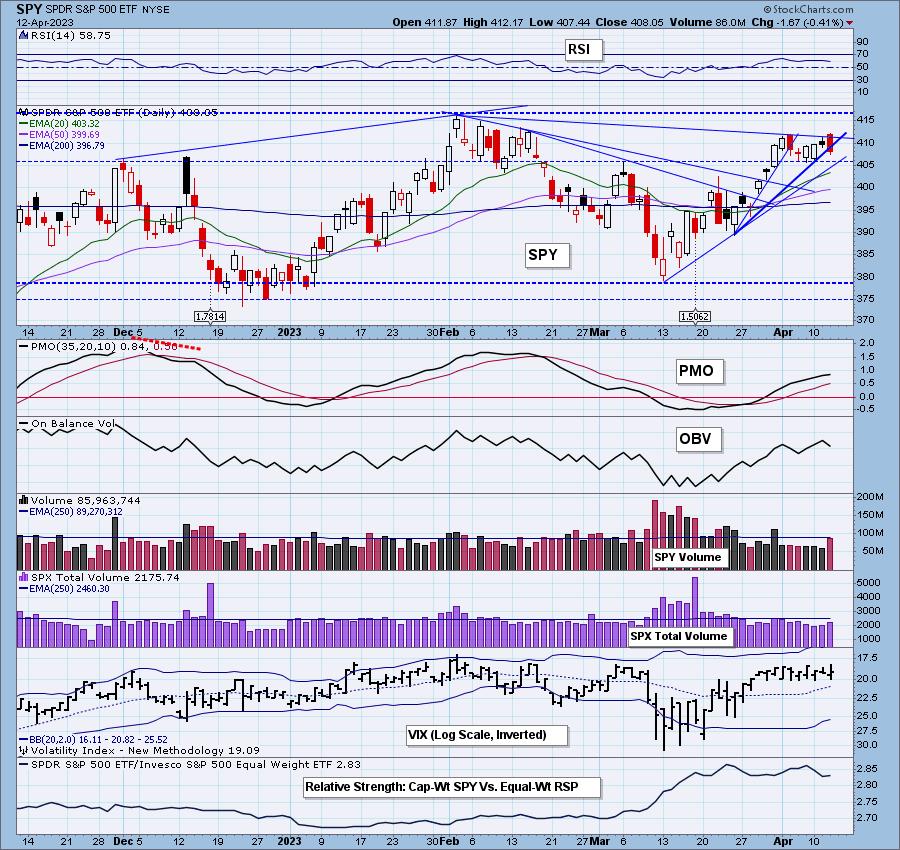
We are still seeing a possible bull flag out of the second March low and the bullish reverse head and shoulders is still resolving to the upside. Stochastics are oscillating safely above 80 and the VIX still isn't showing signs of distress as it oscillates above its moving average on the inverted scale. Internal strength is still available.

Here is the latest recording:
S&P 500 New 52-Week Highs/Lows: New Highs expanded on today's decline, but we must remember this is an intraday reading so some of those New Highs may've been lost after the decline so we won't read too much into it. The 10-DMA of the High-Low Differential is rising which is bullish; however, it is getting close to near-term overbought territory.
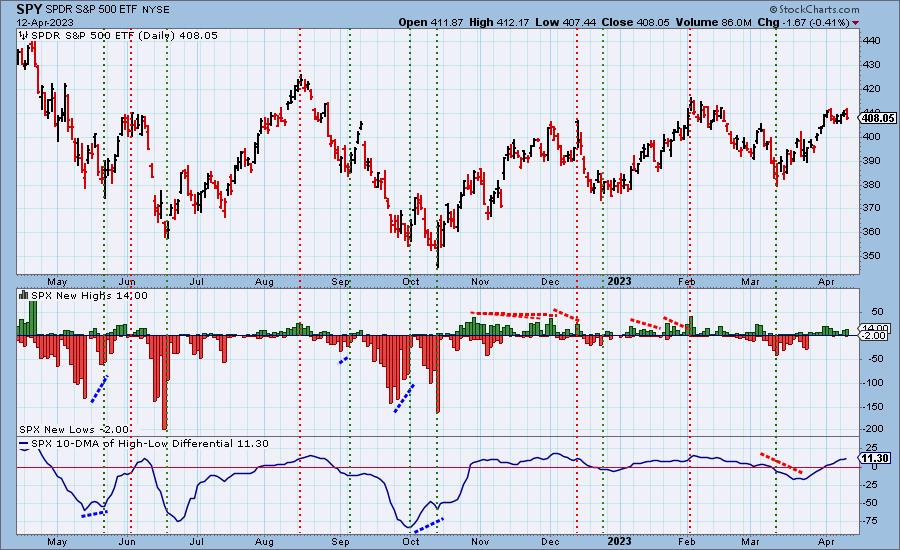
Climax* Analysis: Only two of the four applicable indicators had climax readings today, and SPX Total Volume wasn't particularly impressive. Last week we had a downside initiation climax, that didn't result in any downside follow through. Today price exceeded the high of that last climax day, so we think the system gets reset. While we don't think today meets climax day criteria, it might be useful to think of it as a potential downside initiation climax -- we might see some downside follow through. Yesterday's possible upside exhaustion climax did go along with today's action so caution is advised.
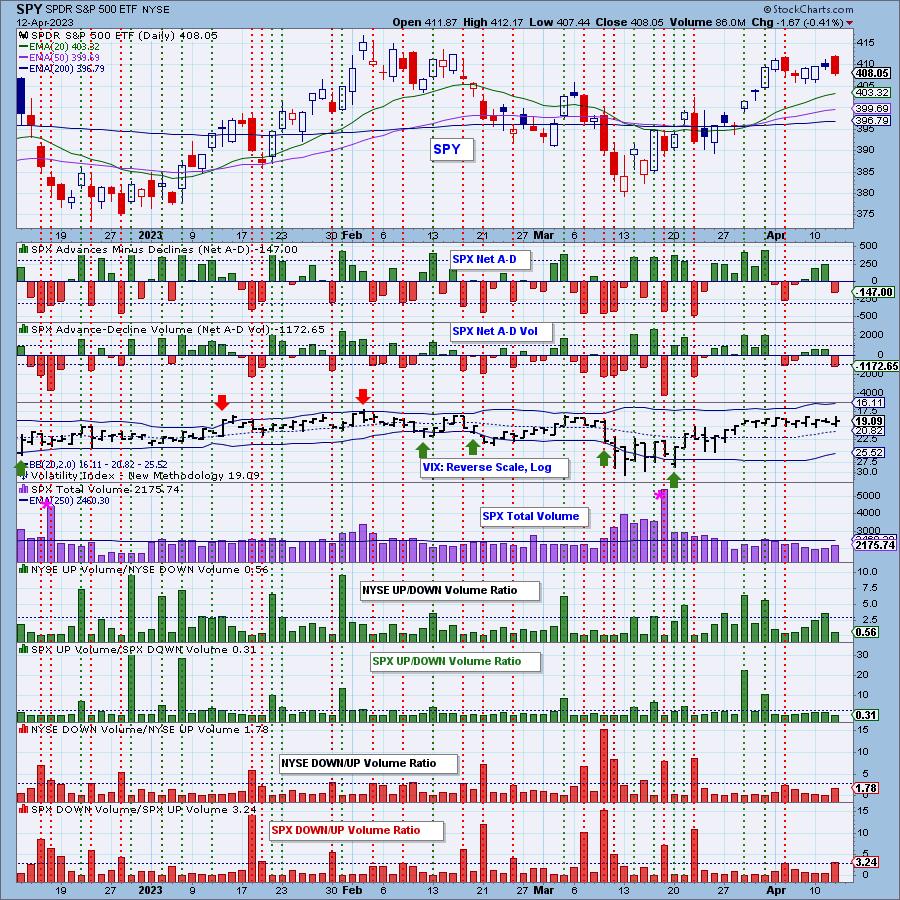
*A climax is a one-day event when market action generates very high readings in, primarily, breadth and volume indicators. We also include the VIX, watching for it to penetrate outside the Bollinger Band envelope. The vertical dotted lines mark climax days -- red for downside climaxes, and green for upside. Climaxes are at their core exhaustion events; however, at price pivots they may be initiating a change of trend.
Short-Term Market Indicators: The short-term market trend is UP and the condition is NEUTRAL.
The STO-B rose again today, but the STO-V is not on board yet. We also noticed some negative divergences on our participation indicators.
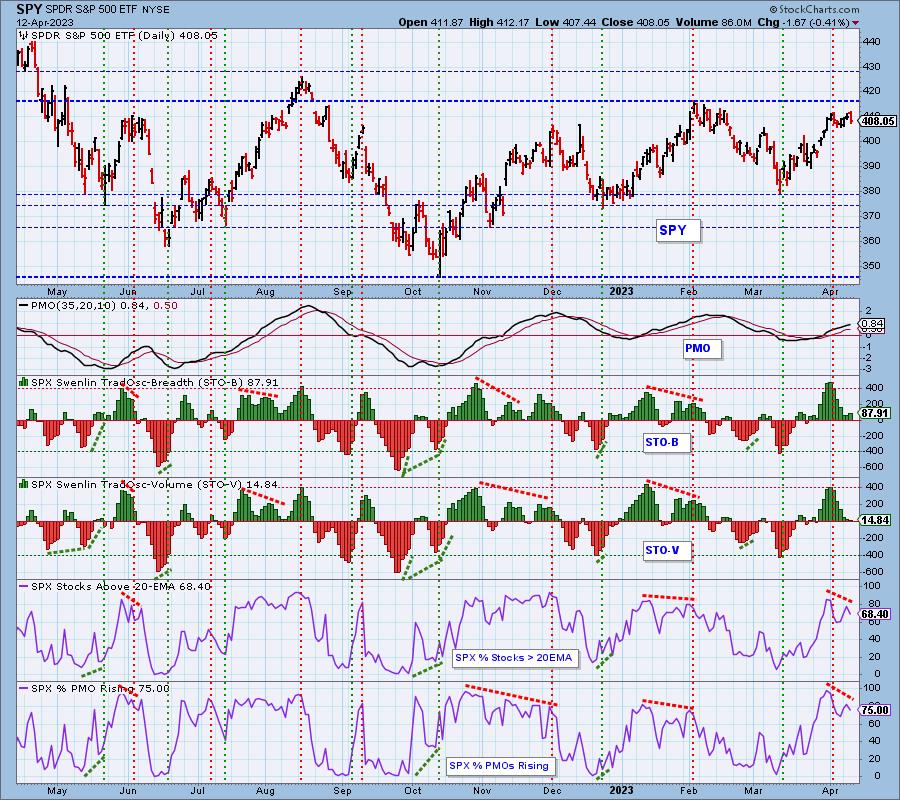
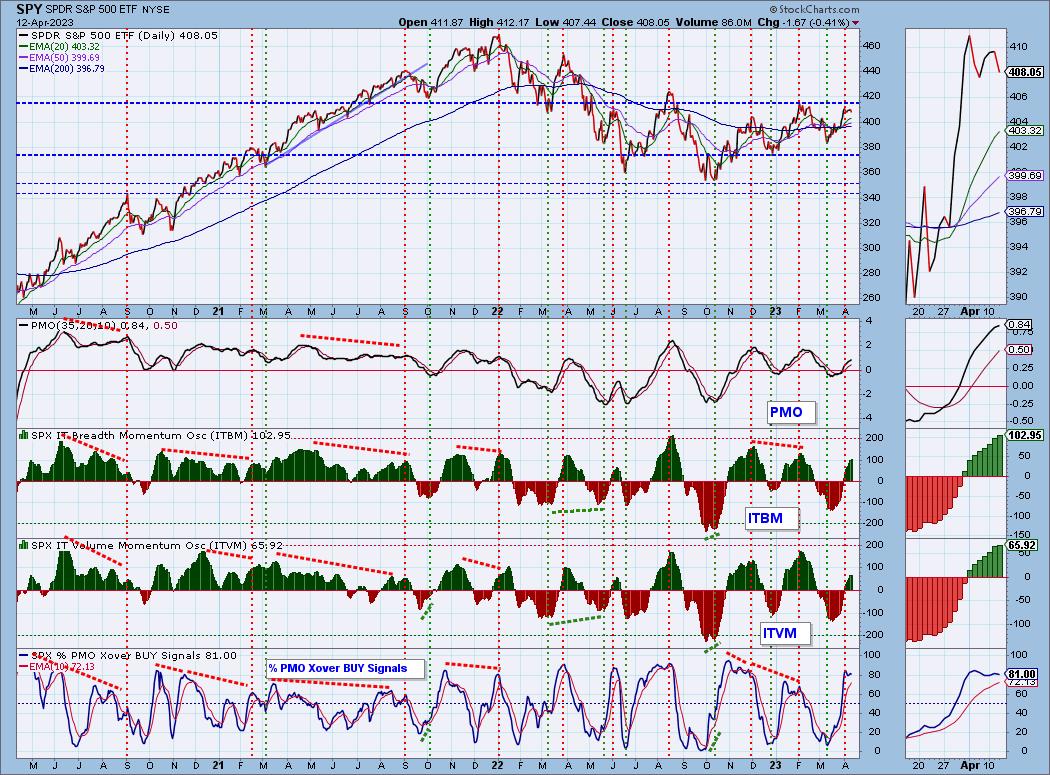
Intermediate-Term Market Indicators: The intermediate-term market trend is UP and the condition is OVERBOUGHT.
Both the ITBM and ITVM are overbought, but still rising. We did see %PMO BUY Signals tick lower which happened due to fewer PMOs Rising. If we don't see an expansion on rising PMOs, this indicator will continue lower out of overbought territory.
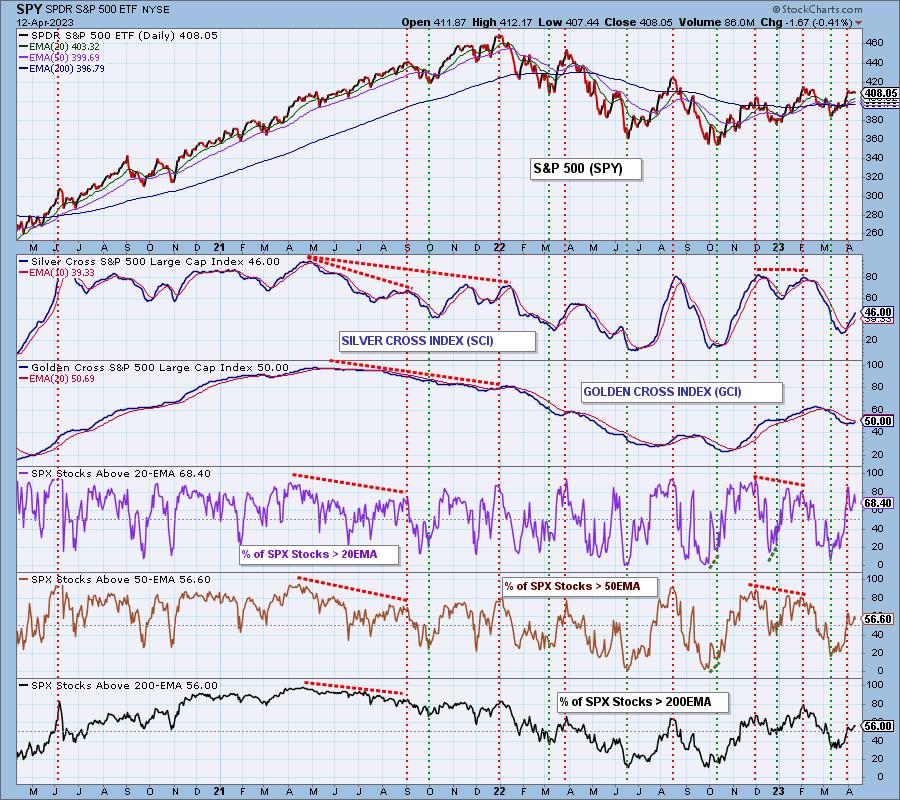
PARTICIPATION and BIAS Assessment: The following chart objectively shows the depth and trend of participation in two time frames.
- Intermediate-Term - the Silver Cross Index (SCI) shows the percentage of SPX stocks on IT Trend Model BUY signals (20-EMA > 50-EMA). The opposite of the Silver Cross is a "Dark Cross" -- those stocks are, at the very least, in a correction.
- Long-Term - the Golden Cross Index (GCI) shows the percentage of SPX stocks on LT Trend Model BUY signals (50-EMA > 200-EMA). The opposite of a Golden Cross is the "Death Cross" -- those stocks are in a bear market.
The market bias is BULLISH in all three timeframes:
The bias remains bullish. We have over 50% of stocks above their 20/50/200-day EMAs. Those percentages are all greater than the Silver Cross Index and Golden Cross Index percentages which implies they will likely continue moving higher.
CONCLUSION: We see a few cracks in the foundation today. There are a few negative divergences and the STO-V is still in decline. We also lost rising PMOs. On the other hand, all other indicators are rising and internal strength is still visible. We are likely in for a pullback to support at 405.00. This could certainly turn into a more sticky decline so caution is now warranted. Tightening stops on positions that are more vulnerable to a market decline or adding a small hedge couldn't hurt. Erin presented a possible hedge today in DP Diamonds. She is considering adding to her current 2% hedge.
Erin is 26% long, 2% short.
Have you subscribed the DecisionPoint Diamonds yet? DP does the work for you by providing handpicked stocks/ETFs from exclusive DP scans! Add it with a discount! Contact support@decisionpoint.com for more information!
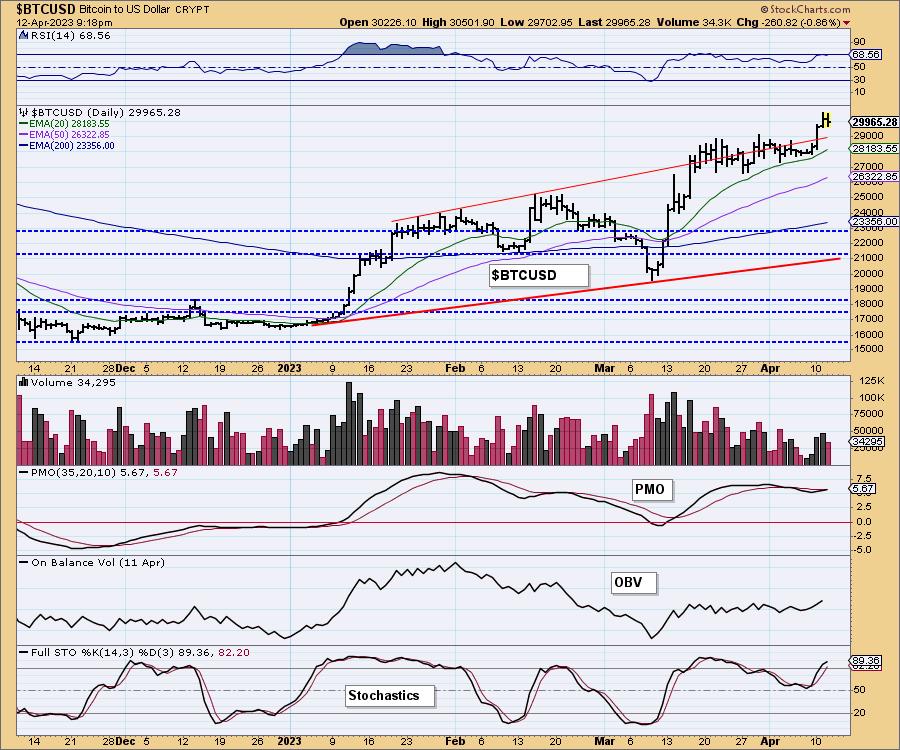
BITCOIN
Bitcoin paused today after an important breakout above overhead resistance. The PMO is about to trigger a Crossover BUY Signal. The RSI has moved out of overbought territory on today's decline which is good. Stochastics are rising above 80. The indicators favor a resumption of the current rally.
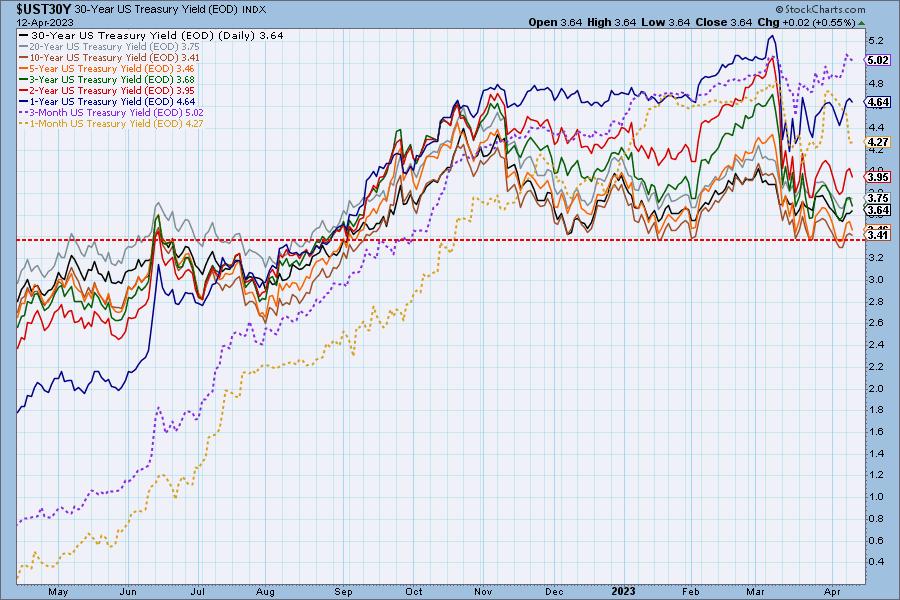
INTEREST RATES
Yields were mixed. Most have reached support zones so we expect them to rise.
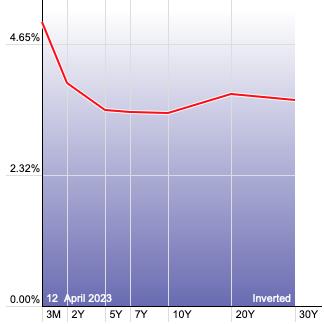
The Yield Curve Chart from StockCharts.com shows us the inversions taking place. The red line should move higher from left to right. Inversions are occurring where it moves downward.
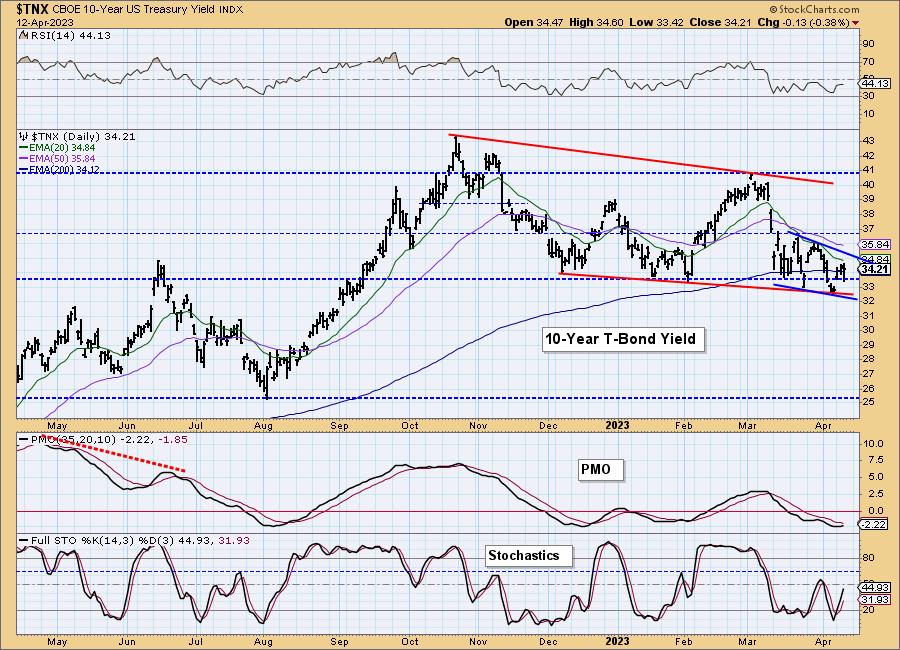
10-YEAR T-BOND YIELD
$TNX dropped slightly today, but are in a bullish falling wedge in the intermediate term and now in the short term. The PMO is turning back up in oversold territory. The RSI needs to improve, but Stochastics are rising almost vertically. We expect a breakout from the smaller wedge.
DOLLAR (UUP)
IT Trend Model: NEUTRAL as of 3/28/2023
LT Trend Model: SELL as of 4/12/2023
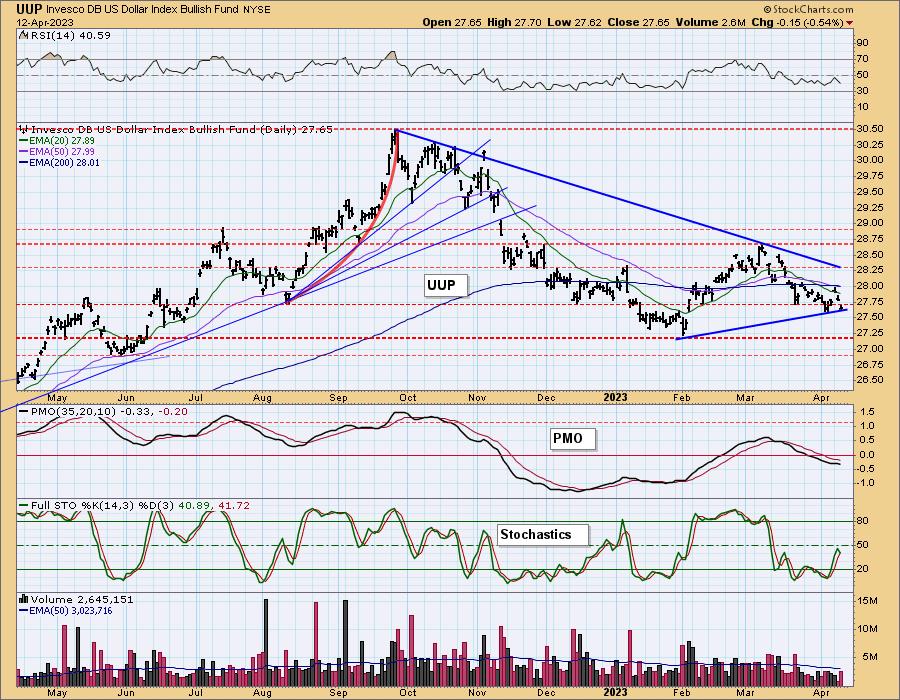
UUP Daily Chart: UUP saw a "death cross" of the 50/200-day EMAs as noted in the opening. The chart is bearish and favors a breakdown; however, support is very near at 27.25. The RSI and PMO are falling, but worse is Stochastics topping in negative territory below net neutral (50). Look for a breakdown here.
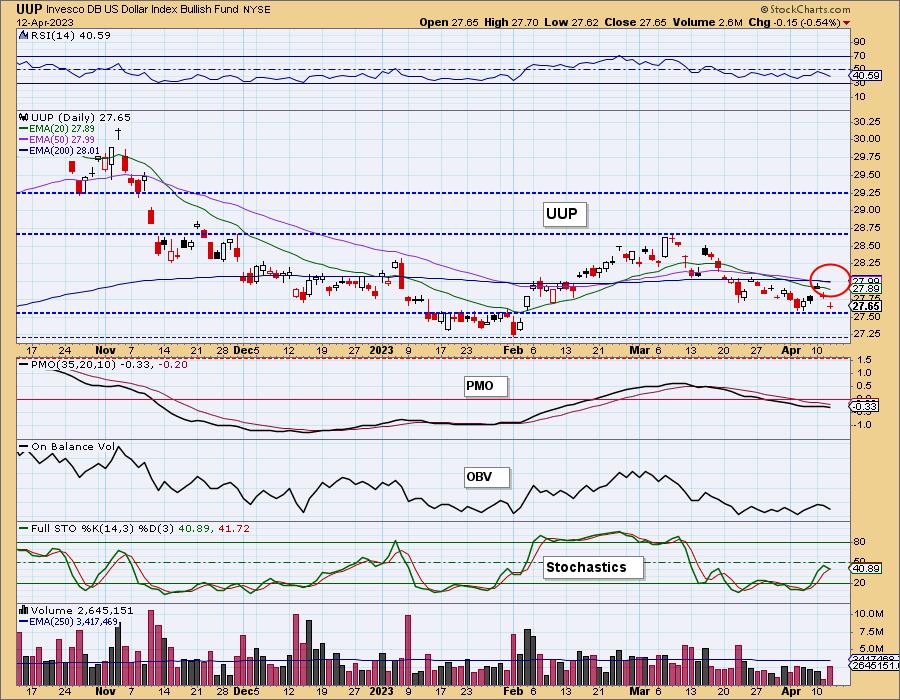
A breakdown would compromise the current rising trend, but support looks pretty sturdy at 27.25.
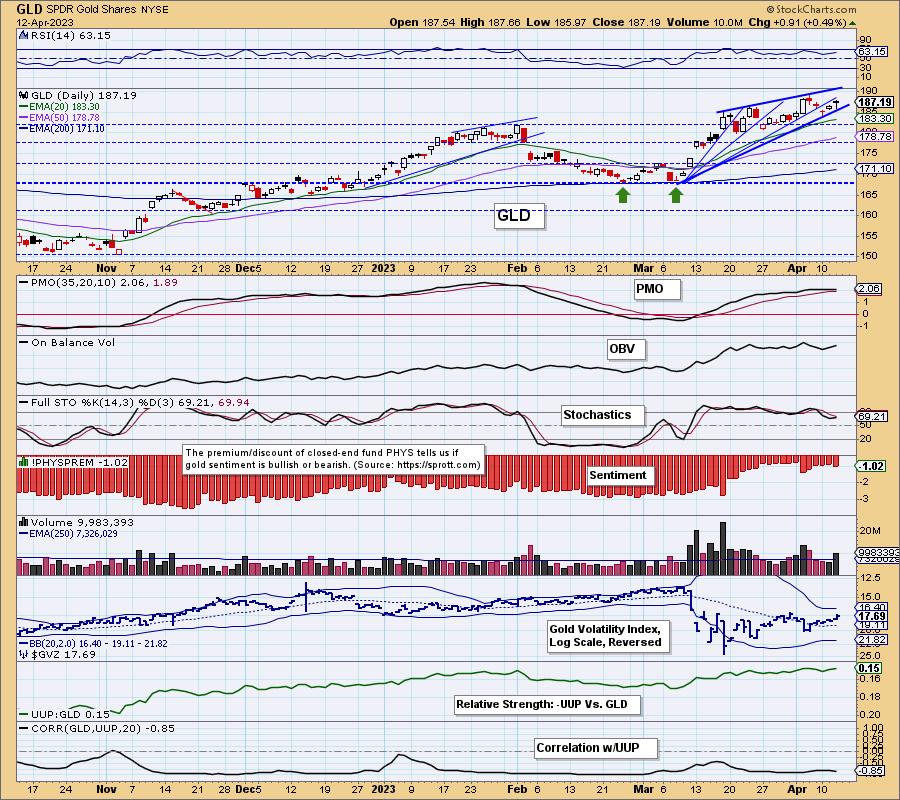
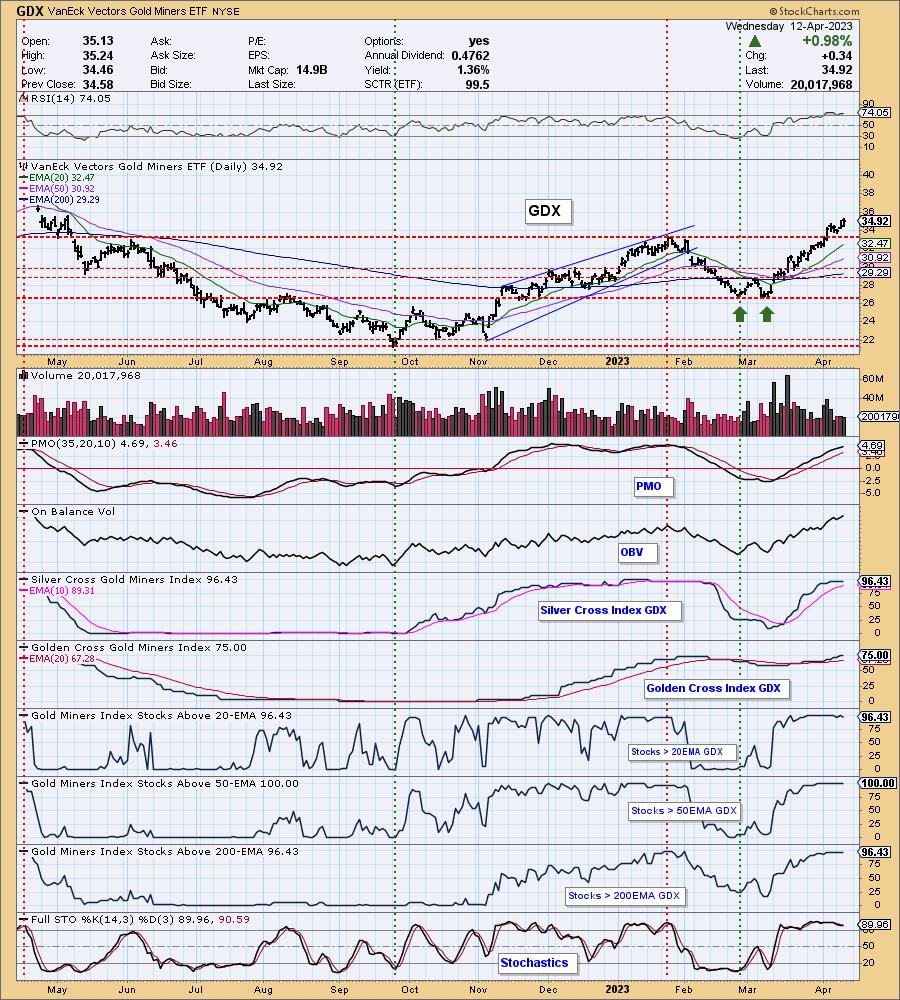
GOLD
IT Trend Model: BUY as of 3/7/2023
LT Trend Model: BUY as of 1/5/2023
GLD Daily Chart: The Dollar is weak and that will favor Gold as it did today. Indicators are mixed. The RSI is positive and Stochastics are rising again. The PMO is on a BUY signal, but flat and unresponsive as price moves within a bearish rising wedge.
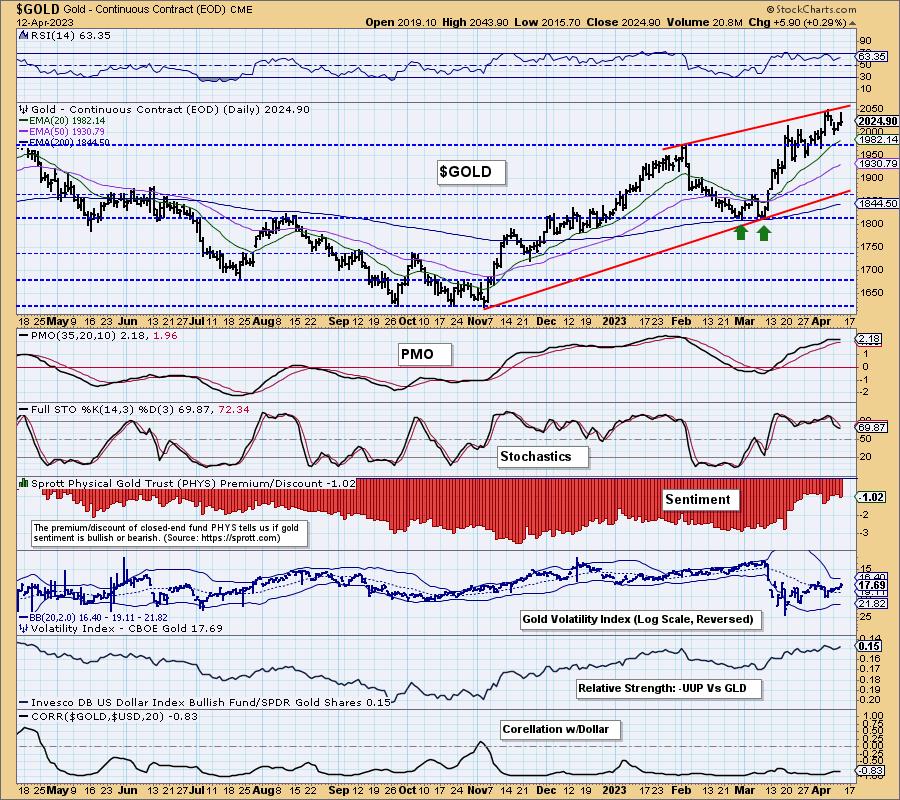
GOLD Daily Chart: Discounts are fairly low so Gold is finding favor again among investors. Not enough to see Premiums, but given the past, we don't want to see them. If sentiment moves too bullish, Gold will be vulnerable to decline. We do note a longer-term rising wedge that is very bearish as it would imply a drop to at least test the rising bottoms trendline that forms the bottom of the wedge. We don't favor that conclusion, but we do see Gold as vulnerable in the intermediate term.
GOLD MINERS Golden and Silver Cross Indexes: Gold Miners continue to impress. We did see a tiny drop from 100% in participation of stocks above their 20-day EMA, but a 96% reading is still extremely strong. We'd like to see a pause given the RSI is overbought. It would also offer latecomers a better entry.
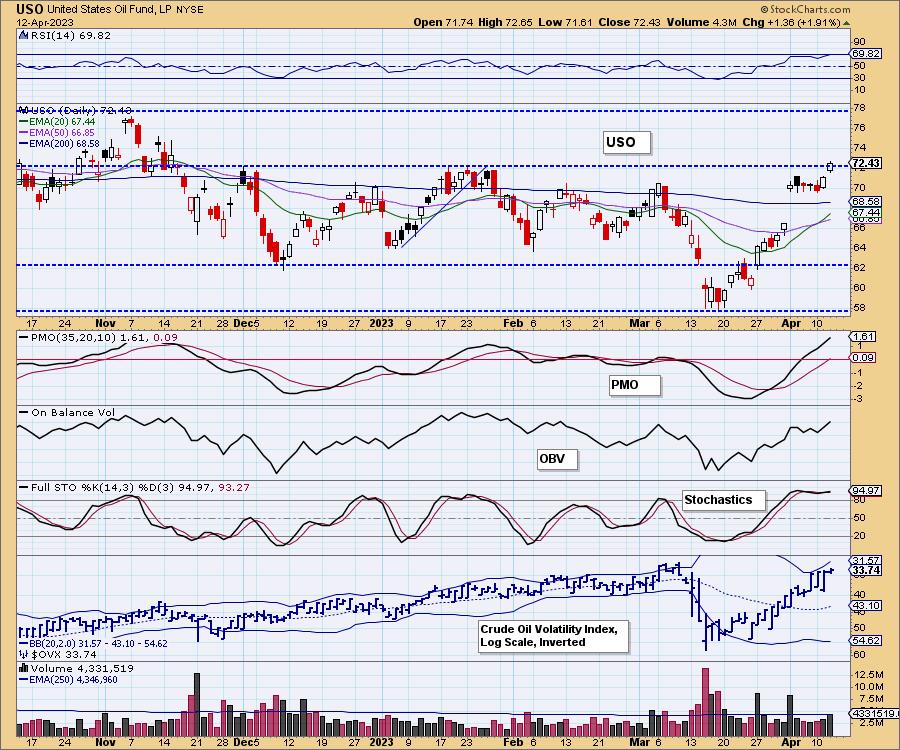
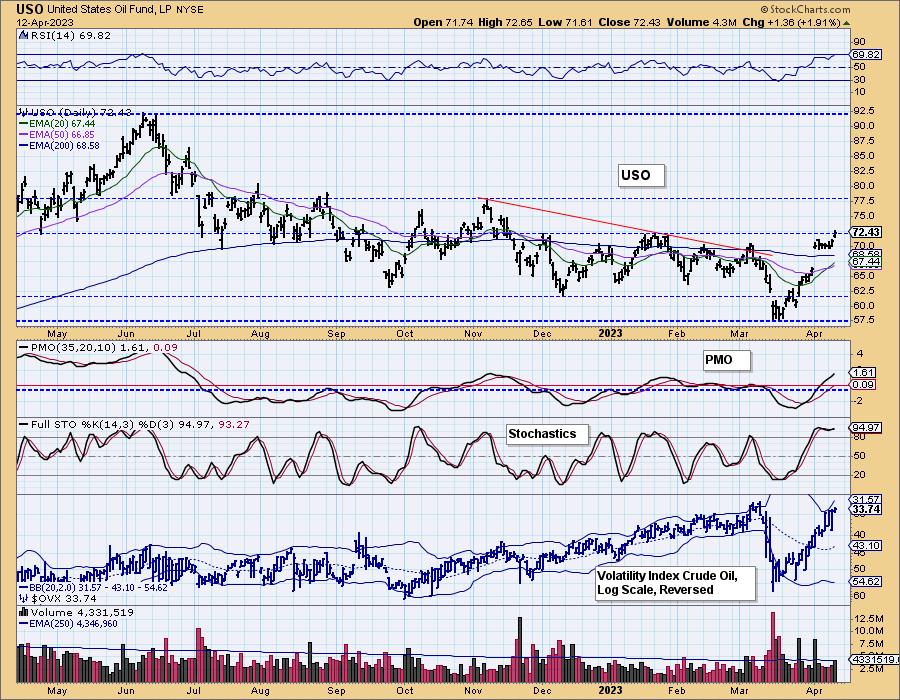
CRUDE OIL (USO)
IT Trend Model: BUY as of 4/10/2023
LT Trend Model: SELL as of 12/6/2022
USO Daily Chart: Crude Oil finally saw a continuation gap. We were beginning to question the breakaway gap and worry about an island reversal, but that is somewhat off the table. We could still see a reverse island off today's gap up. Price broke above overhead resistance and indicators are very favorable, so we think your Energy positions are likely safe for now. More resistance arrives at 78.00.
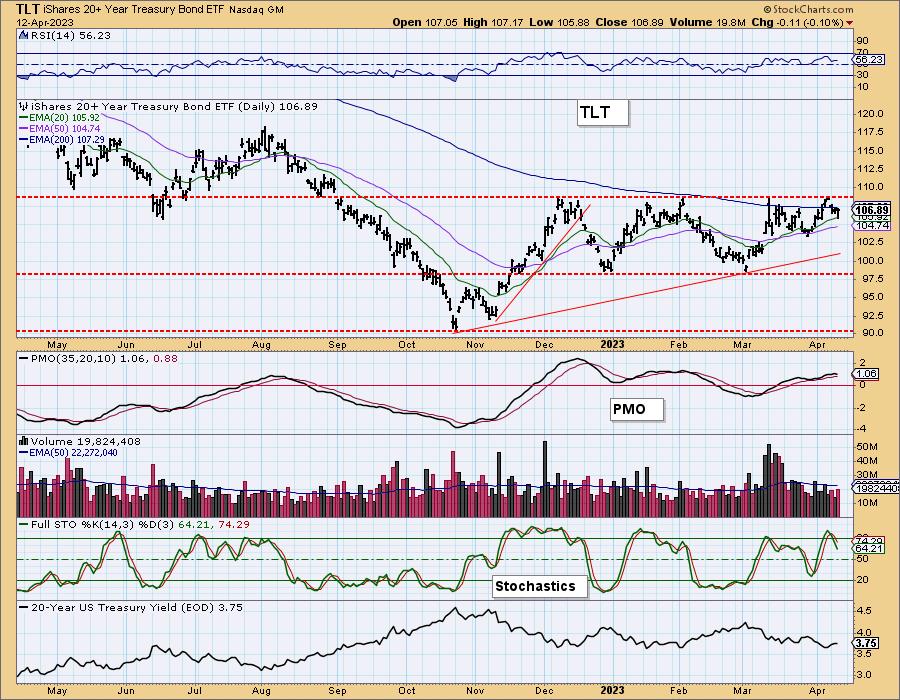
BONDS (TLT)
IT Trend Model: BUY as of 3/17/2023
LT Trend Model: SELL as of 1/19/2022
TLT Daily Chart: The 10-year yield ($TNX) fell, but the 20-year yield moved slightly higher which caused TLT to lose ground today. The RSI is flat, but still in positive territory. The problem is the PMO has topped. The short-term rising trend is about to be tested and given Stochastics falling, we don't expect it to hold.
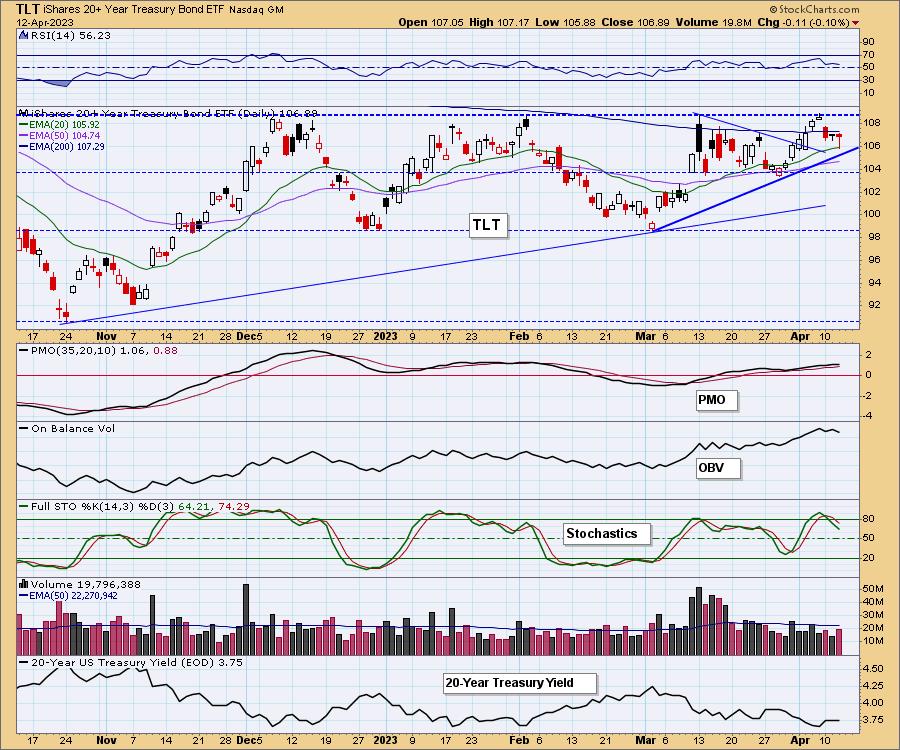
We have a trading zone and price is at the top of it. A decline here seems likely given it is declining off the top of the range.
Good Luck & Good Trading!
Erin Swenlin and Carl Swenlin
Technical Analysis is a windsock, not a crystal ball. --Carl Swenlin
(c) Copyright 2023 DecisionPoint.com
Disclaimer: This blog is for educational purposes only and should not be construed as financial advice. The ideas and strategies should never be used without first assessing your own personal and financial situation, or without consulting a financial professional. Any opinions expressed herein are solely those of the author, and do not in any way represent the views or opinions of any other person or entity.
NOTE: The signal status reported herein is based upon mechanical trading model signals, specifically, the DecisionPoint Trend Model. They define the implied bias of the price index based upon moving average relationships, but they do not necessarily call for a specific action. They are information flags that should prompt chart review. Further, they do not call for continuous buying or selling during the life of the signal. For example, a BUY signal will probably (but not necessarily) return the best results if action is taken soon after the signal is generated. Additional opportunities for buying may be found as price zigzags higher, but the trader must look for optimum entry points. Conversely, exit points to preserve gains (or minimize losses) may be evident before the model mechanically closes the signal.
Helpful DecisionPoint Links:
DecisionPoint Alert Chart List
DecisionPoint Golden Cross/Silver Cross Index Chart List
DecisionPoint Sector Chart List
Price Momentum Oscillator (PMO)
Swenlin Trading Oscillators (STO-B and STO-V)
DecisionPoint is not a registered investment advisor. Investment and trading decisions are solely your responsibility. DecisionPoint newsletters, blogs or website materials should NOT be interpreted as a recommendation or solicitation to buy or sell any security or to take any specific action.