Attention: your browser does not have JavaScript enabled!

For full functionality of this site it is necessary to enable JavaScript.
Click Here to learn how to enable JavaScript.

decision point logo
  • Home
  • About Us
  • Subscriptions
  • Blogs and Links
New around here? Subscribe now! Forgot password?

Manage Account

  • HOME
  • ABOUT US
  • SUBSCRIPTIONS
  • BLOGS AND LINKS

2022 Q3 Earnings: Market Still Overvalued

Published on January 05, 2023 at 01:23 PM by Carl Swenlin

DecisionPoint Alert

Preliminary earnings numbers are in for 2022 Q3. To clarify, earnings results are collected for the three months after the end of the quarter. Meanwhile, "earnings season," the collection period for 2022 Q4, has just begun.

The chart below shows the normal value range of the S&P 500 index ($SPX), indicating where $SPX would have to be to have an overvalued price/earnings (P/E) of 20 (red line), a fairly valued P/E of 15 (blue line), or an undervalued P/E of 10 (green line). Annotations on the right side of the chart show where the range is projected to be based on earnings estimates through 2023 Q3.


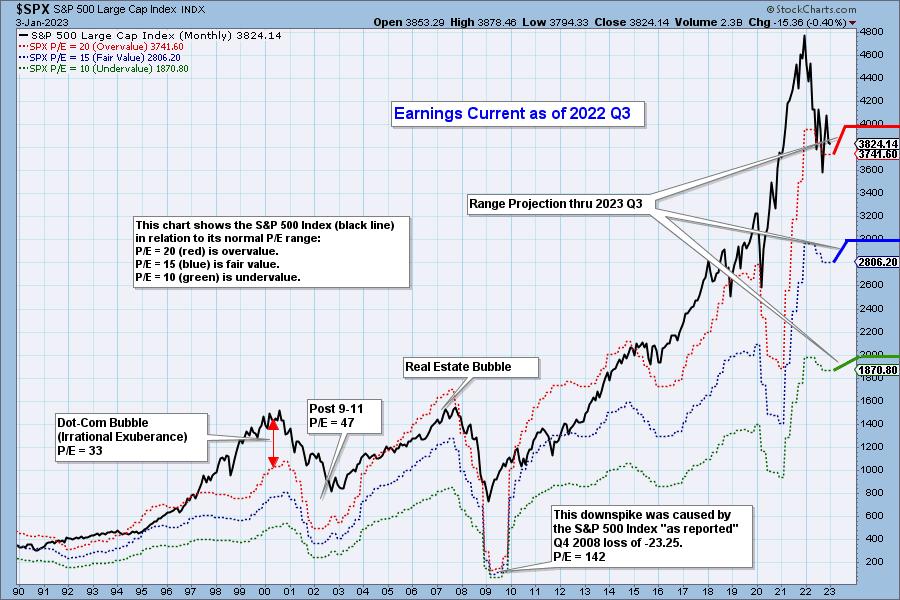
Historically, price has usually remained below the top of the normal value range (red line). However, since about 1998, it has not been uncommon for price to exceed normal overvalued levels, sometimes by a lot. The market has been mostly overvalued since 1992, and it hasn't been undervalued since 1984. You could say that this is the "new normal," except that it isn't normal by Generally Accepted Accounting Principles (GAAP) standards.

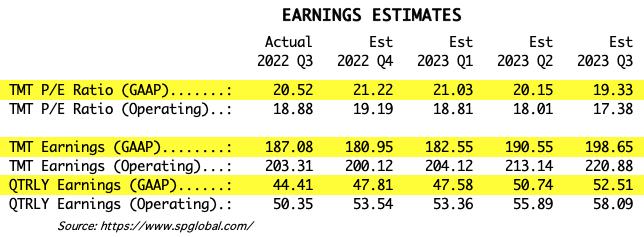
The table below shows earnings projections through September 2023, using GAAP earnings as the basis for the analysis. Keep in mind that the P/E estimates are calculated based on the $SPX close as of December 30, 2022. Keep in mind, the numbers will change daily depending on where the market goes from here. It is notable that the P/E is again outside the normal range.

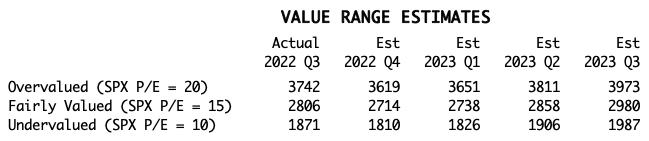
The following table shows where the bands are projected to be based on earnings estimates through 2023 Q3.

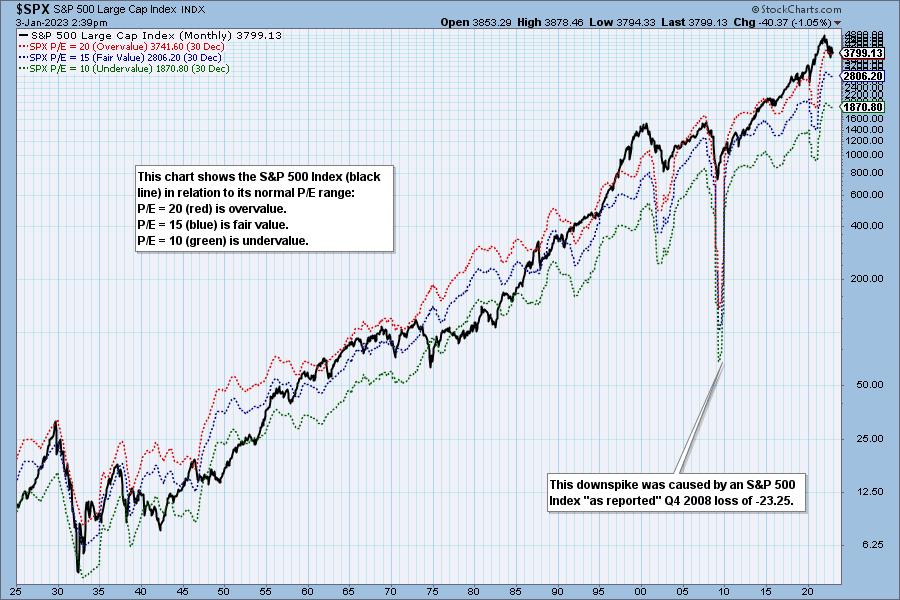
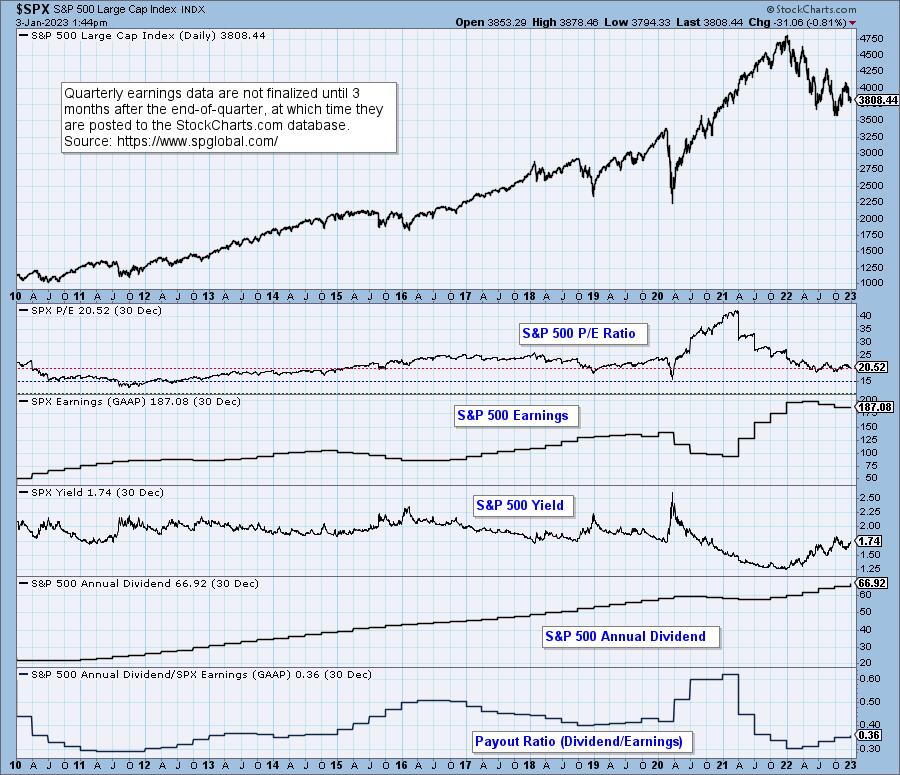
This DecisionPoint chart keeps track of S&P 500 fundamentals, P/E, and yield. It's updated daily—not that you need to watch it that closely, but it is up-to-date when you need it.

The Takeaway

The market is still overvalued and slightly above the normal range. As the bear market progresses, I expect actual earnings will fall short of estimates, and that prices will continue to fall. I would like to see the S&P 500 get back to the undervalued level, which I'm sure will happen when pigs fly. Falling prices will help that happen, but falling earnings will cause the value range to move lower, making it harder to reach undervalued levels.


Watch the latest episode of DecisionPoint on StockCharts TV's YouTube channel here!


(c) Copyright 2023 DecisionPoint.com


Technical Analysis is a windsock, not a crystal ball.


Helpful DecisionPoint Links:

DecisionPoint Alert Chart List

DecisionPoint Golden Cross/Silver Cross Index Chart List

DecisionPoint Sector Chart List

DecisionPoint Chart Gallery

Trend Models

Price Momentum Oscillator (PMO)

On Balance Volume

Swenlin Trading Oscillators (STO-B and STO-V)

ITBM and ITVM

SCTR Ranking

Bear Market Rules

Blog Archive
Previous Article
Next Article

Contact Us

Email: support@decisionpoint.com

© Proudly created by Alamo City Marketing Solutions

Socialize With Us

DecisionPoint logo

DecisionPoint is not a registered investment advisor. Investment and trading decisions are solely your responsibility. None of the DecisionPoint newsletters or web site materials should be interpreted as a recommendation or solicitation to buy or sell any security or to take any specific action.

DecisionPoint does not represent or endorse the accuracy or reliability of any of the information, content, or advertisements contained on, distributed through, linked from, downloaded or otherwise accessed from any of the services contained on this web site or in our newsletters, nor the quality of any products, information or other materials displayed, purchased, or obtained by you as a result of an advertisement or any other information or offer in or in connection with the materials. You hereby acknowledge that any reliance upon any Materials shall be at your sole risk. It is your responsibility to verify from other sources, such as your broker, critical elements of a decision to act. DecisionPoint reserves the right, in its sole discretion and without any obligation, to make improvements/changes to, or to correct any error or omissions in any portion of the Materials.

THE SERVICE AND THE MATERIALS ARE PROVIDED BY DECISIONPOINT ON AN "AS IS" BASIS, AND DECISIONPOINT EXPRESSLY DISCLAIMS ANY AND ALL WARRANTIES, EXPRESS OR IMPLIED, INCLUDING WITHOUT LIMITATION WARRANTIES OF MERCHANTABILITY AND FITNESS FOR A PARTICULAR PURPOSE, WITH RESPECT TO THE SERVICE OR ANY MATERIALS AND PRODUCTS. IN NO EVENT SHALL DECISIONPOINT BE LIABLE FOR ANY DIRECT, INDIRECT, INCIDENTAL, PUNITIVE, OR CONSEQUENTIAL DAMAGES OF ANY KIND WHATSOEVER WITH RESPECT TO THE SERVICE, THE MATERIALS AND THE PRODUCTS.