
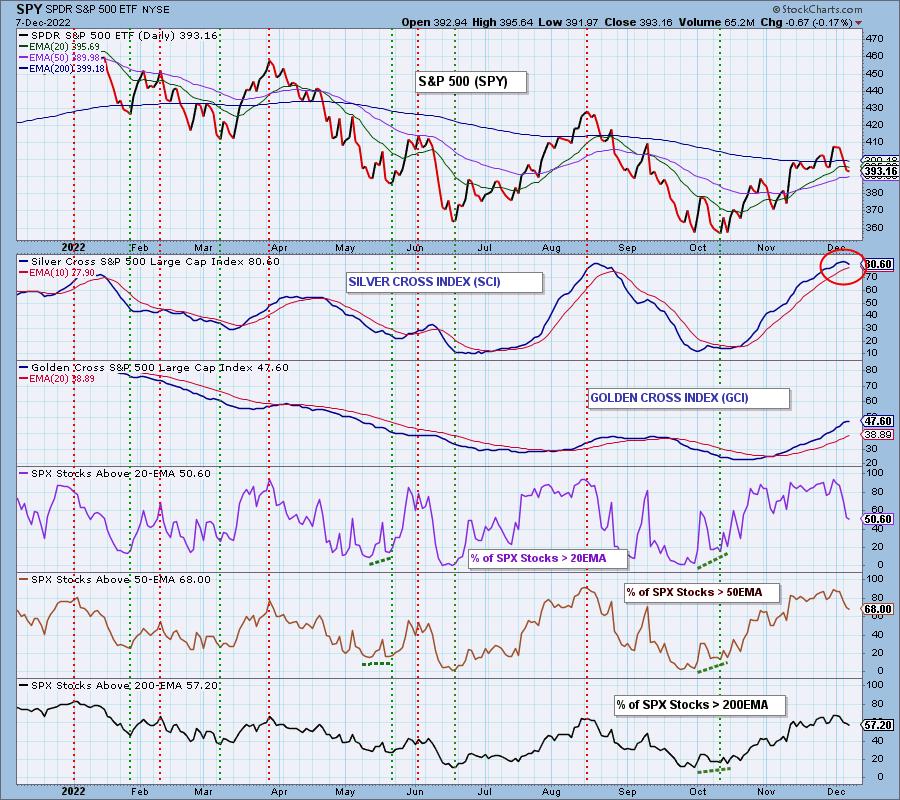
Today we noticed that the overbought Silver Cross Index (SCI) has rolled over, and the implication is bearish. To review, the SCI shows the percentage of stocks in a given index (the S&P 500 in this case) that the 20-day EMA has crossed up through the 50-day EMA (Silver Cross). Note that the SCI has reached the same level as it did in August, which is very overbought. We can also see that market participation has peaked, as shown by overbought tops on the Stocks Above Their 20/50/200EMA indicators. To add insult to injury, the Price Momentum Oscillator (PMO) had a negative crossover today, generating a PMO SELL Signal. We'll discuss that further down.
The DecisionPoint Alert Weekly Wrap presents an end-of-week assessment of the trend and condition of the Stock Market, the U.S. Dollar, Gold, Crude Oil, and Bonds. The DecisionPoint Alert daily report (Monday through Thursday) is abbreviated and gives updates on the Weekly Wrap assessments.
Watch the latest episode of DecisionPoint on StockCharts TV's YouTube channel here!
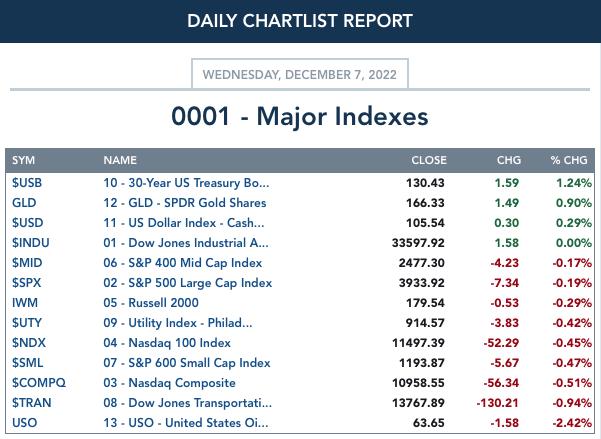
MAJOR MARKET INDEXES
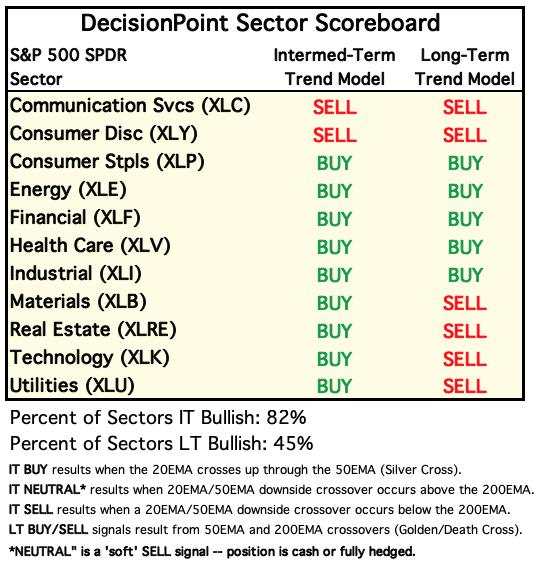
SECTORS
Each S&P 500 Index component stock is assigned to one of 11 major sectors. This is a snapshot of the Intermediate-Term (Silver Cross) and Long-Term (Golden Cross) Trend Model signal status for those sectors.
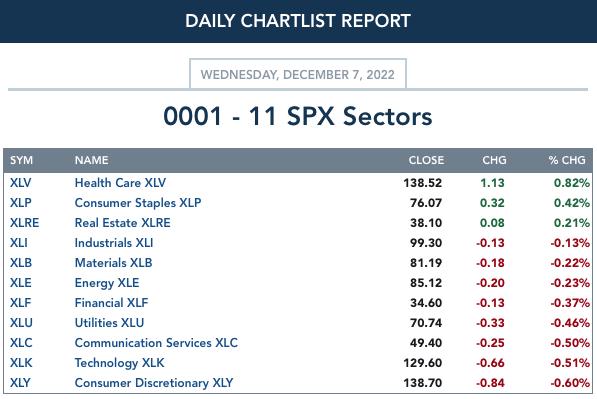
CLICK HERE for Carl's annotated Sector charts.
THE MARKET (S&P 500)
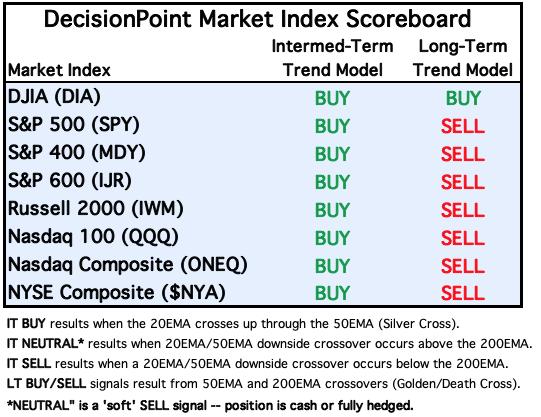
IT Trend Model: BUY as of 11/15/2022
LT Trend Model: SELL as of 5/5/2022
SPY Daily Chart: As noted in the opening, the PMO triggered a SELL signal today as it crossed down through its signal line. The market is currently holding support at $390, but we expect it to drop much further.
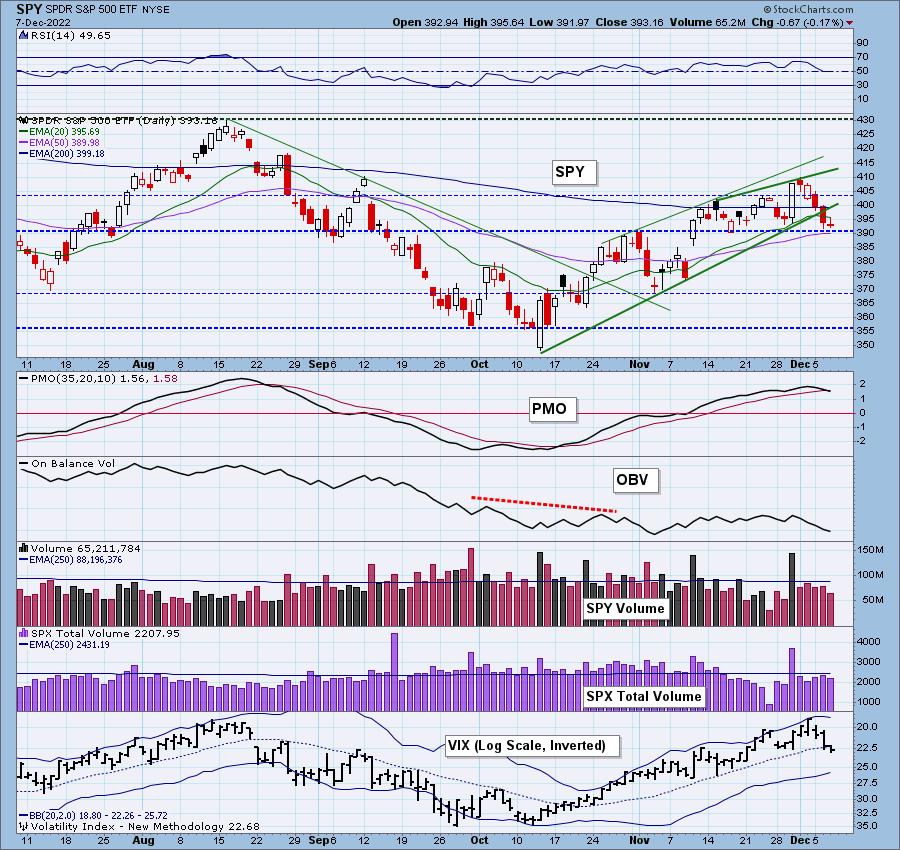
The VIX spent the day below its moving average on our inverted scale and that is a sign of internal weakness. The RSI just moved below 50 into negative territory and Stochastics are spiraling downward.

Here is the latest recording:
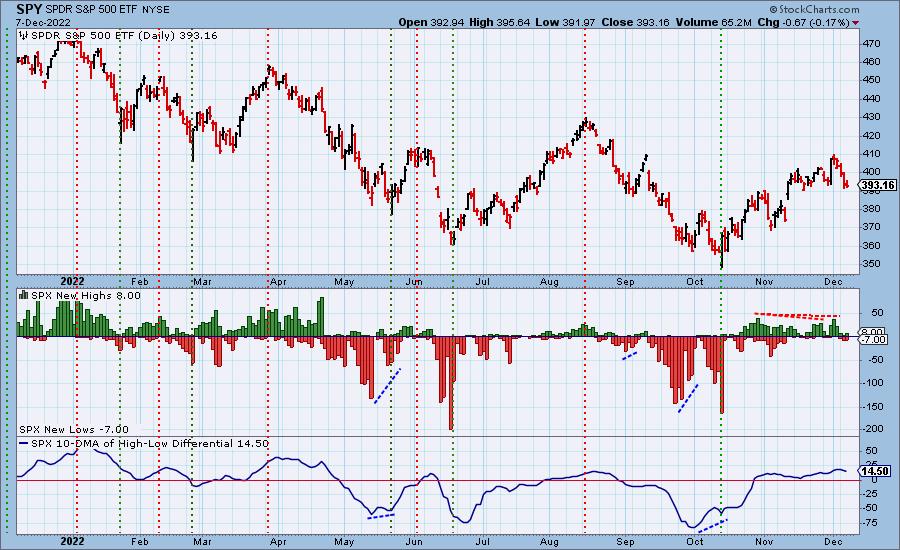
S&P 500 New 52-Week Highs/Lows: The negative divergence on New Highs is playing out right now with the current decline. The 10-DMA of the High-Low Differential topped this week and continues lower which is yet another sign of internal weakness.
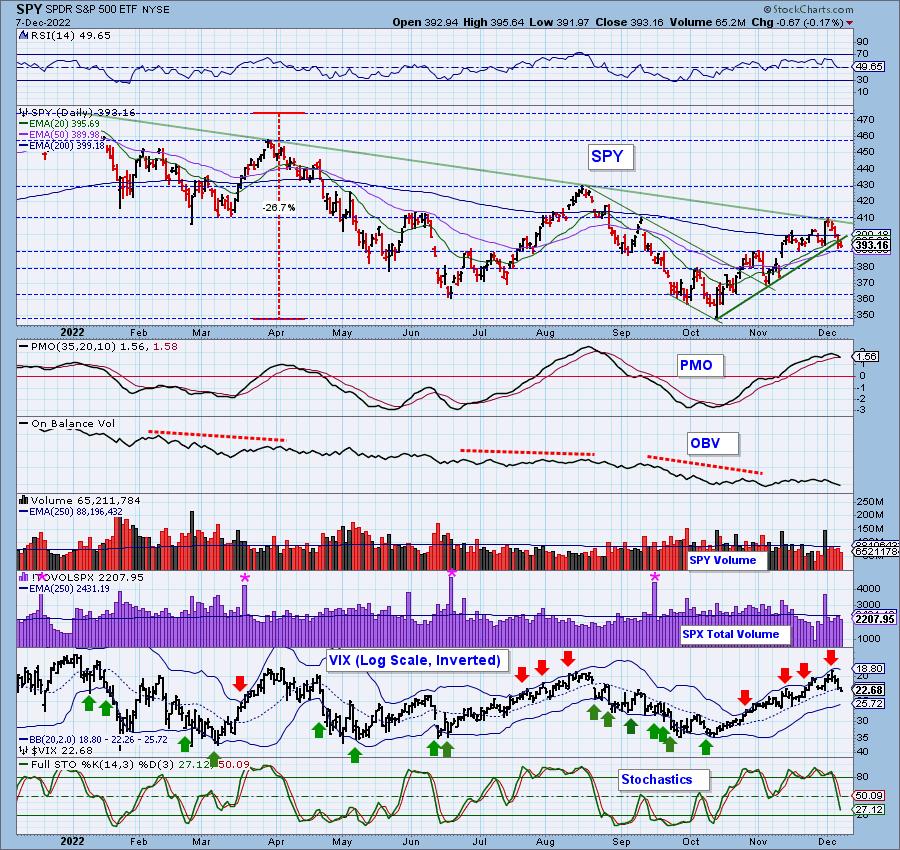
Climax* Analysis: There were no climax readings today.
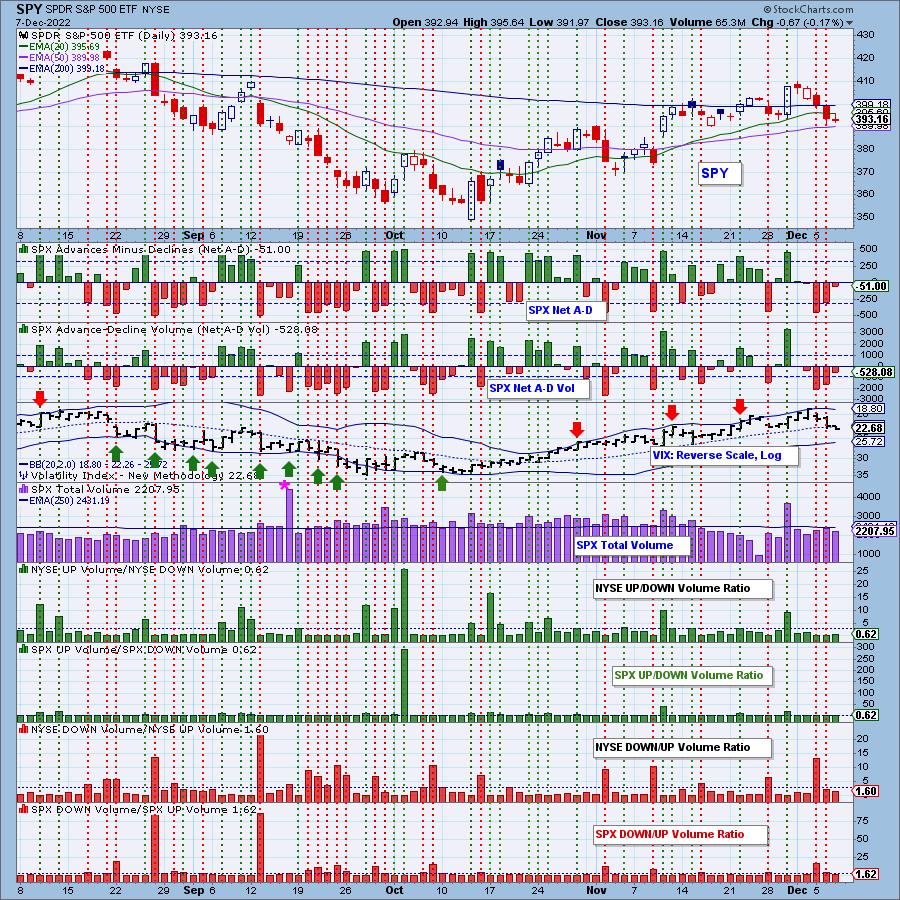
*A climax is a one-day event when market action generates very high readings in, primarily, breadth and volume indicators. We also include the VIX, watching for it to penetrate outside the Bollinger Band envelope. The vertical dotted lines mark climax days -- red for downside climaxes, and green for upside. Climaxes are at their core exhaustion events; however, at price pivots they may be initiating a change of trend.
Short-Term Market Indicators: The short-term market trend is DOWN and the condition is SOMEWHAT OVERSOLD.
STOs dove lower and are now in somewhat oversold territory. Rising momentum stayed the same, but more stocks did lose the 20-day EMA as support.
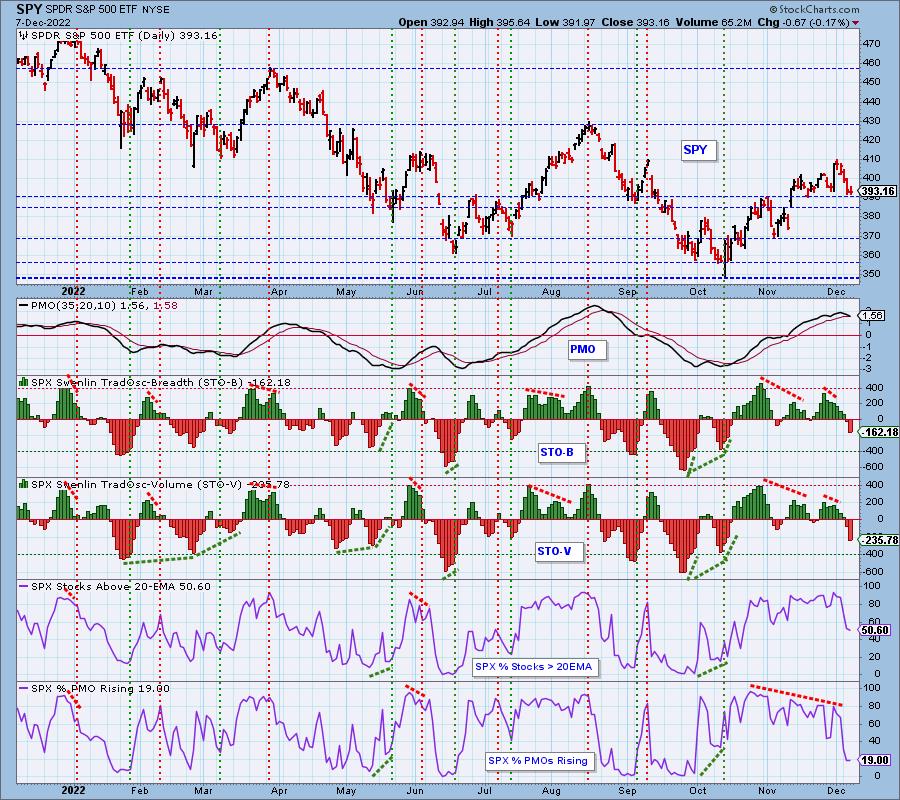
Intermediate-Term Market Indicators: The intermediate-term market trend is DOWN and the condition is OVERBOUGHT.
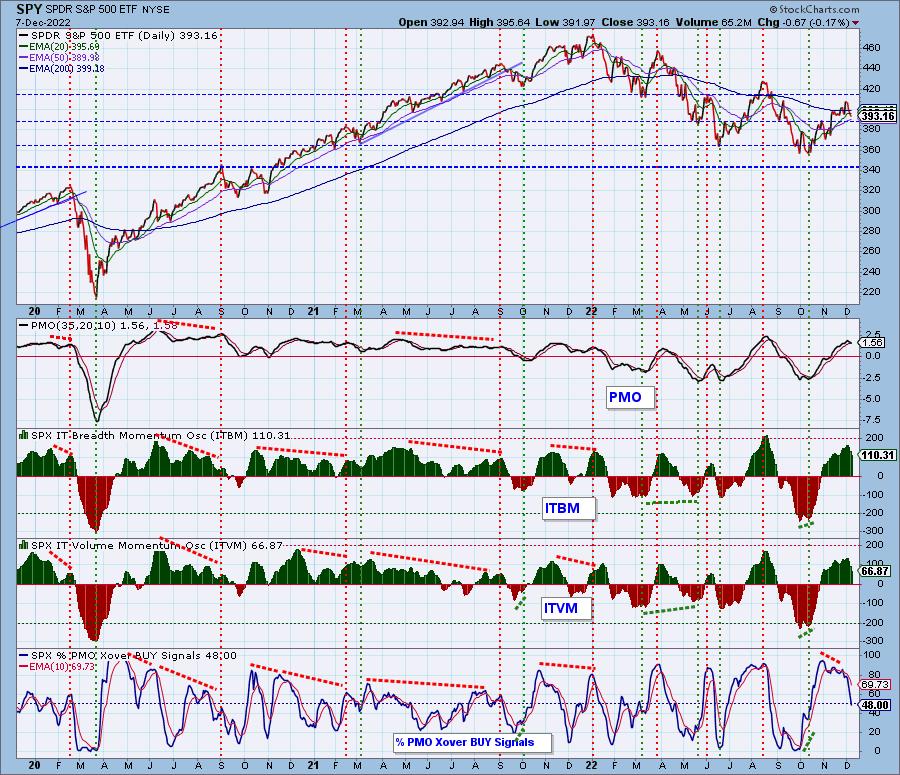
The ITBM/ITVM are both still overbought despite a sizable decline today. We now have less than half of the index on PMO BUY signals. With only 19% having rising PMOs, that indicator will be falling even lower.
PARTICIPATION and BIAS Assessment: The following chart objectively shows the depth and trend of participation in two time frames.
- Intermediate-Term - the Silver Cross Index (SCI) shows the percentage of SPX stocks on IT Trend Model BUY signals (20-EMA > 50-EMA). The opposite of the Silver Cross is a "Dark Cross" -- those stocks are, at the very least, in a correction.
- Long-Term - the Golden Cross Index (GCI) shows the percentage of SPX stocks on LT Trend Model BUY signals (50-EMA > 200-EMA). The opposite of a Golden Cross is the "Death Cross" -- those stocks are in a bear market.
The short-term bias is BEARISH. Participation of stocks above their 20/50-day EMAs is far less than those with "silver crosses".
The intermediate-term bias is BEARISH. The SCI has topped in overbought territory--a very dangerous condition.
The long-term bias is BULLISH, but deteriorating quickly. Given the GCI continues to rise and there are more stocks above their 50/200-day EMAs than those with "golden crosses". The GCI should continue to rise based on higher percentages above their 50/200-day EMAs, but we already note the GCI is pausing. Do not think that because the bias is listed as bullish in the long term that the bear market is over. Not a chance.

CONCLUSION: Yesterday's downside exhaustion climax played out as we expected with a consolidation day. While support is still holding at $390, the 20-day EMA was broken. STOs are getting oversold, but they have plenty of room to move lower. Breadth is thinning and the bias in both the short and intermediate terms is bearish. The SCI has topped and we have a new PMO SELL signal. The only conclusion is that support at $390 will be broken and we have more downside to endure. Be careful of bull traps right now. We could see a small bounce; it's doubtful, but if we do, it's likely a trap.
Erin is 10% exposed but considering the addition of inverse ETFs.
Have you subscribed the DecisionPoint Diamonds yet? DP does the work for you by providing handpicked stocks/ETFs from exclusive DP scans! Add it with a discount! Contact support@decisionpoint.com for more information!
BITCOIN
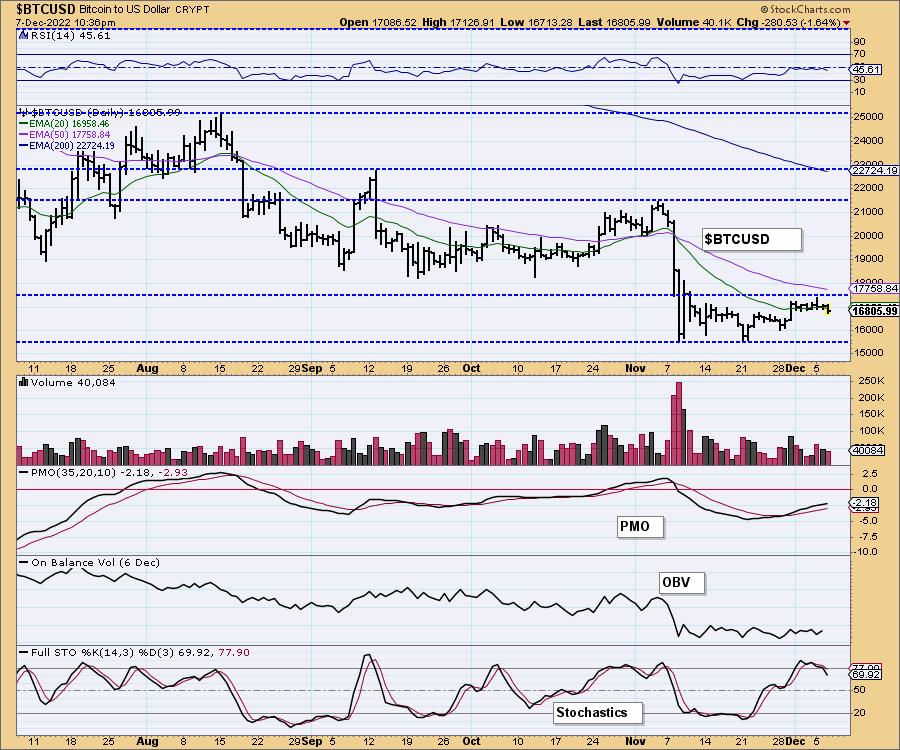
Bitcoin lost support at the 20-day EMA. Given the downside pressure on the market, Bitcoin will likely struggle as well. The PMO is still stubbornly rising, but we are getting attention flags from the topping RSI and drop below 80 by Stochastics. Expect more decline.
INTEREST RATES
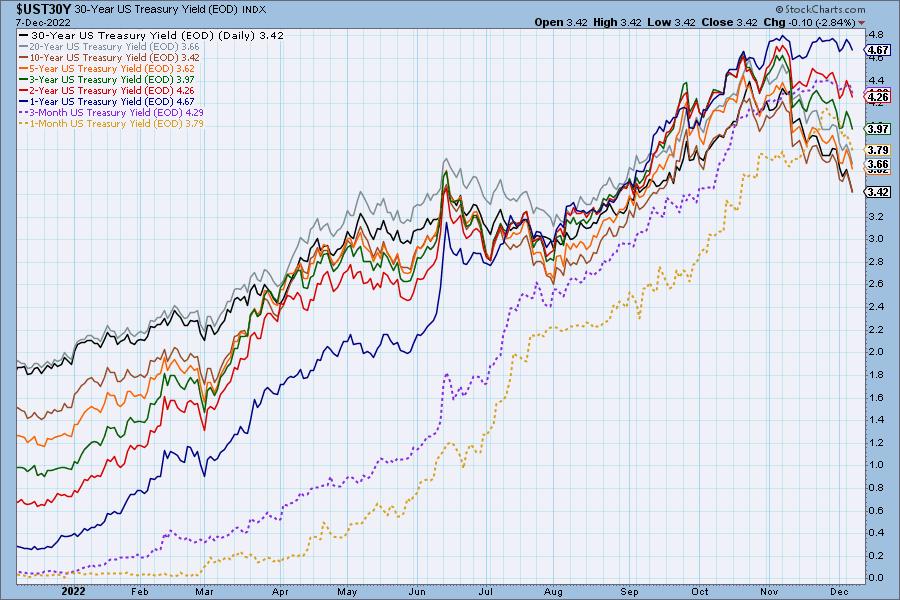
As suspected, the decline in interest rates seems to have resumed with rate inversions getting worse. We don't think the rise in rates is finished, but clearly the correction is on right now.
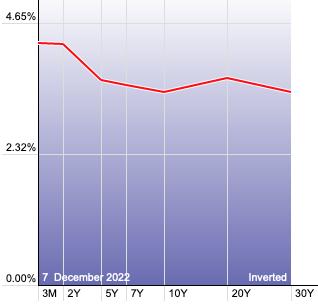
The Yield Curve Chart from StockCharts.com shows us the inversions taking place. The red line should move higher from left to right. Inversions are occurring where it moves downward.
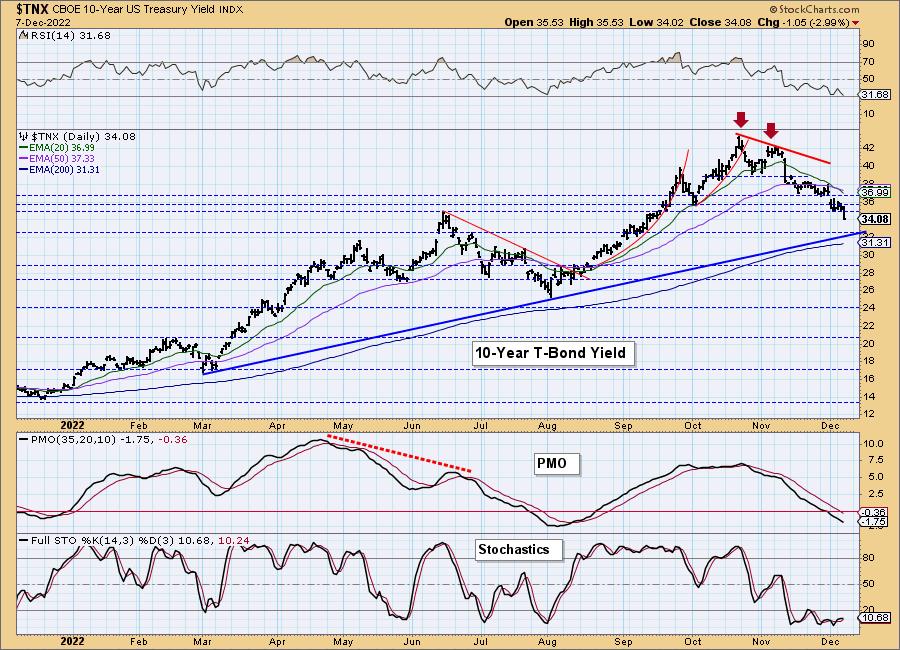
10-YEAR T-BOND YIELD
Not surprisingly, $TNX lost support. There is a strong support zone arriving at 3.2%, the 200-day EMA and rising trendline. If the rising trend is broken, Bonds will be an even better place to be than they are right now. Nothing on this chart tells us to expect an upside reversal.
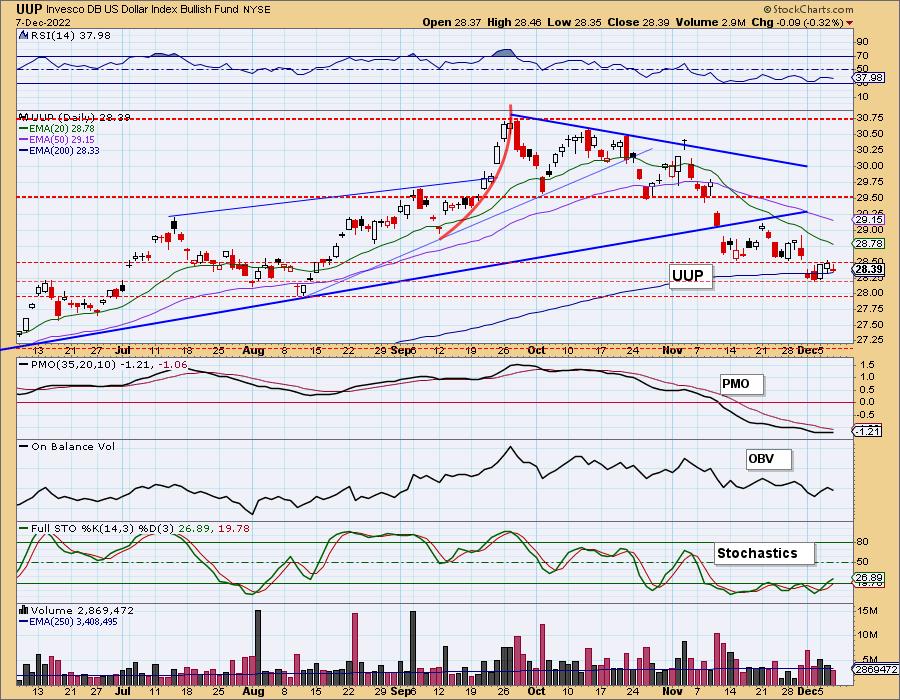
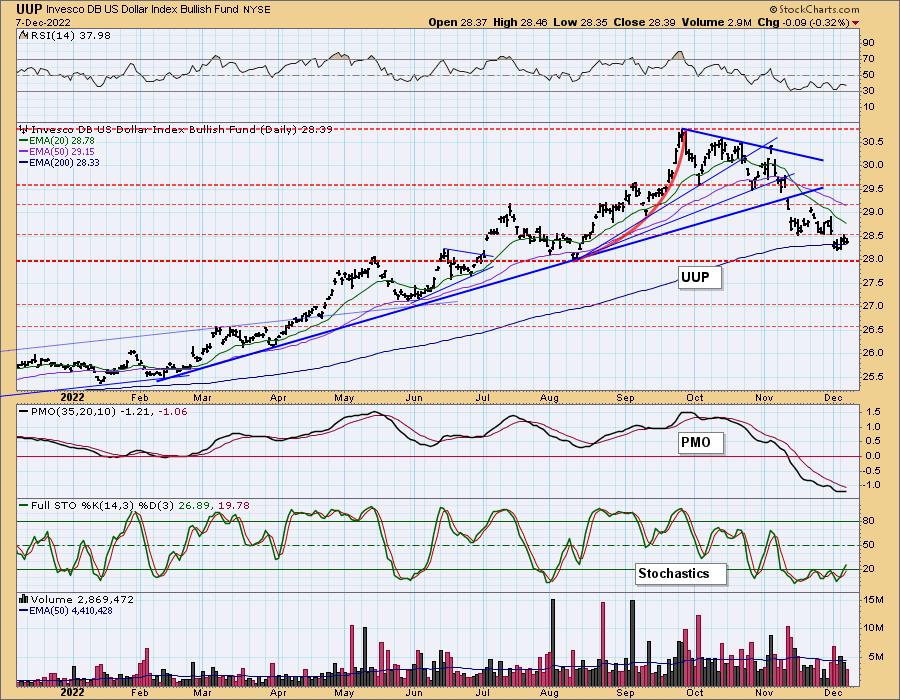
DOLLAR (UUP)
IT Trend Model: NEUTRAL as of 11/14/2022
LT Trend Model: BUY as of 8/19/2021
UUP Daily Chart: UUP was lower on the day as it continues to cluster beneath resistance and to hold above the June highs. Indicators are still wishy washy. The RSI is firmly negative, but Stochastics are rising above 20 now. The PMO is basically flat and unhelpful. This resembles a reverse island formation. Unfortunately, we don't know if it is until it gaps up. Expect more sideways movement. Hopefully the PMO will pick a direction soon.
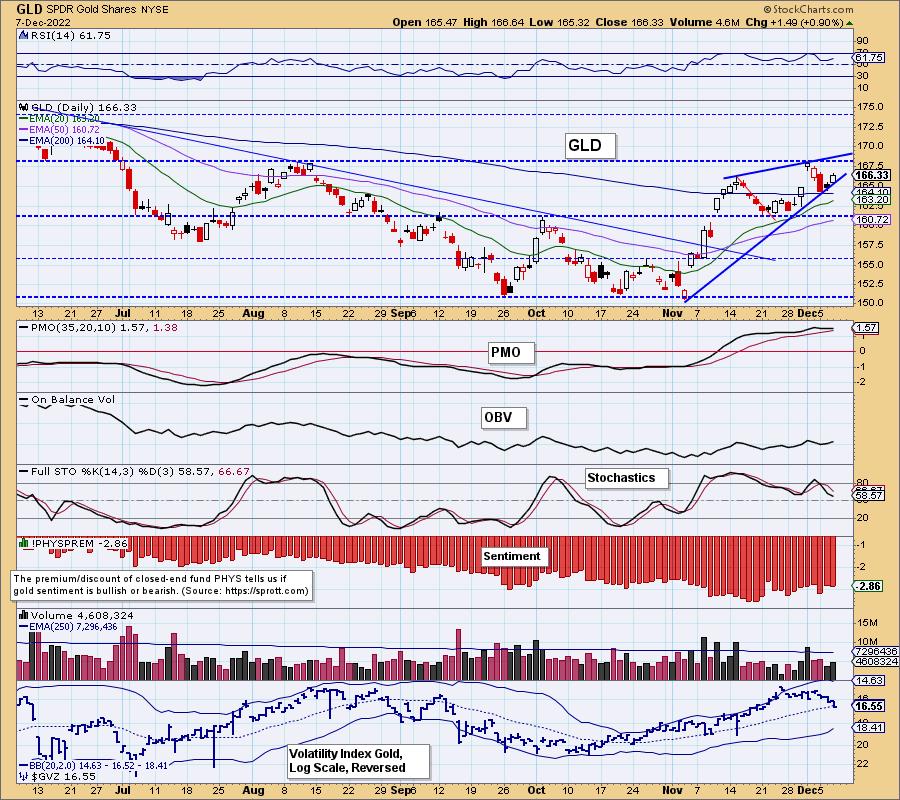
GOLD
IT Trend Model: BUY as of 11/14/2022
LT Trend Model: SELL as of 6/30/2022
GLD Daily Chart: Gold rallied as the Dollar declined. We note that it rallied more than the inverse of the Dollar's decline so we did see more Gold buyers today. The short-term rising trend remains intact, but the bearish rising wedge also remains intact. The PMO did turn slightly up and that would give us a second bottom above the signal line which is quite bullish. We want to see some confirmation from Stochastics as they are still in decline and the PMO is very overbought.
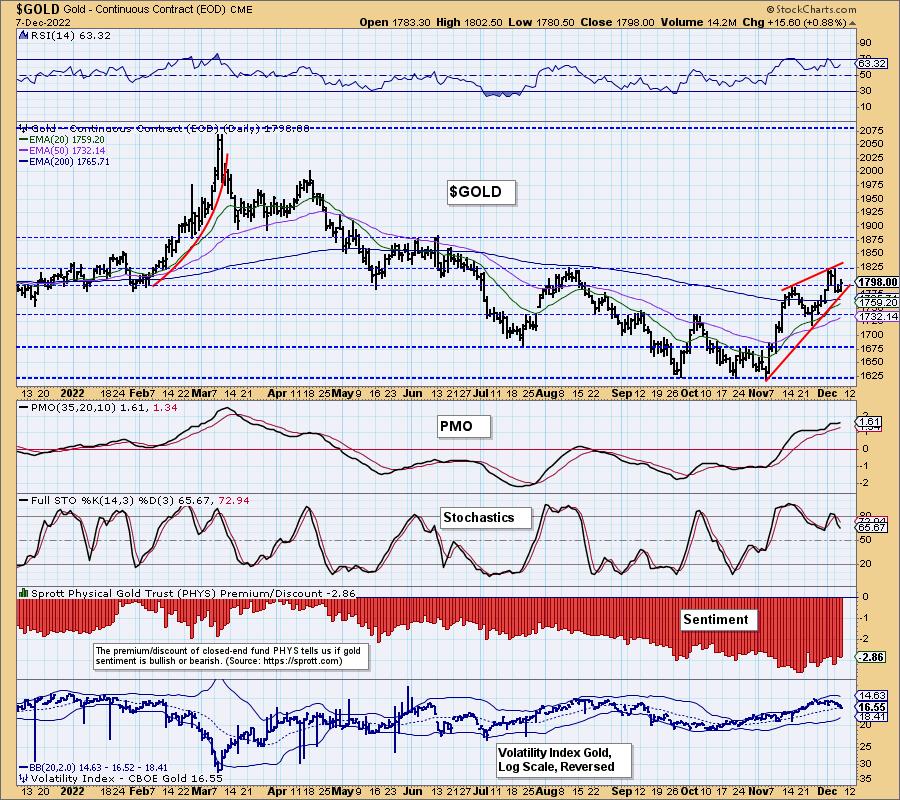
GOLD Daily Chart: Looking at $GOLD, we are better able to see the PMO turning up. We also see that it isn't as overbought as it can get which does leave us with a more bullish bias. Discounts remain high so sentiment is quite bearish. That condition could help fuel more upside for Gold. However, the bearish wedge is a big problem. Let's hope Stochastics turn back up soon.
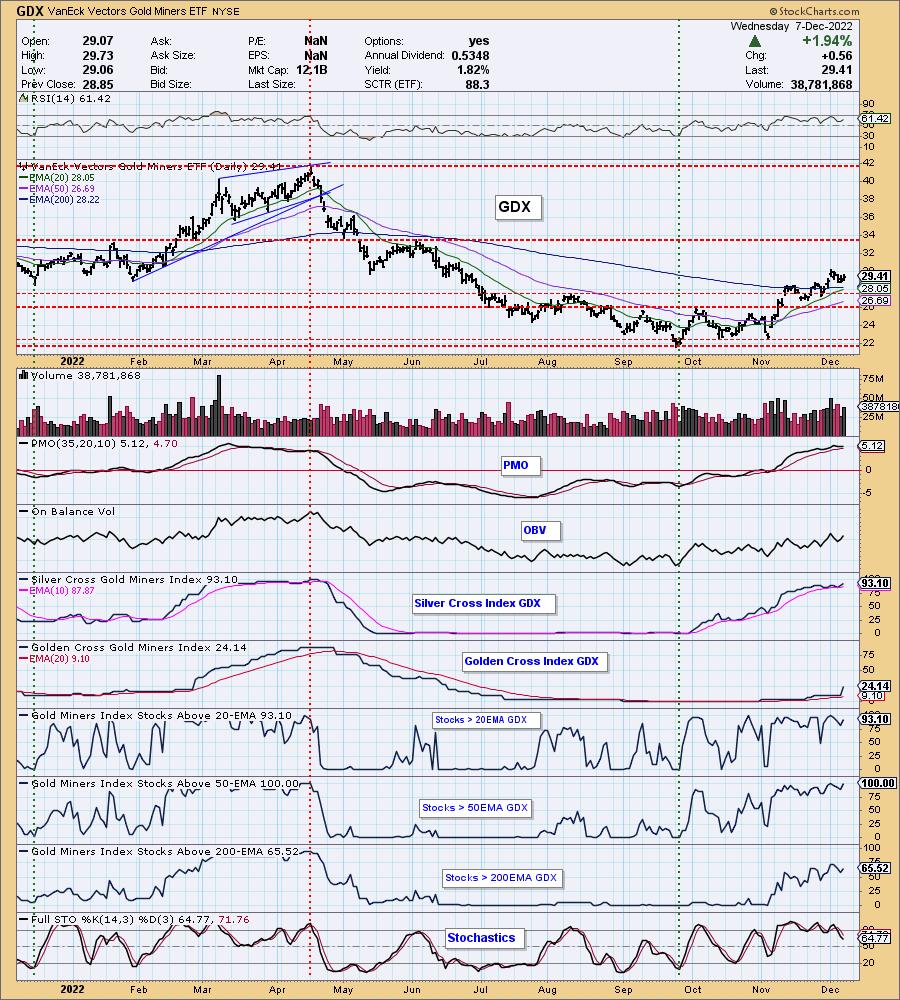
GOLD MINERS Golden and Silver Cross Indexes: Gold Miners rallied alongside Gold in spite of the market. The PMO bottomed above the signal line just like Gold which is very bullish. The rising trend continues but Stochastics are confirming and the PMO is definitely overbought. Participation remains strong across the board. Notice the surge by the GCI upward. Participation can remain overbought in a strong rising trend and that is exactly what we have. The group is still vulnerable given Stochastics are still in decline. Enjoy the ride, but honor your stops.
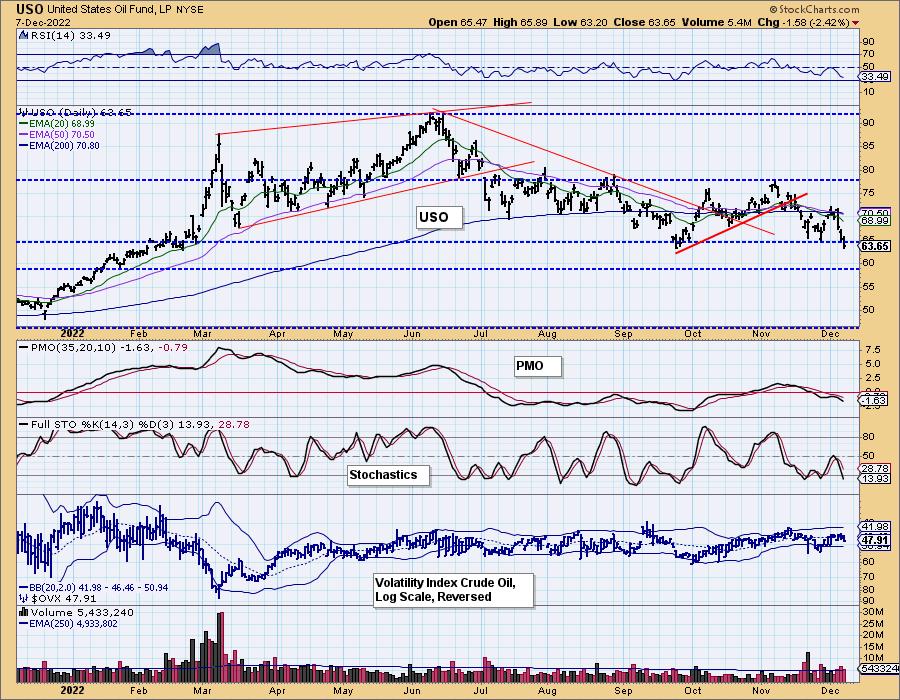
CRUDE OIL (USO)
IT Trend Model: NEUTRAL as of 11/21/2022
LT Trend Model: SELL as of 12/6/2022
USO Daily Chart: USO is now testing support at the September low. The voracity of this decline suggests a break below that support level. Indicators also tell us to expect a breakdown. The RSI is very negative and falling. The PMO topped beneath its signal line and continues lower. It is not oversold yet. Stochastics are now below 20 and declining.
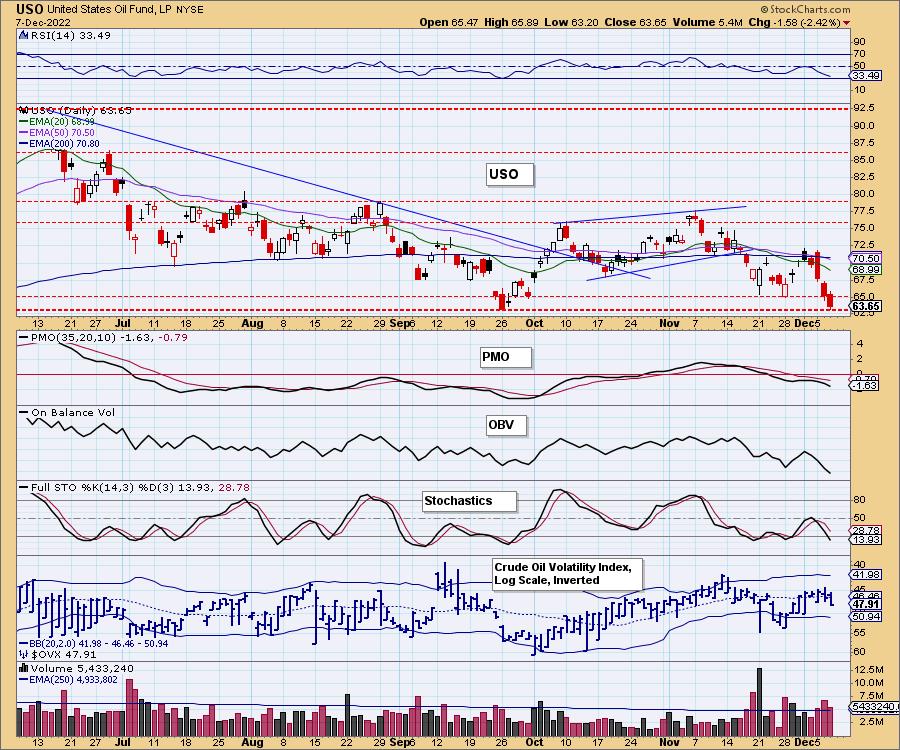
The next support level doesn't arrive until USO drops below $60.
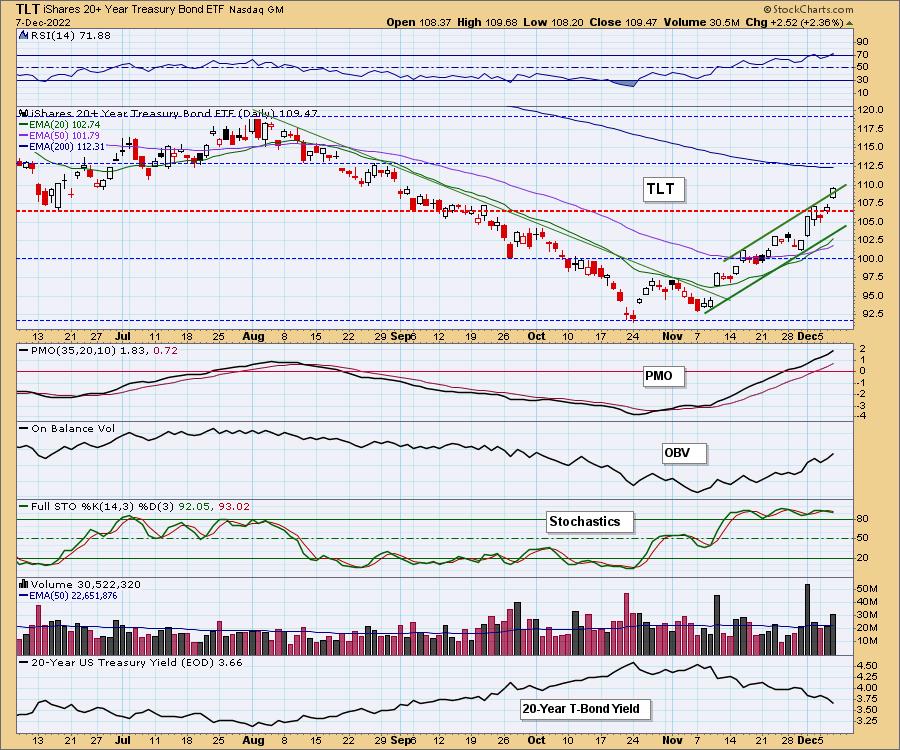
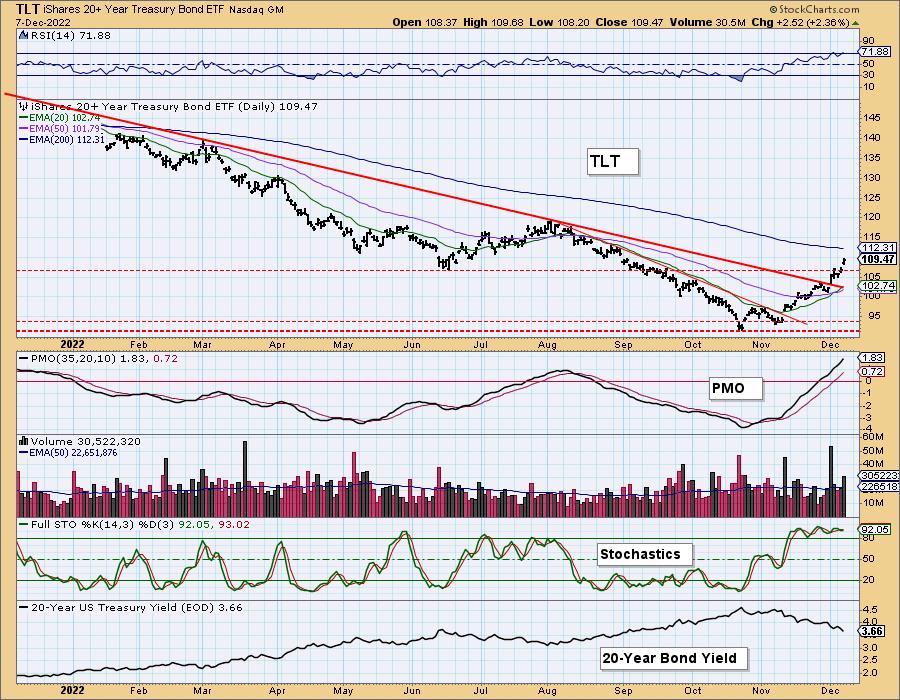
BONDS (TLT)
IT Trend Model: BUY as of 12/2/2022
LT Trend Model: SELL as of 1/19/2022
TLT Daily Chart: TLT is breaking out of its already rising trend channel. That is especially bullish. Indicators are strong. The RSI is now overbought so it may be a little late for entry, but given the strong PMO, and Stochastics oscillating above 80, there is certainly more upside available.
Good Luck & Good Trading!
Erin Swenlin and Carl Swenlin
Technical Analysis is a windsock, not a crystal ball. --Carl Swenlin
(c) Copyright 2022 DecisionPoint.com
Disclaimer: This blog is for educational purposes only and should not be construed as financial advice. The ideas and strategies should never be used without first assessing your own personal and financial situation, or without consulting a financial professional. Any opinions expressed herein are solely those of the author, and do not in any way represent the views or opinions of any other person or entity.
NOTE: The signal status reported herein is based upon mechanical trading model signals, specifically, the DecisionPoint Trend Model. They define the implied bias of the price index based upon moving average relationships, but they do not necessarily call for a specific action. They are information flags that should prompt chart review. Further, they do not call for continuous buying or selling during the life of the signal. For example, a BUY signal will probably (but not necessarily) return the best results if action is taken soon after the signal is generated. Additional opportunities for buying may be found as price zigzags higher, but the trader must look for optimum entry points. Conversely, exit points to preserve gains (or minimize losses) may be evident before the model mechanically closes the signal.
Helpful DecisionPoint Links:
DecisionPoint Alert Chart List
DecisionPoint Golden Cross/Silver Cross Index Chart List
DecisionPoint Sector Chart List
Price Momentum Oscillator (PMO)
Swenlin Trading Oscillators (STO-B and STO-V)
DecisionPoint is not a registered investment advisor. Investment and trading decisions are solely your responsibility. DecisionPoint newsletters, blogs or website materials should NOT be interpreted as a recommendation or solicitation to buy or sell any security or to take any specific action.