
The CPI dropped from 8.2% to 7.7% (year-over-year), and this set up a massive rally, based upon the hope that the Fed will now be forced to back off from future interest rate increases. Hope springs eternal! While we were generally expecting the rally to resume after the elections, we see the magnitude of today's move as a completely irrational reaction, and not as the start of a new bull market. Another bull trap. Nevertheless, we'll take it. It fits with our expectation that the rally would continue, albeit to an extreme degree. We recently published an article about how the big tech stocks were dragging the market down. Today was the opposite, in spades.
___
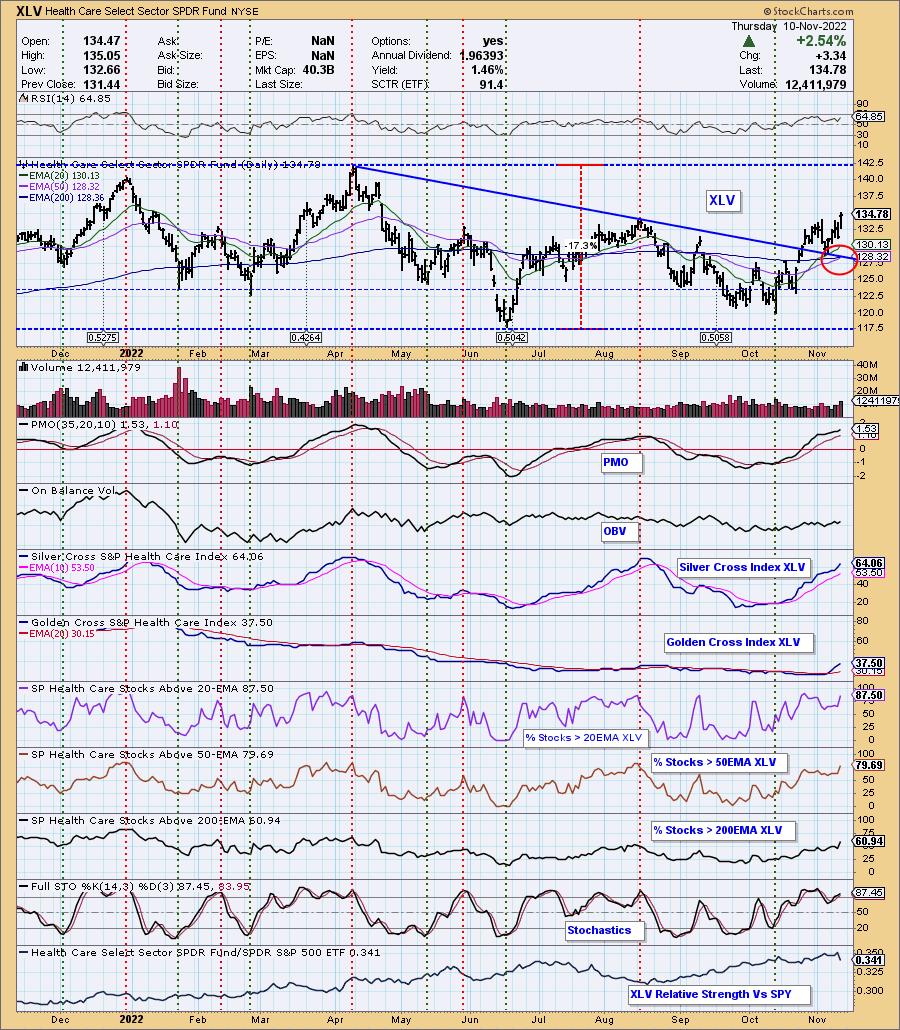
The Health Care Sector 50-day EMA crossed up through the 200-day EMA (Golden Cross), generating an LT Trend Model BUY signal. The sector broke out today and the PMO is now accelerating higher. The Silver Cross Index (SCI) is rising sharply. Participation of stocks above their 20/50/200-day EMAs is improving steadily and really none are overbought. The Golden Cross Index (GCI) also looks very favorable as it rises strongly. We're thinking that reaching this year's high is entirely possible.
The DecisionPoint Alert Weekly Wrap presents an end-of-week assessment of the trend and condition of the Stock Market, the U.S. Dollar, Gold, Crude Oil, and Bonds. The DecisionPoint Alert daily report (Monday through Thursday) is abbreviated and gives updates on the Weekly Wrap assessments.
Watch the latest episode of DecisionPoint on StockCharts TV's YouTube channel here!
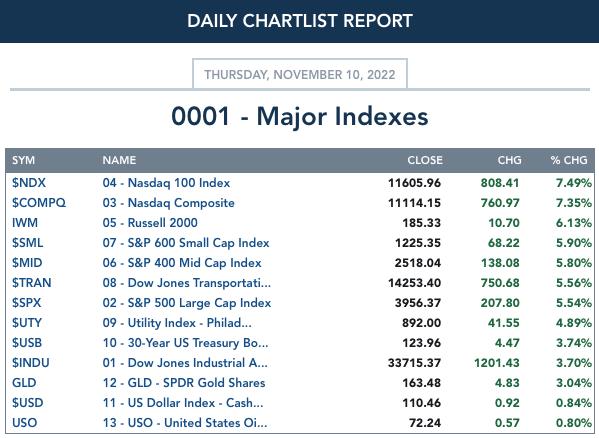
MAJOR MARKET INDEXES
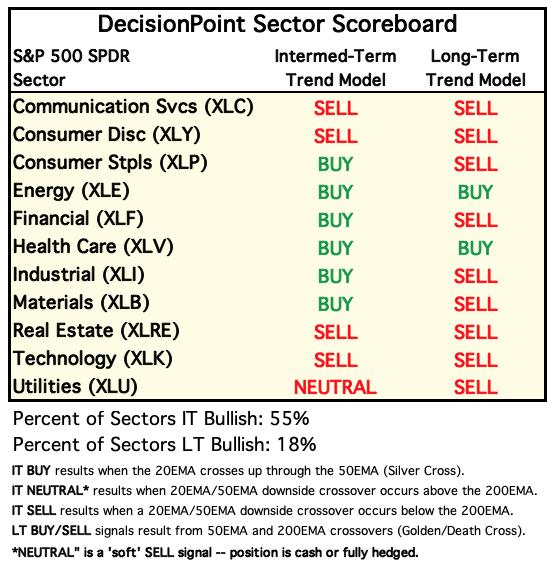
SECTORS
Each S&P 500 Index component stock is assigned to one of 11 major sectors. This is a snapshot of the Intermediate-Term (Silver Cross) and Long-Term (Golden Cross) Trend Model signal status for those sectors.
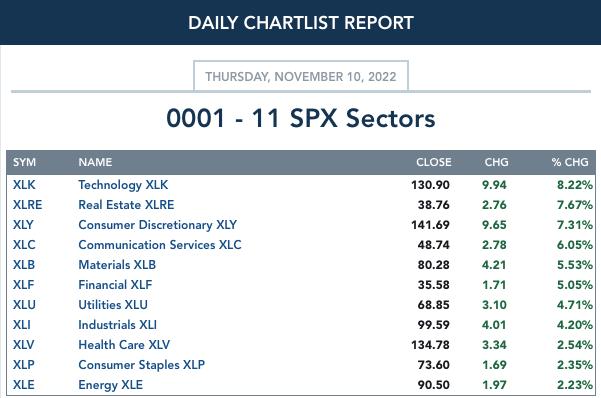
CLICK HERE for Carl's annotated Sector charts.
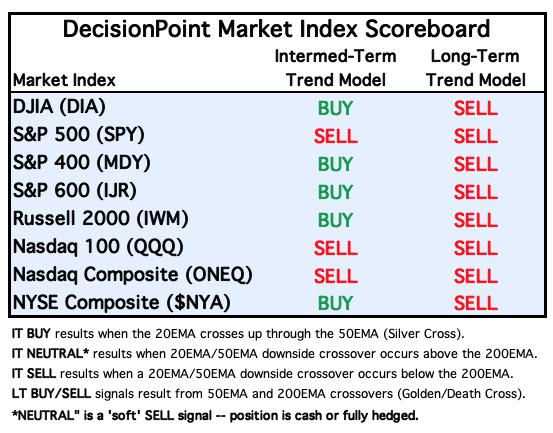
THE MARKET (S&P 500)
IT Trend Model: SELL as of 9/8/2022
LT Trend Model: SELL as of 5/5/2022
SPY Daily Chart: While we were very concerned with yesterday's selloff and the potential rising wedge breakdown, it was abundantly clear from the futures market before today's open, that today was going to see a major move to the upside. In four weeks the current rally has moved +13% from the October low, and we think it could easily last another four weeks. But we still believe it is just a bear market rally.
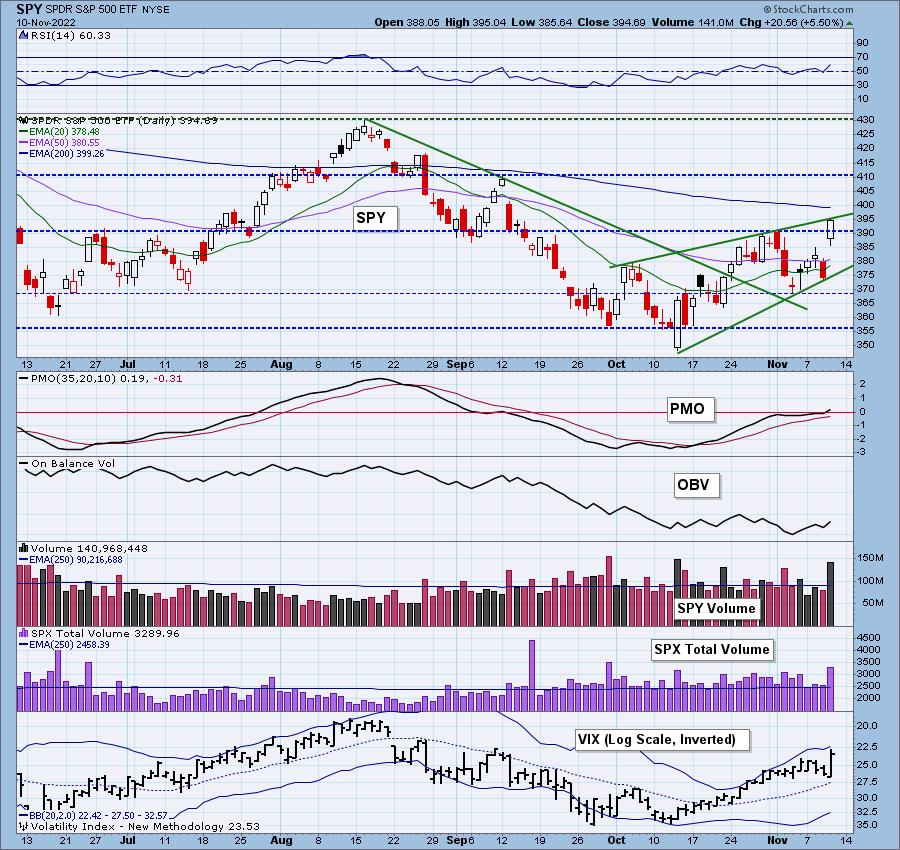
The PMO has moved above the zero line. Of concern would be the declining trend in the OBV as price tops are rising; that sets up a negative divergence. Stochastics are rising in positive territory as is the RSI. Notice that the VIX came very close to puncturing the upper Bollinger Band on our inverted scale. Typically those punctures will lead to short-term downside--although not so much last month.

Here is the latest recording:
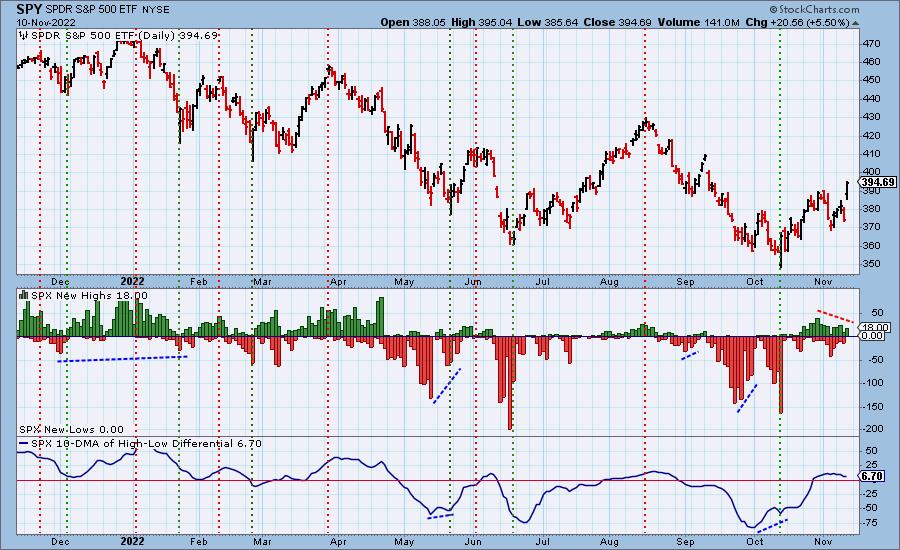
S&P 500 New 52-Week Highs/Lows: Today's New Highs expanded but not enough to exceed the spike in October. This is a negative divergence, which is surprising considering the strength of today's move.
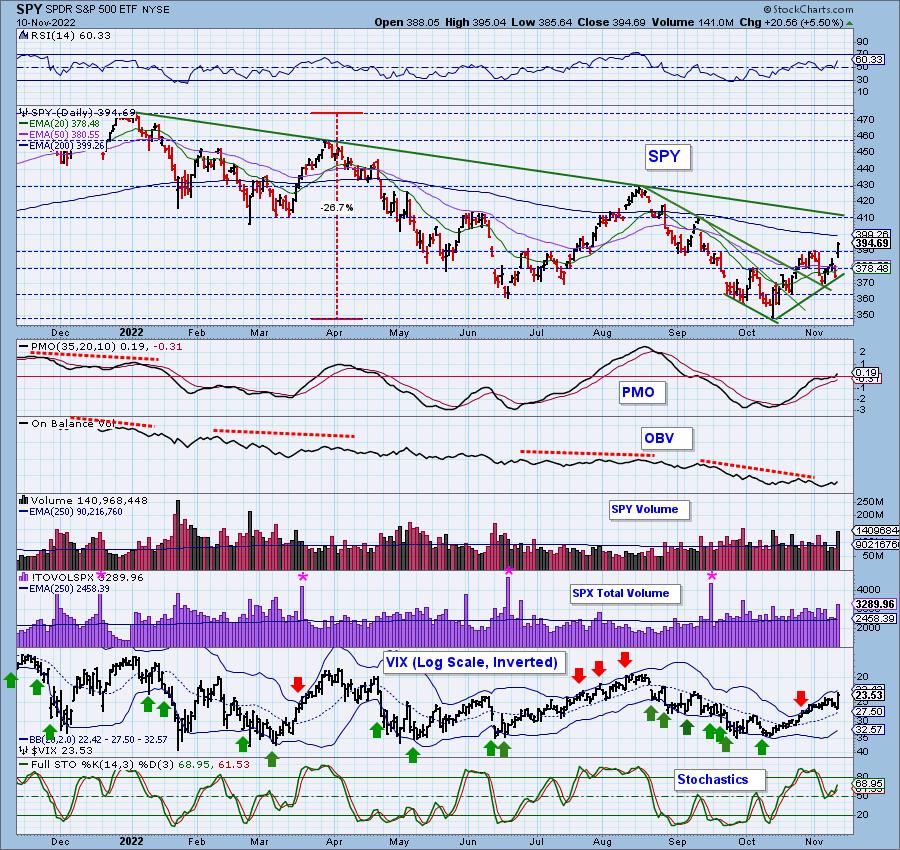
Climax* Analysis: Yesterday's downside initiation climax was strong and implied that selling would continue. Well, after today we can forget that. Today we got a strong upside initiation climax. SPX Total Volume was 133% of the one-year average daily volume -- potentially a blowoff, but probably not.
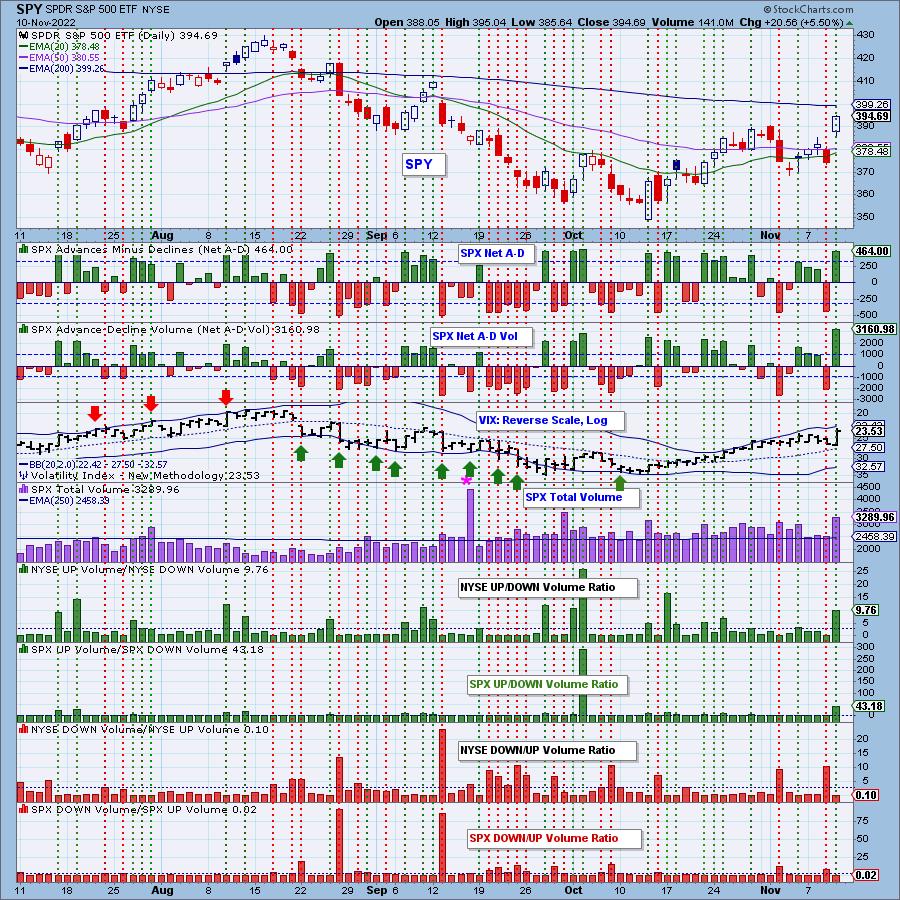
*A climax is a one-day event when market action generates very high readings in, primarily, breadth and volume indicators. We also include the VIX, watching for it to penetrate outside the Bollinger Band envelope. The vertical dotted lines mark climax days -- red for downside climaxes, and green for upside. Climaxes are at their core exhaustion events; however, at price pivots they may be initiating a change of trend.
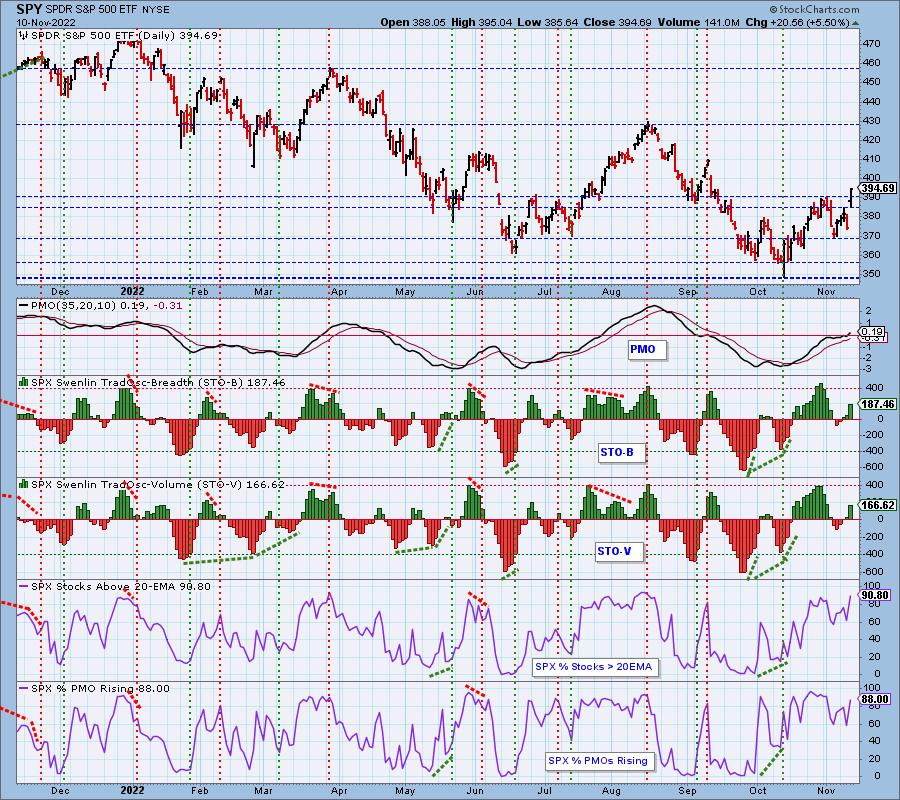
Short-Term Market Indicators: The short-term market trend is UP and the condition is NEUTRAL.
STOs popped higher today which confirms today's rally. Plenty of stocks have rising momentum and that could continue to fuel this rally.
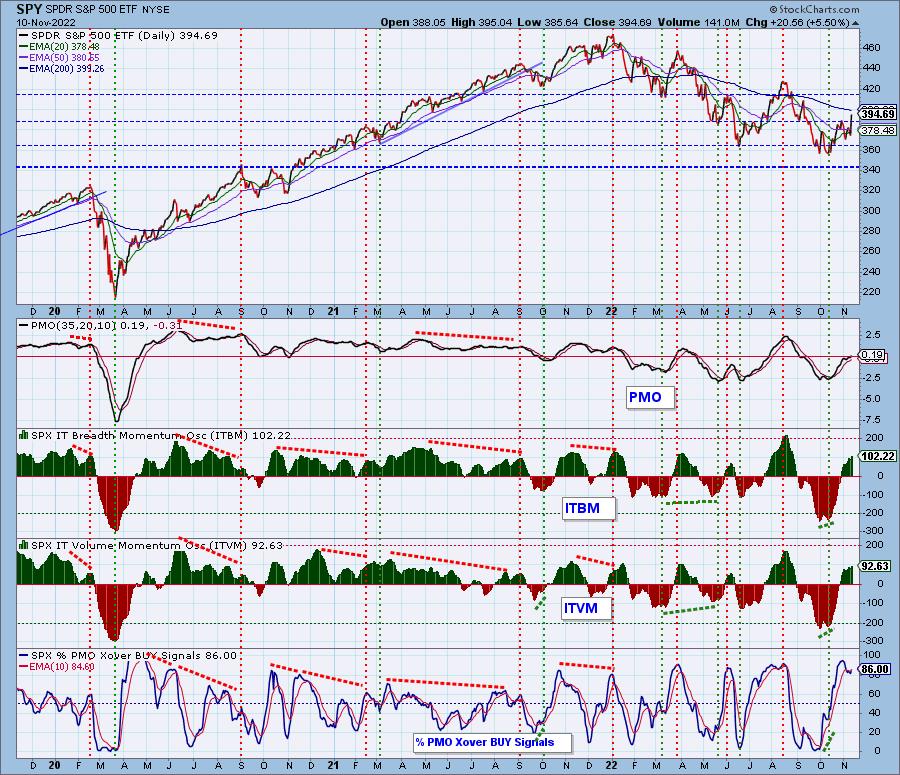
Intermediate-Term Market Indicators: The intermediate-term market trend is DOWN and the condition is SOMEWHAT OVERBOUGHT.
We were happy to see that both the ITBM and ITVM reversed higher, in fact, higher than previous readings this month. We saw a new positive crossover by %PMO BUY Signals.
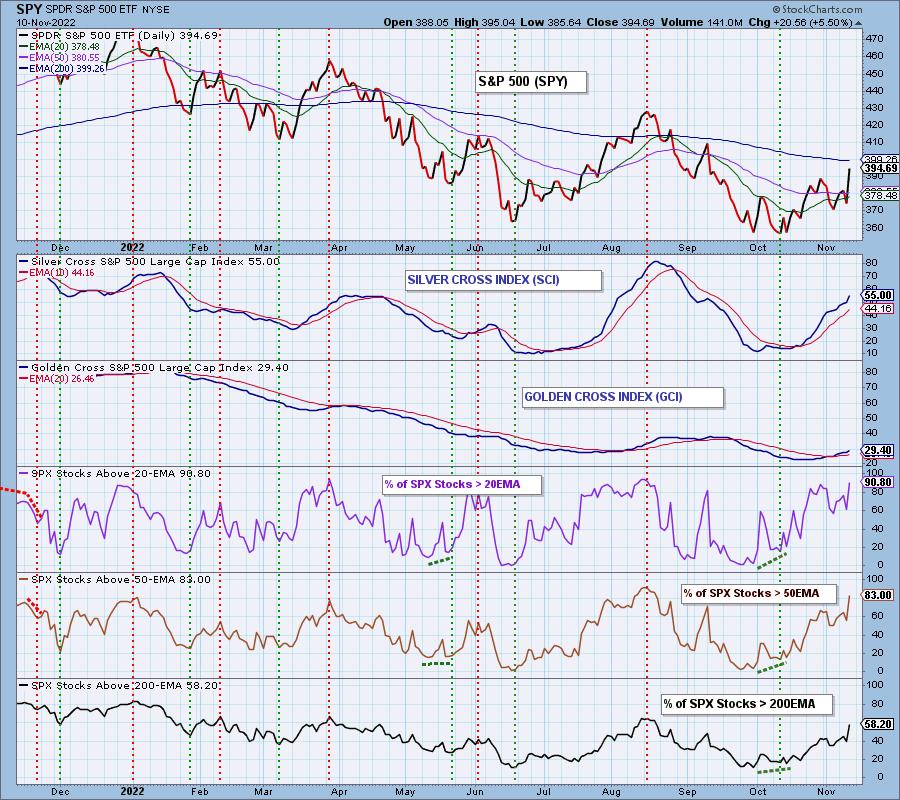
PARTICIPATION and BIAS Assessment: The following chart objectively shows the depth and trend of participation in two time frames.
- Intermediate-Term - the Silver Cross Index (SCI) shows the percentage of SPX stocks on IT Trend Model BUY signals (20-EMA > 50-EMA). The opposite of the Silver Cross is a "Dark Cross" -- those stocks are, at the very least, in a correction.
- Long-Term - the Golden Cross Index (GCI) shows the percentage of SPX stocks on LT Trend Model BUY signals (50-EMA > 200-EMA). The opposite of a Golden Cross is the "Death Cross" -- those stocks are in a bear market.
The short-term bias is BULLISH. Participation expanded greatly today.
The intermediate-term bias is BULLISH. The SCI accelerated higher and there are still a higher percentage of stocks above their 20/50-day EMAs
The long-term bias is BULLISH. Don't get the wrong idea. We still believe this is a bear market, but we have to acknowledge the GCI's crossover and continued move higher. It accelerated that move higher today. We also have far more stocks above their 50/200-day EMAs than those with golden crosses. This tells us the GCI should continue to rise as more stocks leave their bear market configurations behind.
CONCLUSION: Today's massive rally seems a little overdone, but it did trigger an upside initiation climax. STOs powered higher and best of all the ITBM/ITVM reversed course and are higher than last week's readings. The hangover will likely come later in the form of consolidation or churn, but for now we expect to see follow-through. Stops are still a good idea, but consider loosening them to accommodate a possible snap back followed by a resumption of this rally. We can tighten them again if this turns out to be a head fake.
Erin is 50% exposed.
Have you subscribed the DecisionPoint Diamonds yet? DP does the work for you by providing handpicked stocks/ETFs from exclusive DP scans! Add it with a discount! Contact support@decisionpoint.com for more information!
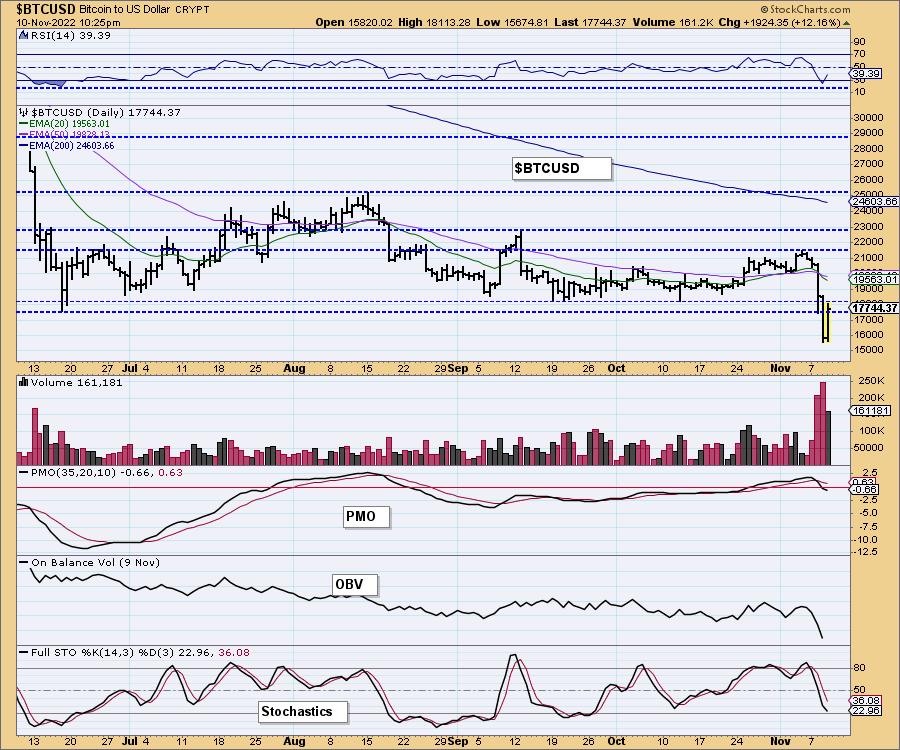
BITCOIN
Bitcoin reversed strongly today, but indicators are still negative with the RSI in negative territory below net neutral (50) and a PMO that has moved below the zero line and is declining. Stochastics still look sickly as well. Note that price was not able to recapture prior support at September and October lows. Maybe the failure of FTX is being absorbed, but overall we'd be careful with crypto until it recaptures its prior trading range.
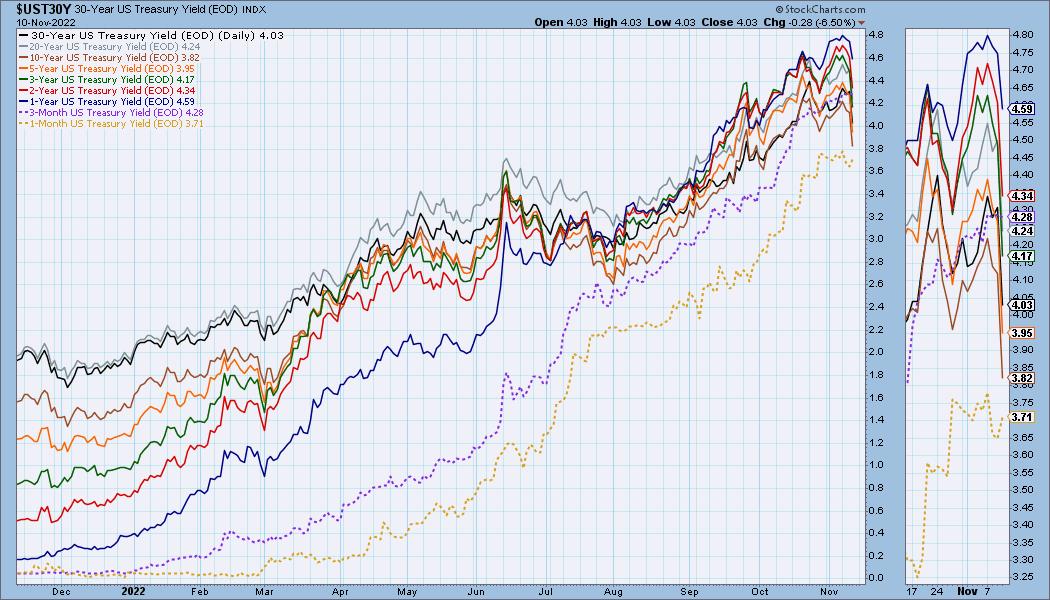
INTEREST RATES
Yields tumbled today with the 30-year tumbling 650 basis points! This is very good for the market and if they can continue to fall, the current rally should hang around longer than many expect.
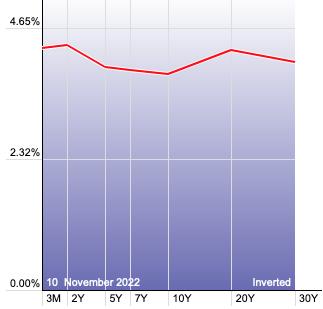
The Yield Curve Chart from StockCharts.com shows us the inversions taking place. The red line should move higher from left to right. Inversions are occurring where it moves downward.
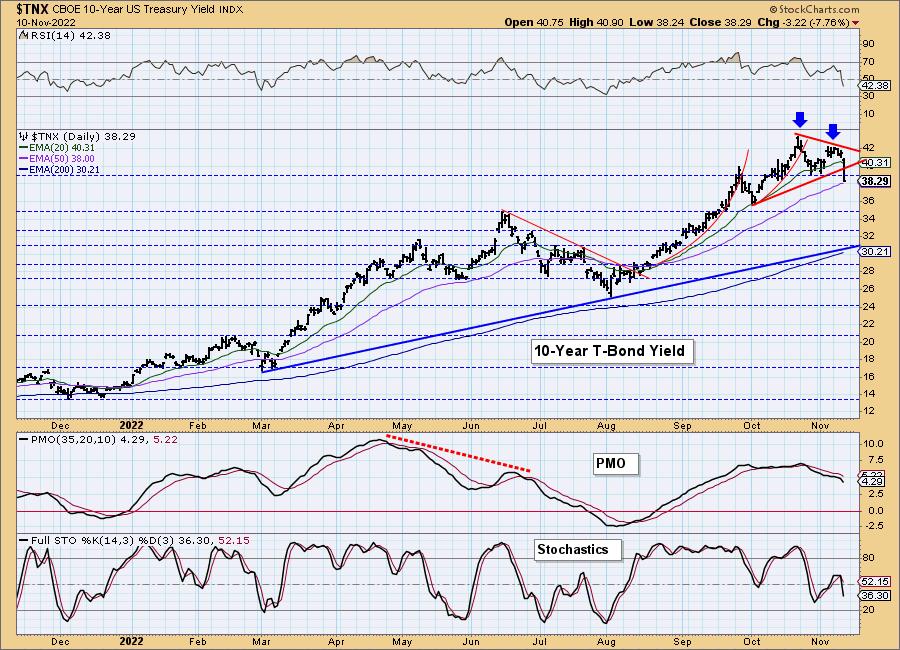
10-YEAR T-BOND YIELD
Instead of testing the short-term rising trend, $TNX dropped 776 basis points! This gives us a confirmed Adam and Eve Double-Top pattern since $TNX dropped below the confirmation line. The indicators are getting worse. The market may finally get its wish and see rates drop even further.
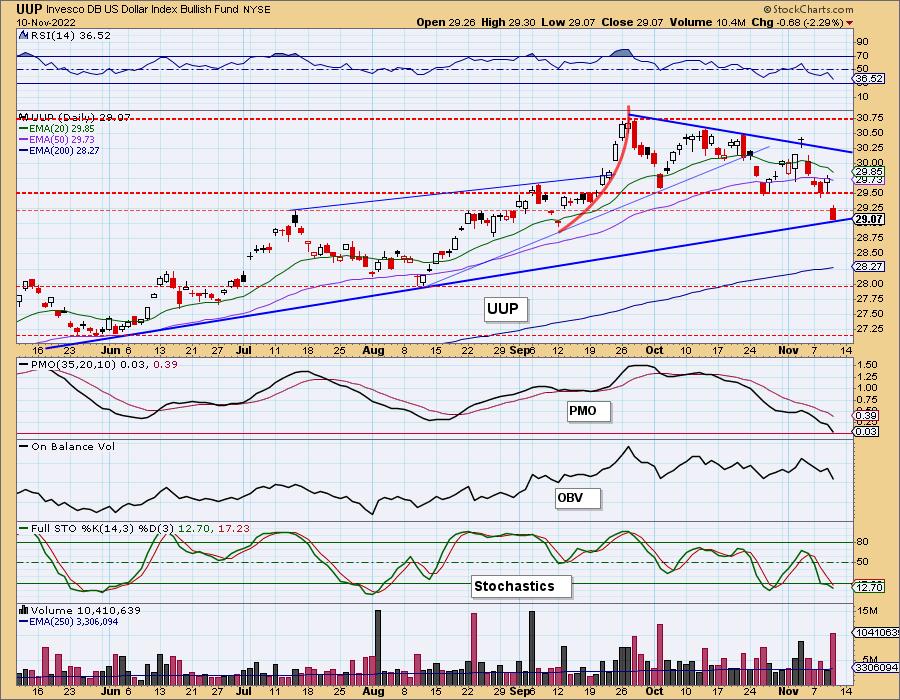
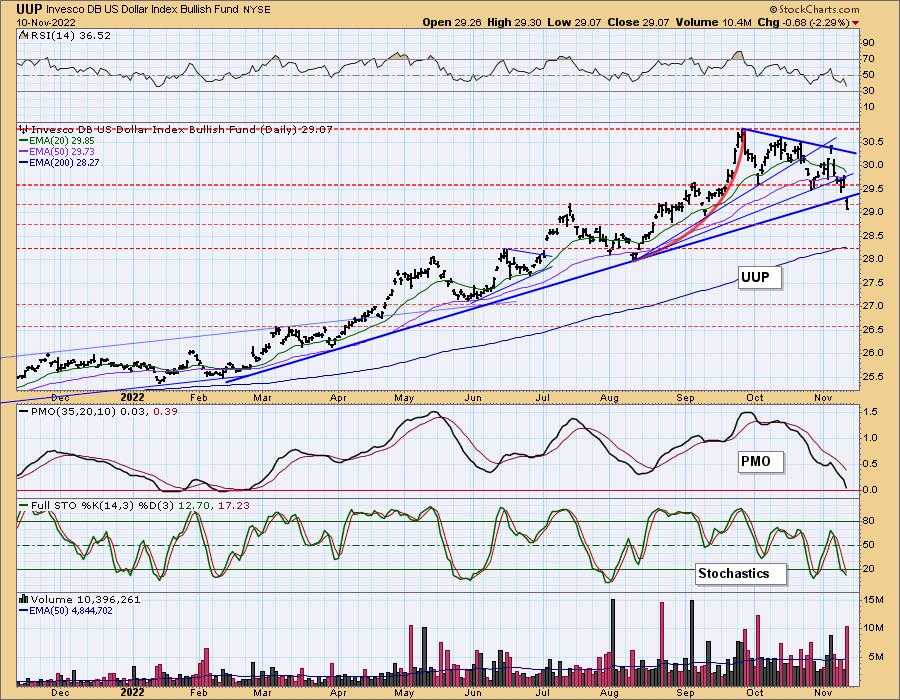
DOLLAR (UUP)
IT Trend Model: BUY as of 6/22/2021
LT Trend Model: BUY as of 8/19/2021
UUP Daily Chart: The Dollar tumbled lower, not only confirming the bearish descending triangle (declining tops, flat bottoms), but also bringing it down to test the intermediate-term rising bottoms trendline. This seems a good place for the Dollar to digest the decline. However, given the voracity of the decline, it seems most likely that it will test the 200-day EMA.
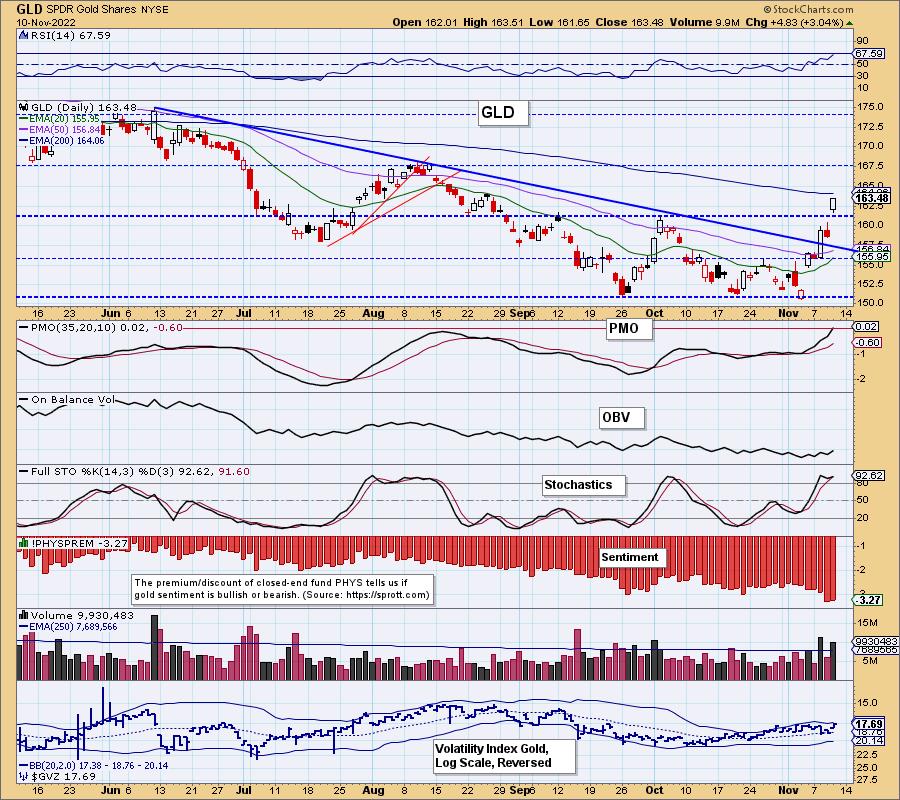
GOLD
IT Trend Model: NEUTRAL as of 5/3/2022
LT Trend Model: SELL as of 6/30/2022
GLD Daily Chart: GLD broke out with the Dollar tumbling. The PMO is now above the zero line for the first time in months on GLD ($GOLD saw a PMO above the zero line in August). Stochastics have turned up above 80 and the RSI is rising and not quite overbought. The next level of resistance will be the 200-day EMA.
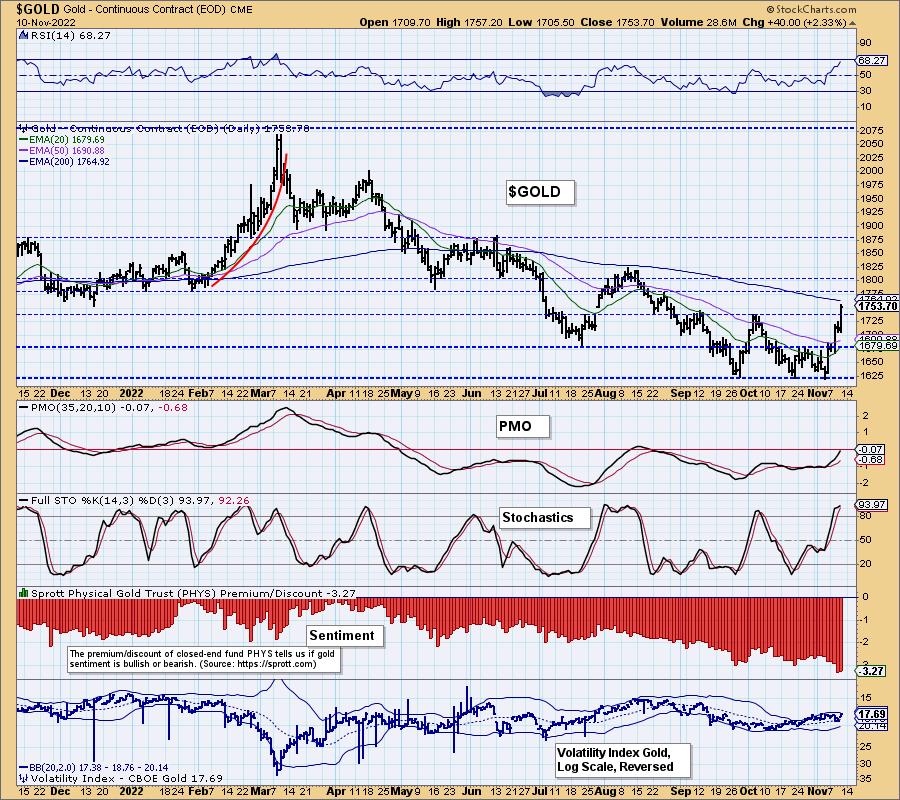
GOLD Daily Chart: $GOLD logged another historic reading on discounts. These extremes mean investors are very bearish on Gold (although probably not as much given today's major rally) and with sentiment being contrarian, they have been screaming that a rally in Gold was imminent. The PMO isn't above the zero line just yet on $GOLD, but we expect it to be tomorrow.
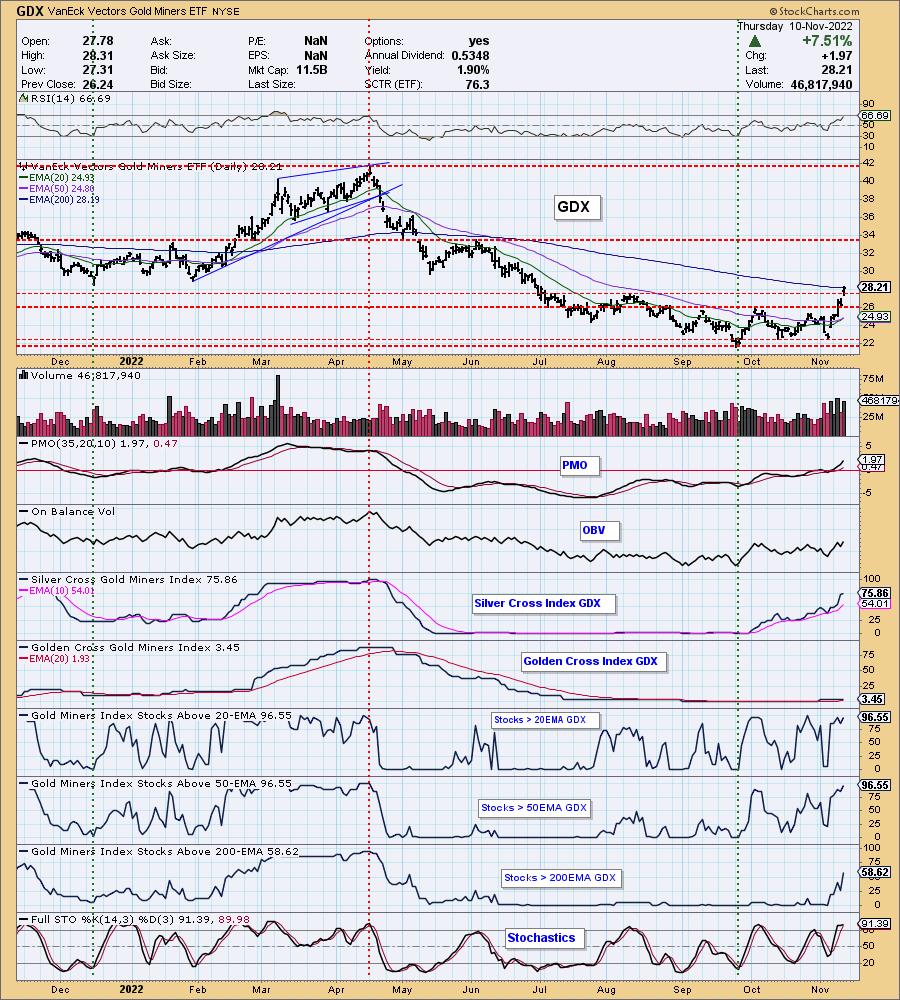
GOLD MINERS Golden and Silver Cross Indexes: Gold Miners are off to the races. We noted yesterday that participation didn't thin on yesterday's pullback and price remained above support. We still like the group and given the outlook for Gold is very bullish, Miners should see far more upside.
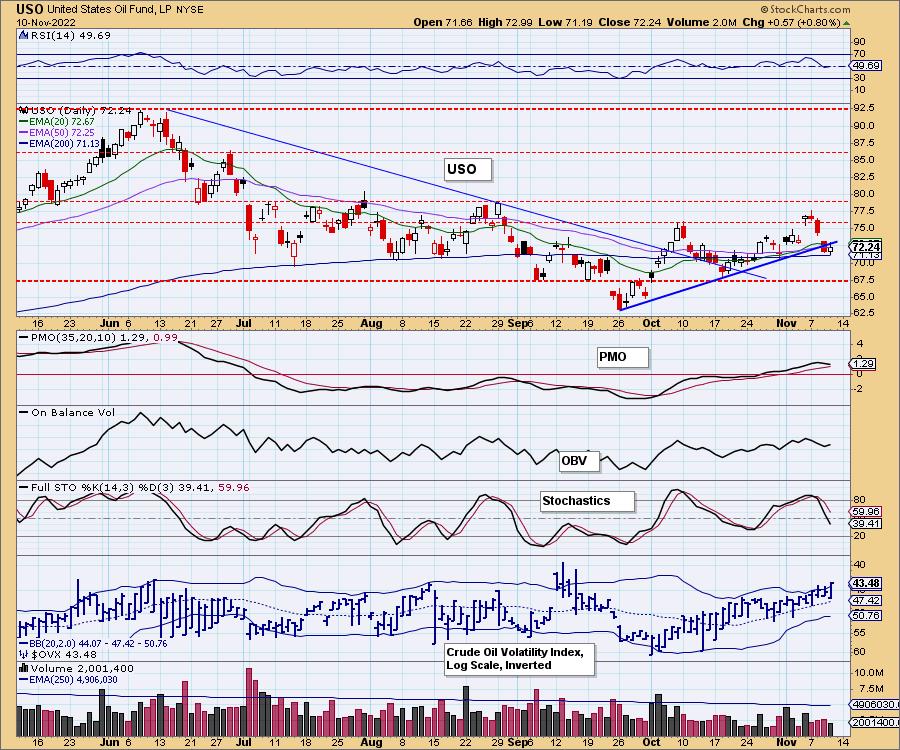
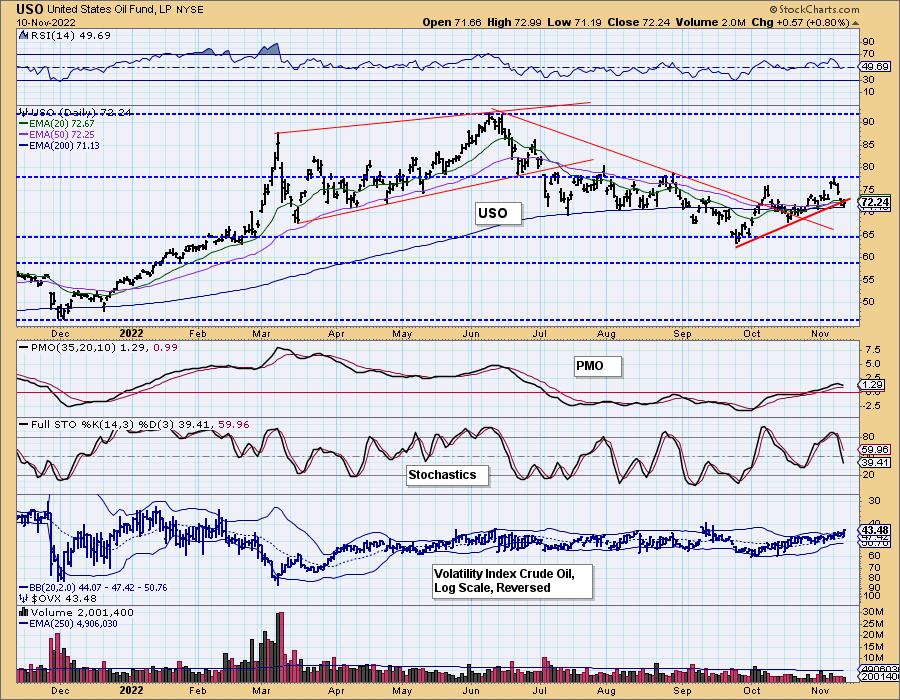
CRUDE OIL (USO)
IT Trend Model: BUY as of 11/4/2022
LT Trend Model: BUY as of 3/9/2021
USO Daily Chart: Yesterday's comments still apply + some:
"USO broke its short-term rising trend. The indicators have now turned south again. Support is still holding along the 200-day EMA but given the deterioration of our primary indicators, we would look for a test of the October low."
We're still somewhat bearish on USO, but today price did hold above the 200-day EMA which is encouraging. We just expect that Energy has gotten extended and will likely see either churn or a continuation of this decline.
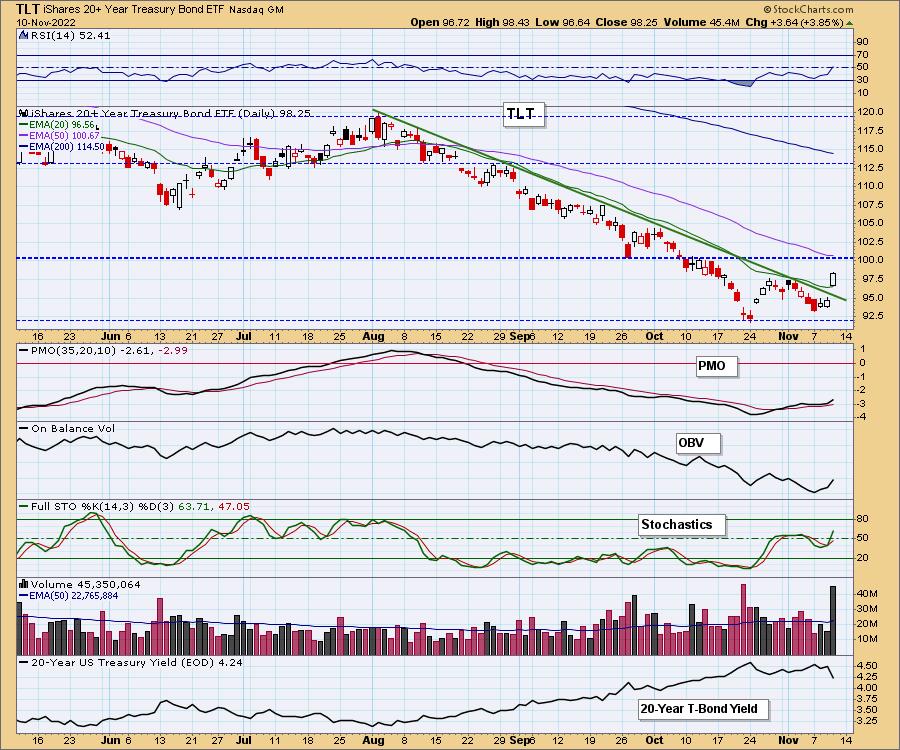
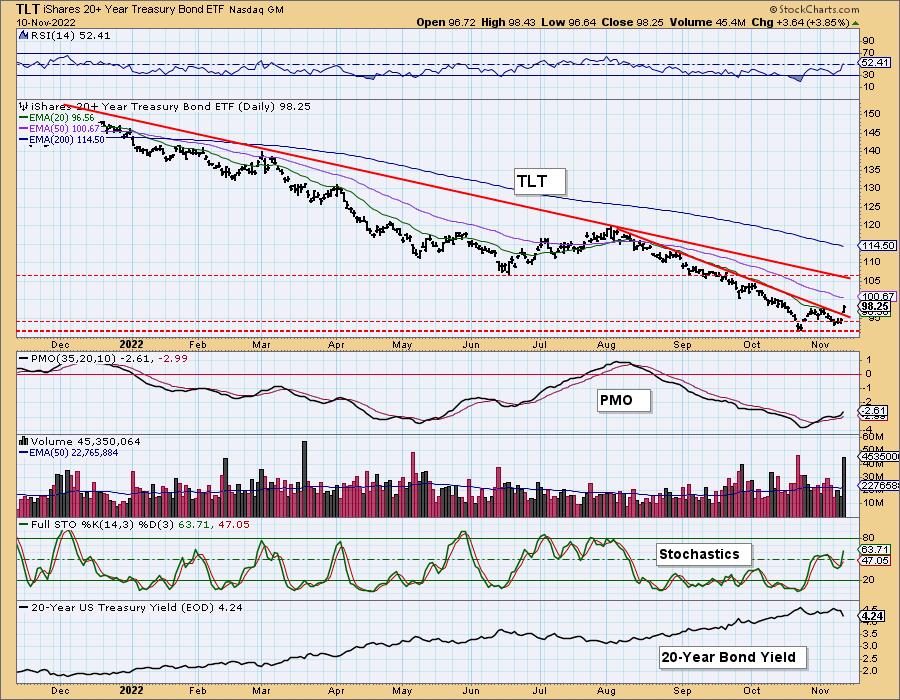
BONDS (TLT)
IT Trend Model: SELLas of 8/19/2022
LT Trend Model: SELL as of 1/19/2022
TLT Daily Chart: Well so much for our conclusion that the intermediate-term declining trend would hold. The giant drop in yields set the stage of TLT's gap up move. It does appear rates are cooling so a test of the 50-day EMA seems likely. Indicators are certainly very bullish and suggest that it could see an upside breakout at $100.
Good Luck & Good Trading!
Erin Swenlin and Carl Swenlin
Technical Analysis is a windsock, not a crystal ball. --Carl Swenlin
(c) Copyright 2022 DecisionPoint.com
Disclaimer: This blog is for educational purposes only and should not be construed as financial advice. The ideas and strategies should never be used without first assessing your own personal and financial situation, or without consulting a financial professional. Any opinions expressed herein are solely those of the author, and do not in any way represent the views or opinions of any other person or entity.
NOTE: The signal status reported herein is based upon mechanical trading model signals, specifically, the DecisionPoint Trend Model. They define the implied bias of the price index based upon moving average relationships, but they do not necessarily call for a specific action. They are information flags that should prompt chart review. Further, they do not call for continuous buying or selling during the life of the signal. For example, a BUY signal will probably (but not necessarily) return the best results if action is taken soon after the signal is generated. Additional opportunities for buying may be found as price zigzags higher, but the trader must look for optimum entry points. Conversely, exit points to preserve gains (or minimize losses) may be evident before the model mechanically closes the signal.
Helpful DecisionPoint Links:
DecisionPoint Alert Chart List
DecisionPoint Golden Cross/Silver Cross Index Chart List
DecisionPoint Sector Chart List
Price Momentum Oscillator (PMO)
Swenlin Trading Oscillators (STO-B and STO-V)
DecisionPoint is not a registered investment advisor. Investment and trading decisions are solely your responsibility. DecisionPoint newsletters, blogs or website materials should NOT be interpreted as a recommendation or solicitation to buy or sell any security or to take any specific action. :