
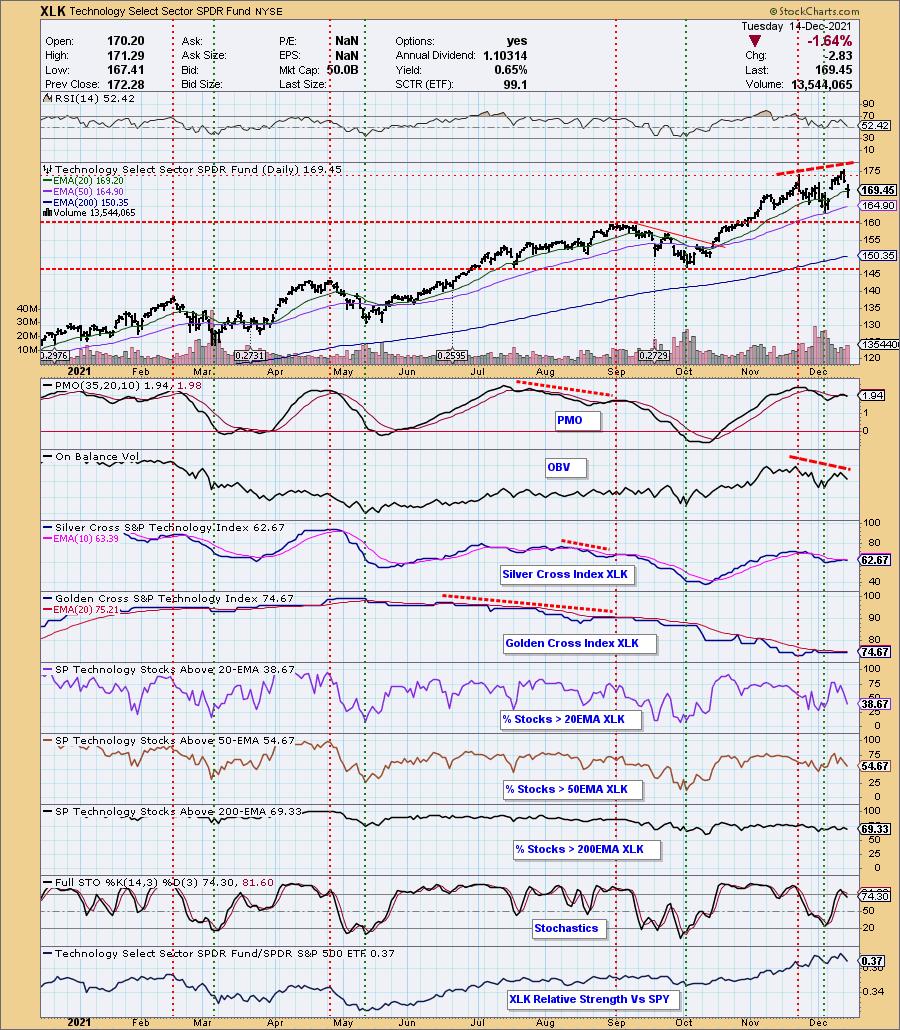
On Friday, I had two sectors on my radar: Technology (XLK) and Consumer Staples (XLP). Both saw breakouts to new all-time highs and strong "under the hood" indicators. I noted that if the market were to reverse to the downside, XLP would likely see a continuation. XLK had better relative performance with similar participation and bullish bias, but I knew that a market reversal would limit any upside XLK might have.
The market did reverse, taking XLK with it. Today XLK gapped down after a strong pullback yesterday. On the bright side it closed above the 20-EMA and the RSI is still positive. However, the rest of the indicators have reversed. The PMO triggered a whipsaw SELL signal. There is a strong negative divergence between the OBV tops and price tops. Stochastics have topped. %Stocks > 20/50-EMAs dropped well below the SCI reading giving XLK a strong bearish bias in the short term. The intermediate-term bias is neutral given the SCI is flat and holding at 63%. The long-term bias is neutral to bullish given the GCI reading is above 70% and %Stocks > 200-EMA has a similar reading.
The DecisionPoint Alert Weekly Wrap presents an end-of-week assessment of the trend and condition of the Stock Market, the U.S. Dollar, Gold, Crude Oil, and Bonds. The DecisionPoint Alert daily report (Monday through Thursday) is abbreviated and gives updates on the Weekly Wrap assessments.
Watch the latest episode of DecisionPoint on StockCharts TV's YouTube channel here!
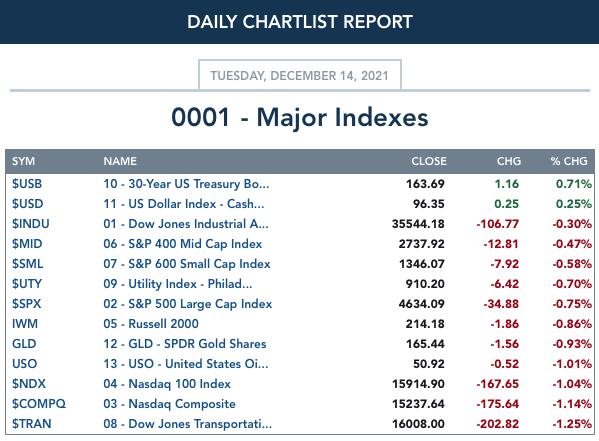
MAJOR MARKET INDEXES
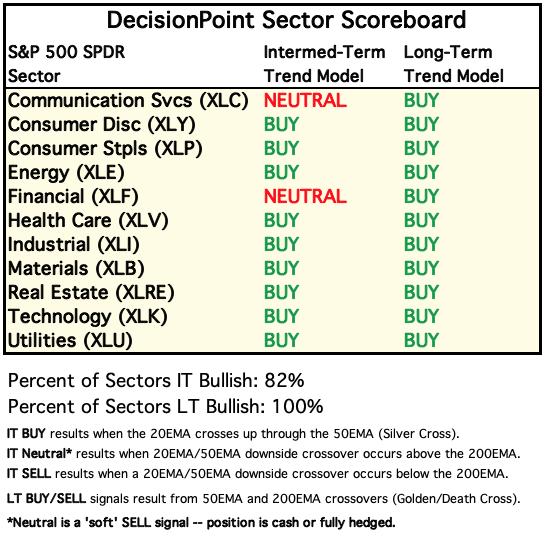
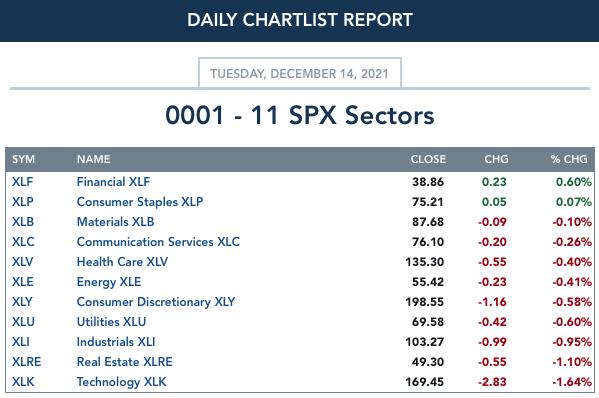
SECTORS
Each S&P 500 Index component stock is assigned to one, and only one, of 11 major sectors. This is a snapshot of the Intermediate-Term (Silver Cross) and Long-Term (Golden Cross) Trend Model signal status for those sectors.
RRG® Chart: Yesterday's comments still apply:
"The only sectors in the "Leading" quadrant are defensive. XLK had looked promising going into this week, but as I mentioned on Friday, if the market was not going to break out, XLP would be the sector to watch. XLE is losing strength. XLI and XLB are moving in the north, northeast direction which is bullish. XLF and XLC look less promising and XLE is moving southeast. It is in Improving, but with that heading it could slip back into Lagging."
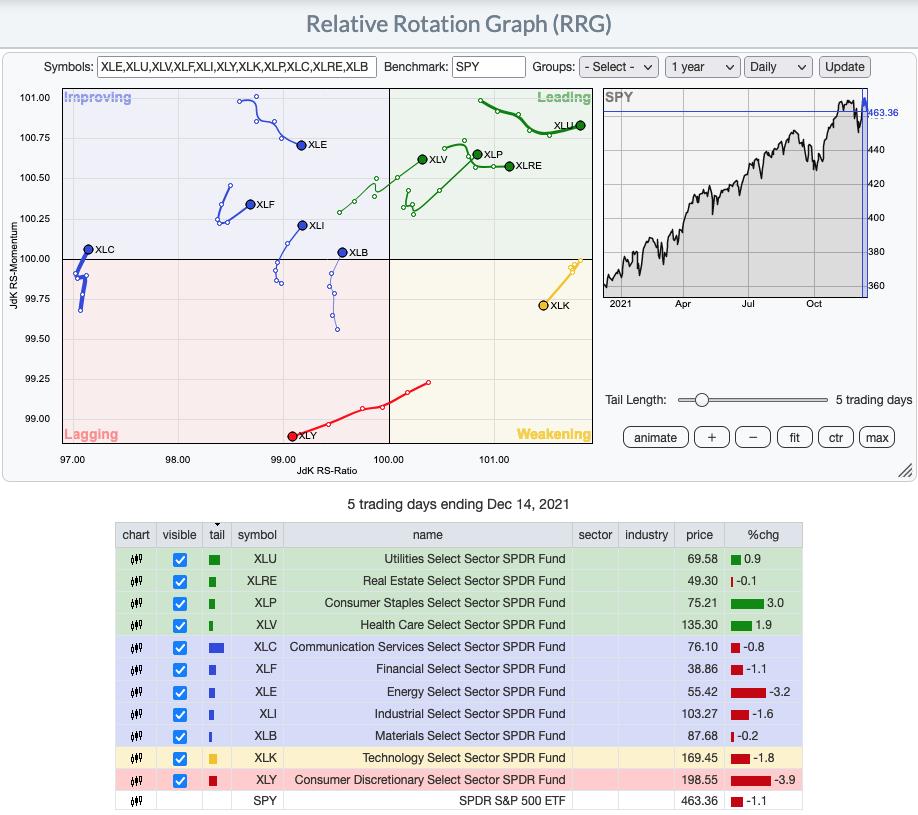
CLICK HERE for an animated version of the RRG chart.
CLICK HERE for Carl's annotated Sector charts.
THE MARKET (S&P 500)
IT Trend Model: BUY as of 10/18/2021
LT Trend Model: BUY as of 6/8/2020
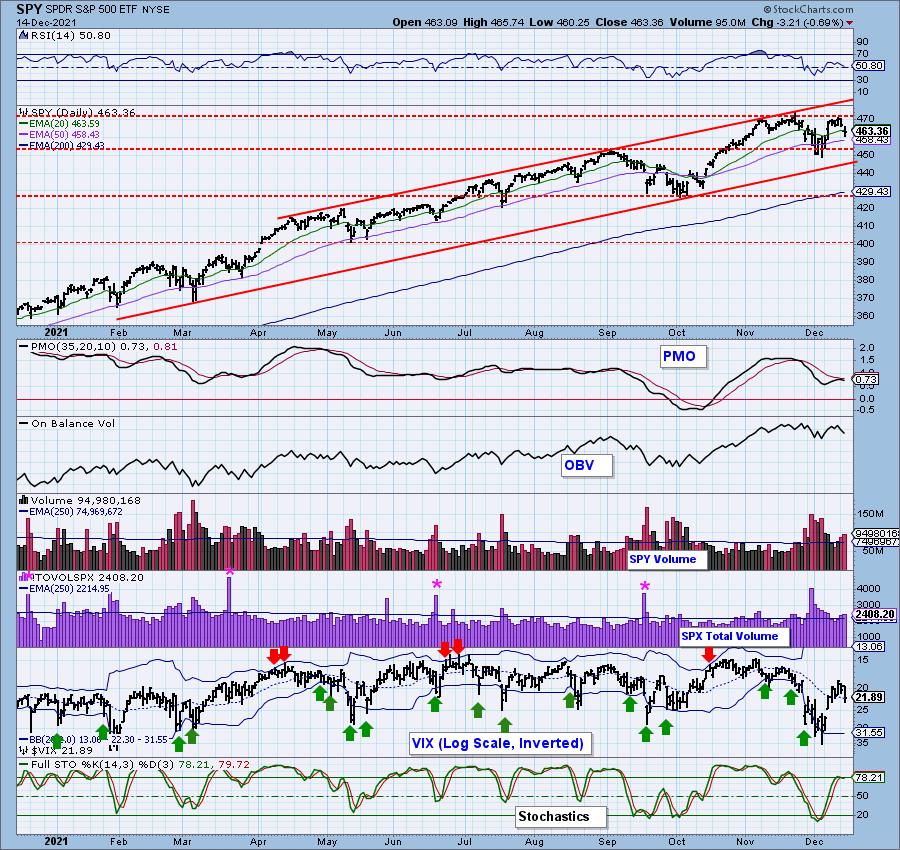
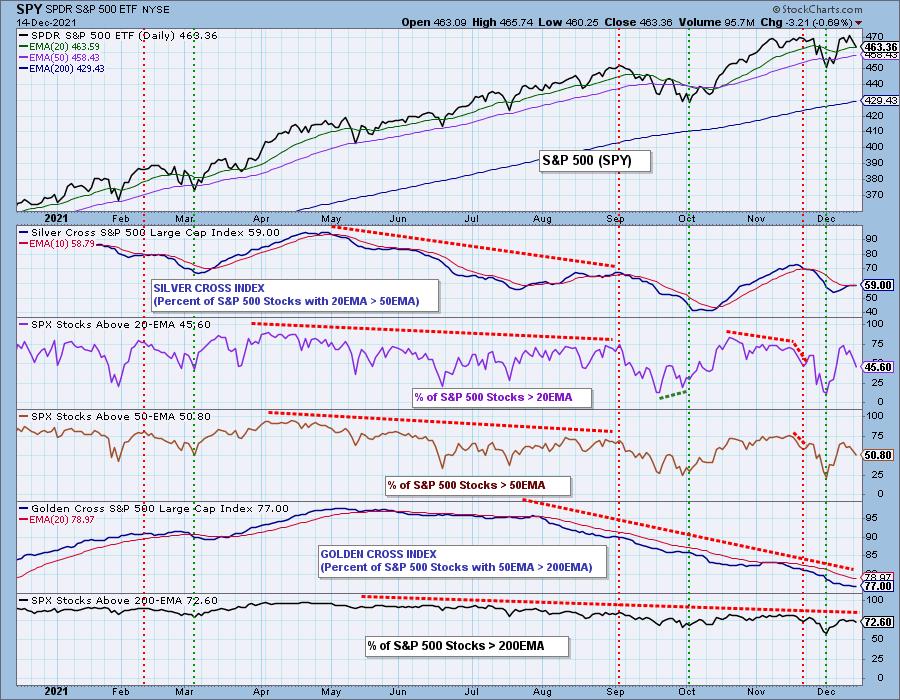
SPY Daily Chart: Price gapped down but did manage to close on the mid-November low. However, it did not close above the 20-EMA. The PMO has now topped below its signal line and the RSI is falling and almost in negative territory.
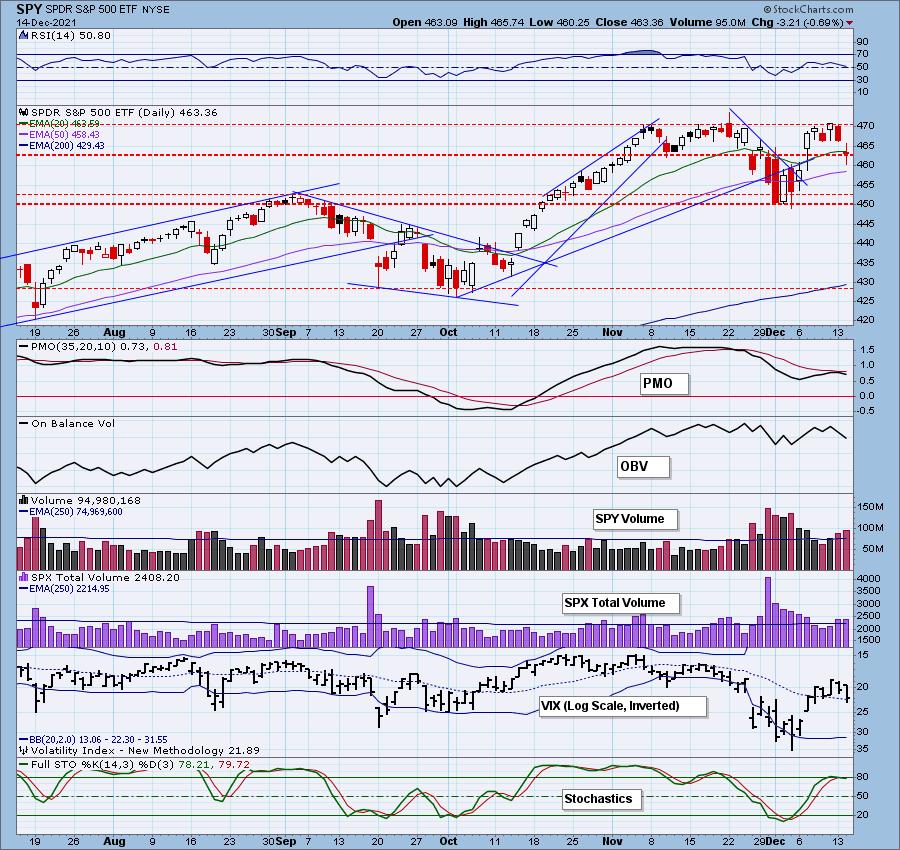
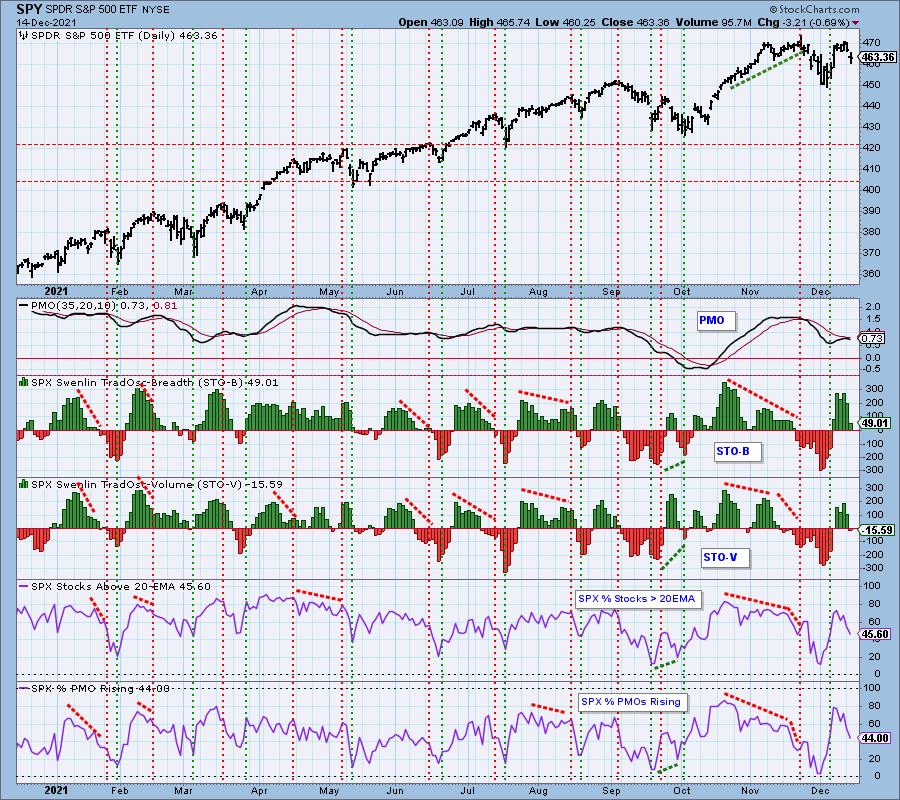
Price turned back before testing the top of the rising trend channel. That is bearish and suggests price will move even lower. The 50-EMA is available for support, but it seems more likely that we will see a test of the bottom of the channel.

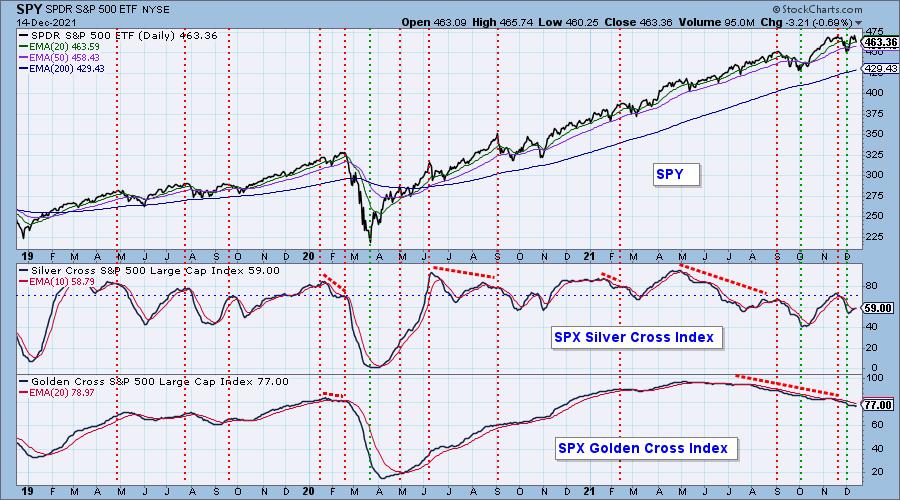
PARTICIPATION: The following chart objectively shows the depth and trend of participation in two time frames.
- Intermediate-Term - the Silver Cross Index (SCI) shows the percentage of SPX stocks on IT Trend Model BUY signals (20-EMA > 50-EMA). The opposite of the Silver Cross is a "Dark Cross" -- those stocks are, at the very least, in a correction.
- Long-Term - the Golden Cross Index (GCI) shows the percentage of SPX stocks on LT Trend Model BUY signals (50-EMA > 200-EMA). The opposite of a Golden Cross is the "Death Cross" -- those stocks are in a bear market.
The SCI had a positive crossover its signal line and is nearing a 60% reading which is still somewhat bullish. There is continued deterioration of the GCI. We shouldn't have seen so many stocks on "Death Crosses" given price was not that far from all-time highs.
S&P 500 New 52-Week Highs/Lows: New Highs contracted on today's decline. The 10-DMA of the High-Low Differential is still rising which is somewhat bullish for the intermediate term.
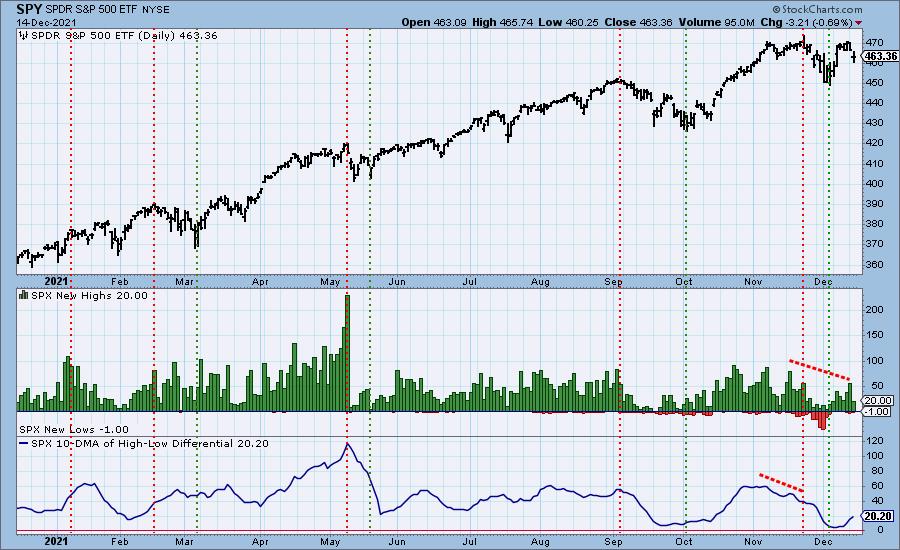
Climax* Analysis: Total Volume was elevated again on today's decline. This is the follow-through we've been expecting off Thursday and yesterday's downside initiation climaxes. The VIX has topped but is still above its moving average on our inverted scale. Investors aren't bearish enough.
*A climax is a one-day event when market action generates very high readings in, primarily, breadth and volume indicators. We also include the VIX, watching for it to penetrate outside the Bollinger Band envelope. The vertical dotted lines mark climax days -- red for downside climaxes, and green for upside. Climaxes indicate either initiation or exhaustion.
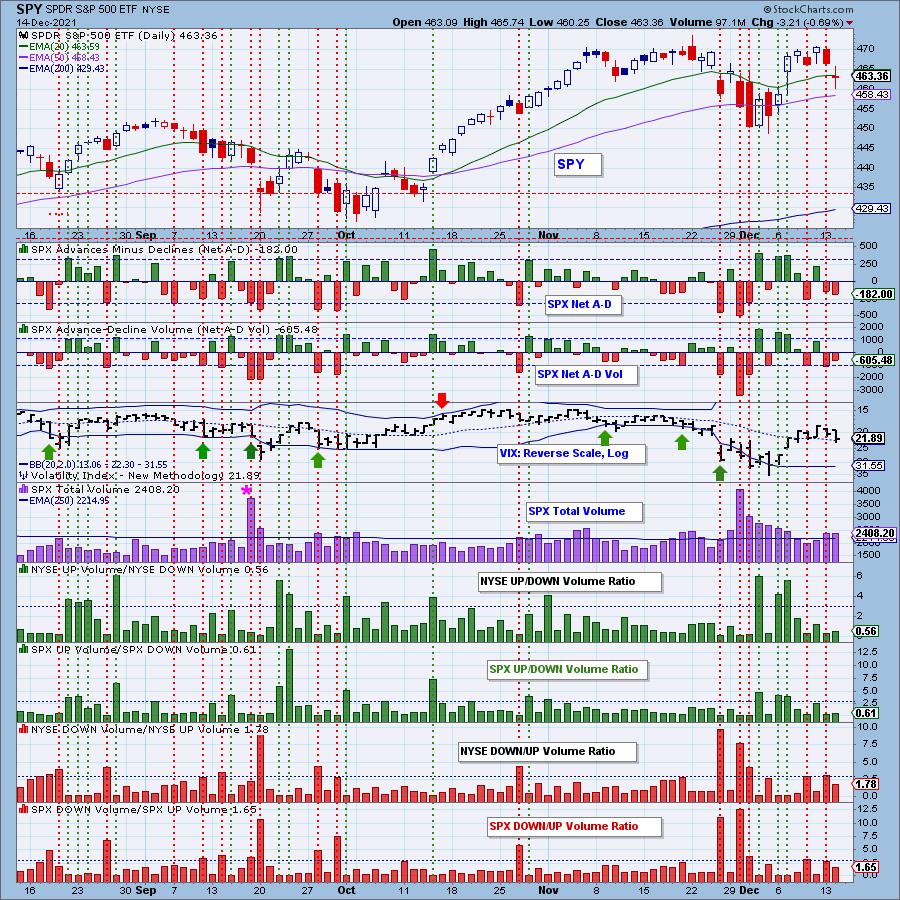
Short-Term Market Indicators: The short-term market trend is DOWN and the condition is NEUTRAL.
STOs pulled back considerably today but are only in neutral territory. They can accommodate much more downside before becoming oversold. Participation fell off a cliff and isn't oversold yet. This chart tells us there is more decline ahead.
Intermediate-Term Market Indicators: The intermediate-term market trend is UP and the condition is NEUTRAL.
IT indicators all turned down today suggesting the intermediate-term rising trend could be in jeopardy.
Bias Assessment: There is a strong bearish bias in the short term given %Stocks > 20/50-EMAs are below the SCI reading. The SCI is flat and hasn't turned down so I read this as neutral for the intermediate term, but I expect to see it top this week which would move the bias to bearish in the IT. As noted earlier, the long-term bias is neutral to bullish given the GCI still shows more than three quarters of the SPX have Golden Crosses. However, that bias will probably move bearish given %Stocks > 200-EMA is lower than the GCI reading.
CONCLUSION: Total volume has been above the annual average on two days of decline, but investors aren't bearish enough given the VIX is still above its EMA. Indicators in the short and intermediate terms are all declining which tells me to expect more decline. Tomorrow Fed Chairman Powell will make the announcement regarding today's Fed Meeting. The fear we have heard expressed is that the Fed may become more hawkish than expected, but the market may react up or down in a big way no matter what Powell says. Volatility is generally a problem when we get any announcement from the Fed. Be alert.
I am 10% exposed to the market.
Have you subscribed the DecisionPoint Diamonds yet? DP does the work for you by providing handpicked stocks/ETFs from exclusive DP scans! Add it with a discount! Contact support@decisionpoint.com for more information!
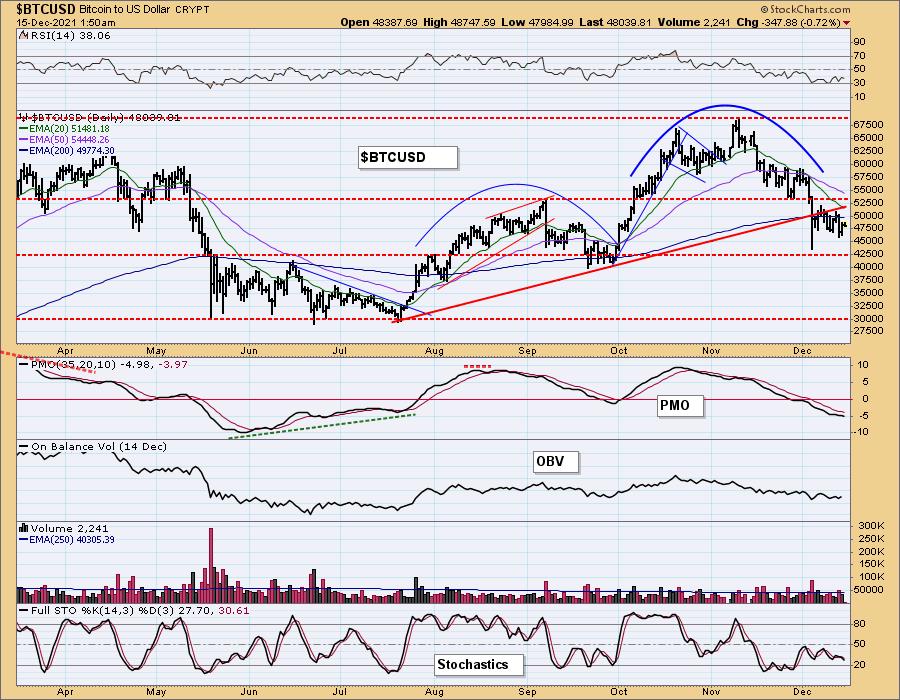
BITCOIN
Bitcoin reversed today but it didn't accomplish much. The short-term declining trend is still intact and the PMO and Stochastics are still falling.
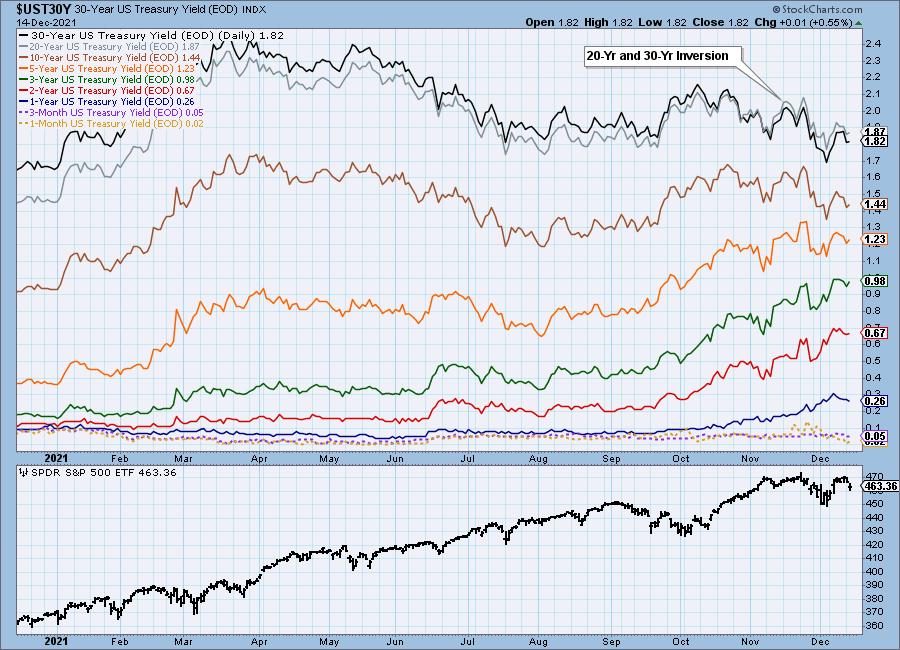
INTEREST RATES
Rates paused today after experiencing sharp drops in the last week.
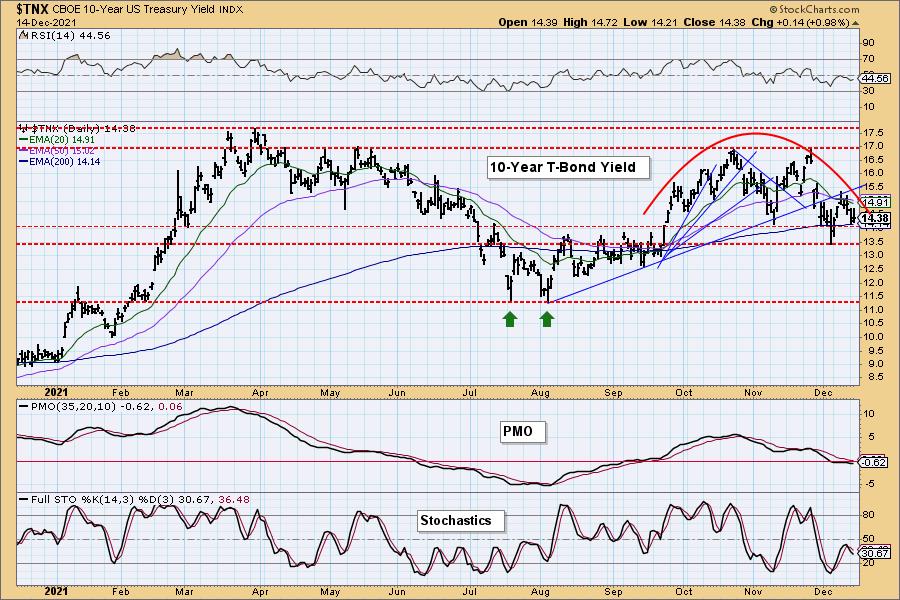
10-YEAR T-BOND YIELD
The 10-year yield was higher by about one basis point. It didn't really change the chart much as we still have a rounded top and negative indicators.
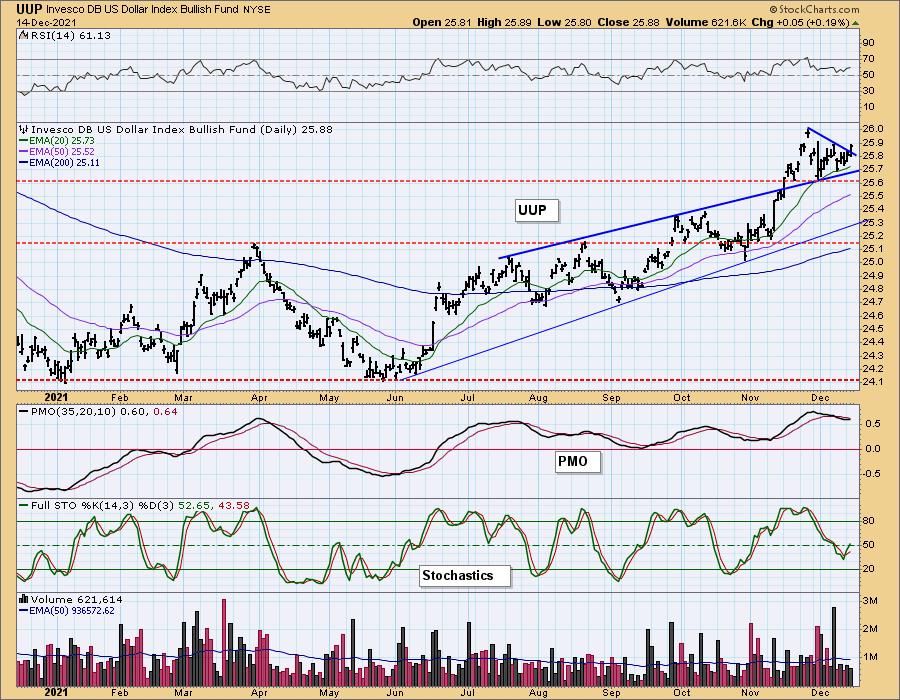
DOLLAR (UUP)
IT Trend Model: BUY as of 6/22/2021
LT Trend Model: BUY as of 8/19/2021
UUP Daily Chart: The Dollar broke out of the short-term symmetrical triangle. This was expected given there was a rising trend preceding the triangle and these are continuation patterns. Stochastics are improving, but the PMO remains flat.
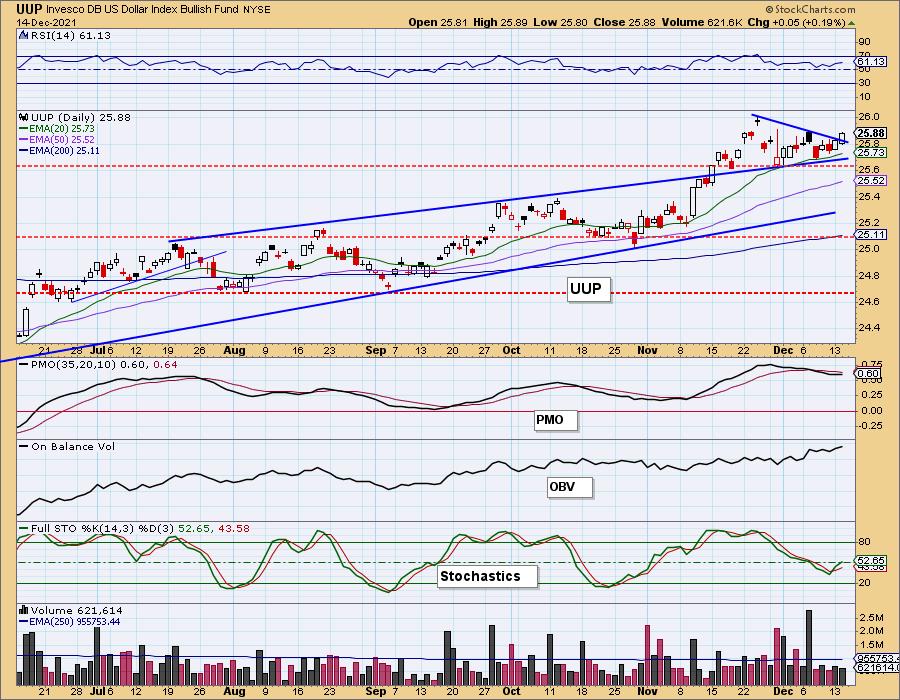
This breakout from the pennant on the flagpole suggests the Dollar will rise even further.
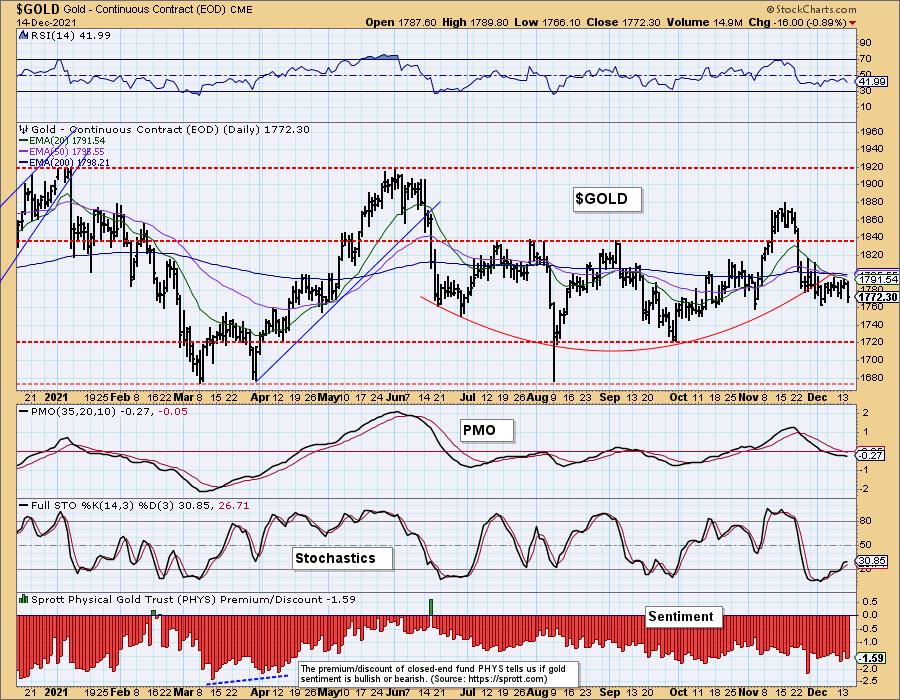
GOLD
IT Trend Model: SELL as of 12/7/2021
LT Trend Model: SELL as of 12/3/2021
GLD Daily Chart: Gold gapped down today. The short-term rising trend was broken, but support is still holding at $165 for GLD. The PMO is now falling and the RSI is falling in negative territory. Stochastics are technically rising, but could turn down in negative territory if price moves lower.
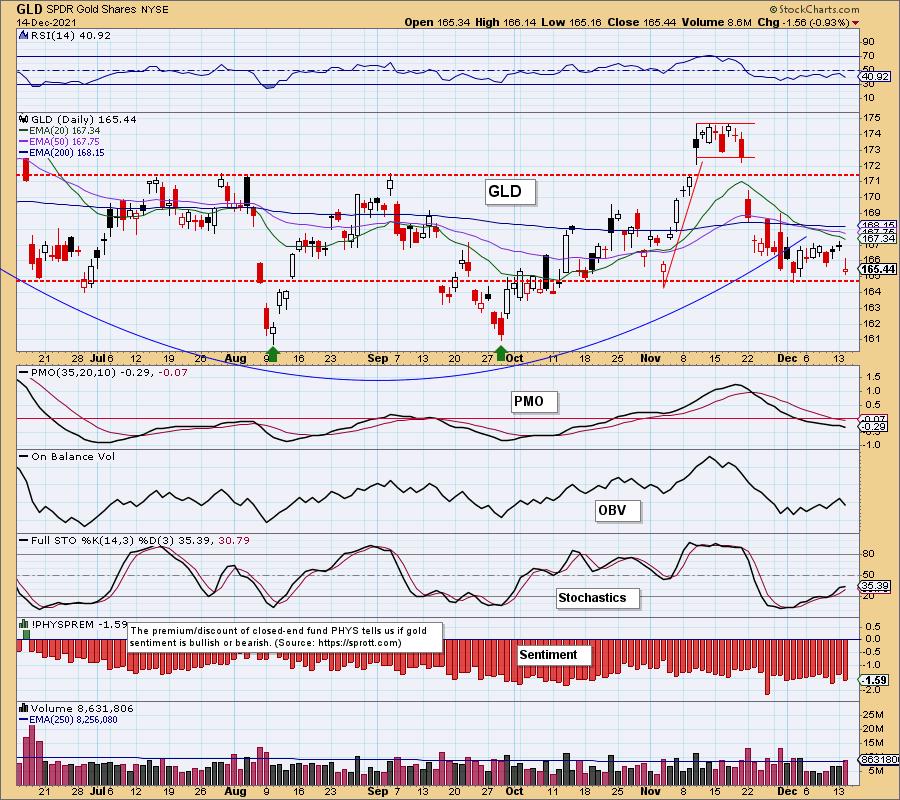
GOLD Daily Chart: Discounts are high telling us that investors are still bearish on Gold. However, we've seen much deeper discounts so we need sentiment to get even more bearish. The support level at this month's low is very vulnerable.
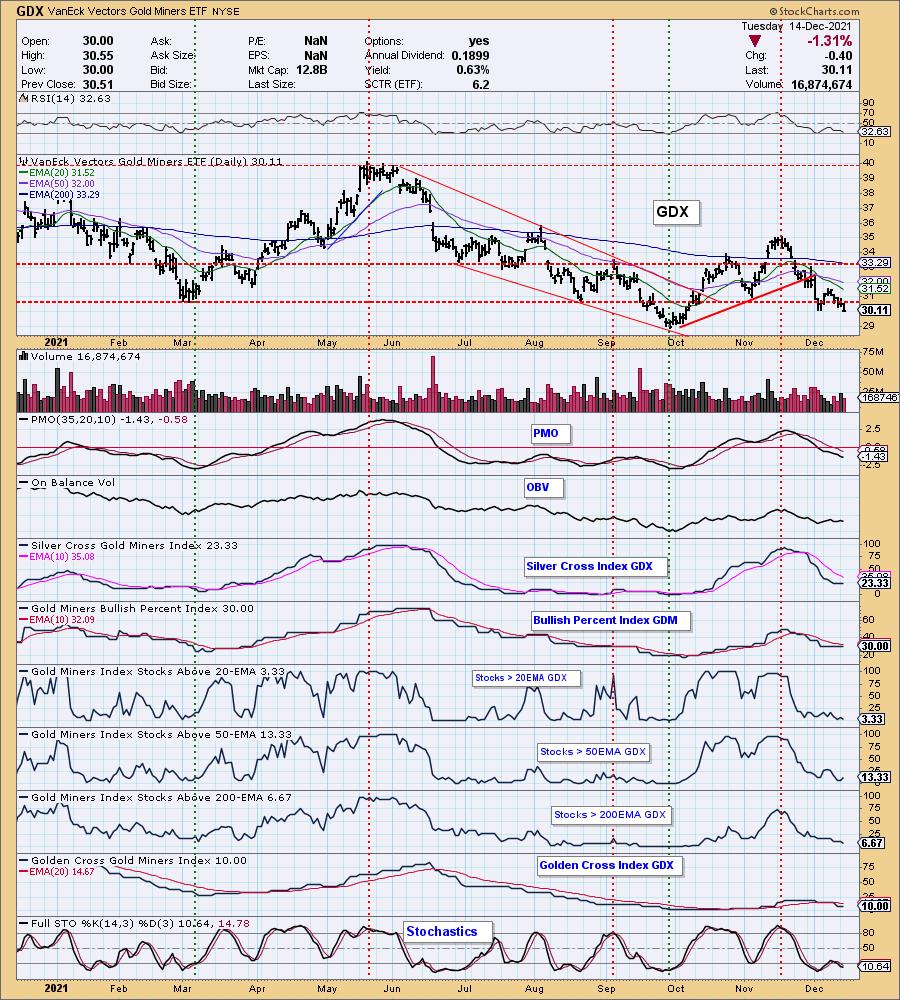
GOLD MINERS Golden and Silver Cross Indexes: With the drop in Gold, it wasn't surprising to see a breakdown. Support at this month's low did hold, but given the anemic participation numbers, dropping Stochastics, negative RSI and falling PMO, we should consider $29 as the next stop for GDX.
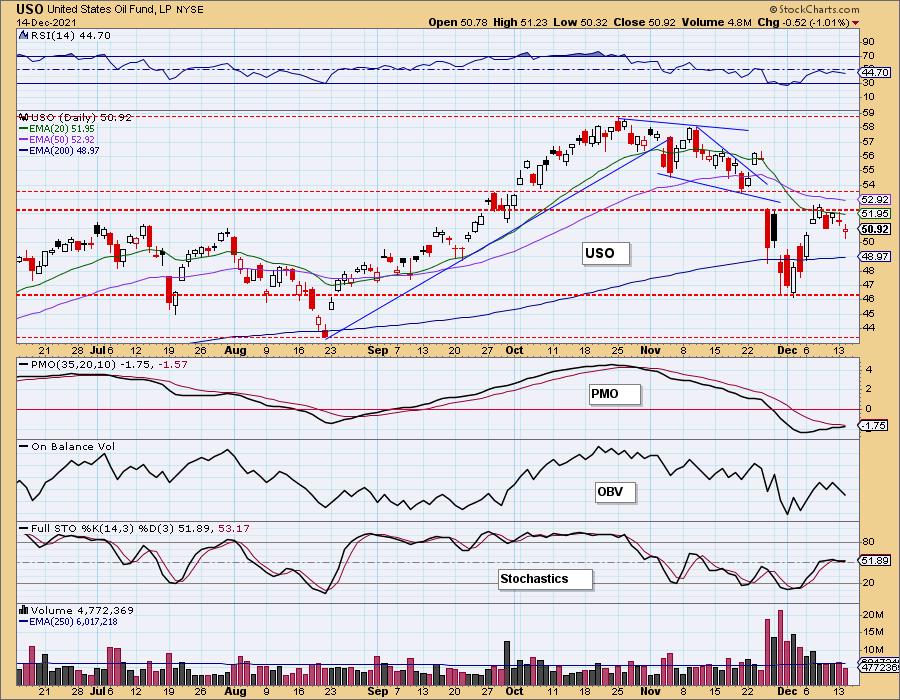
CRUDE OIL (USO)
IT Trend Model: NEUTRAL as of 11/30/2021
LT Trend Model: BUY as of 3/9/2021
USO Daily Chart: Crude Oil has formed a bullish flag formation. Price still has layers of resistance at the 20-EMA, gap resistance and the 50-EMA to contend with. The indicators aren't too helpful as they are flat. The RSI is negative, but the PMO is still working toward a crossover BUY signal. My sense is that USO will test the 200-EMA before it reverses higher.
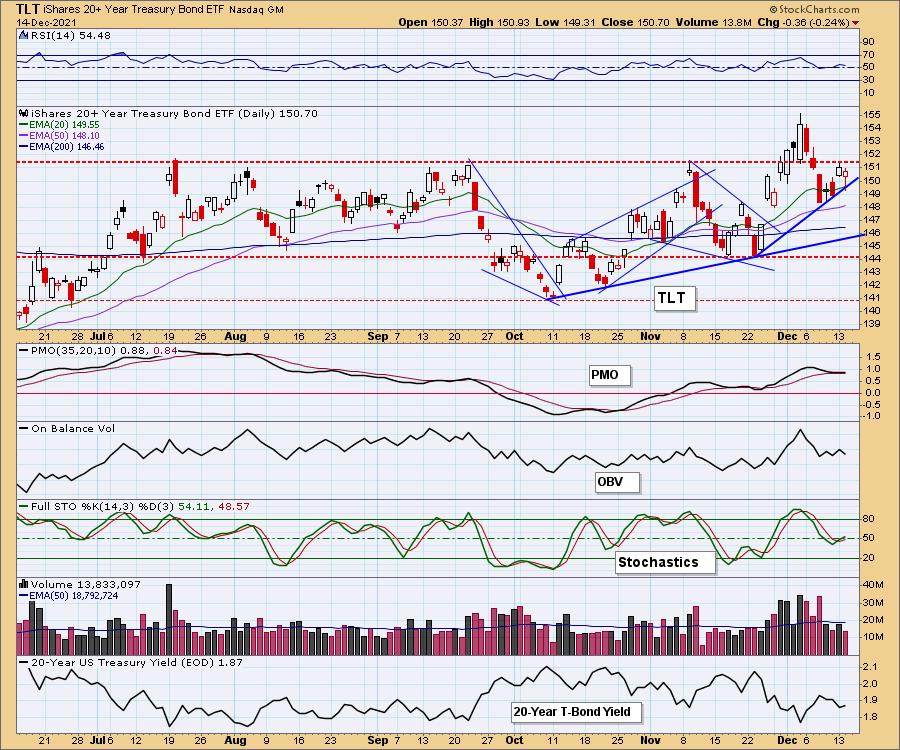
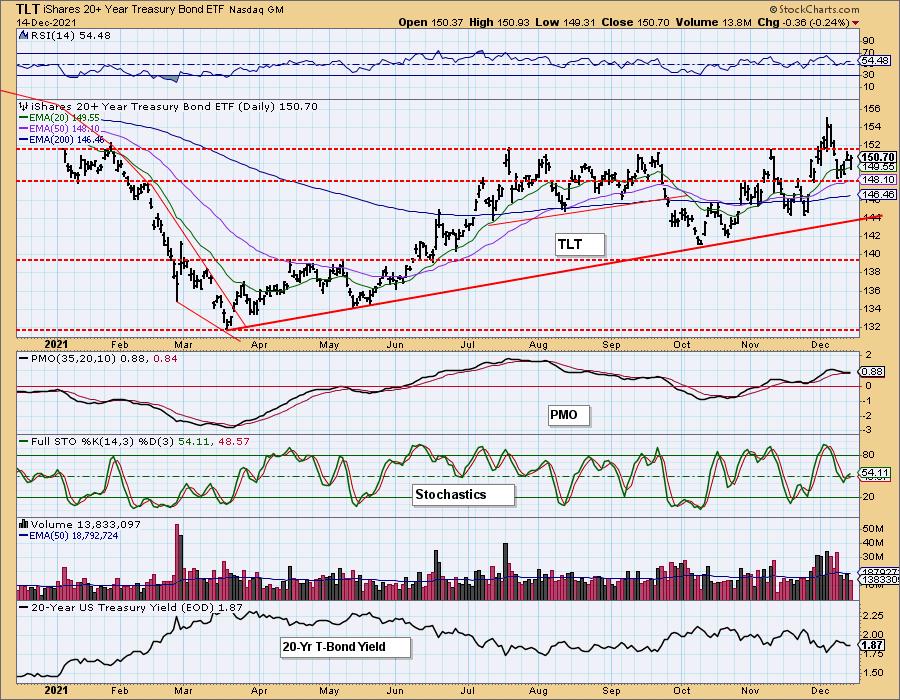
BONDS (TLT)
IT Trend Model: BUY as of 11/8/2021
LT Trend Model: BUY as of 11/5/2021
TLT Daily Chart: TLT didn't benefit from the market decline, but the short-term rising trend is still intact and price is above the 20-EMA. The RSI is positive and the PMO has avoided a crossover SELL signal (so far). Stochastics are rising again. Given this has been a hideout when the market is weak, I expect to see Bonds rise. Of course, the Fed is talking "tightening", meaning higher interest rates, so upside potential is limited.
Technical Analysis is a windsock, not a crystal ball.
--Erin Swenlin
(c) Copyright 2021 DecisionPoint.com
Disclaimer: This blog is for educational purposes only and should not be construed as financial advice. The ideas and strategies should never be used without first assessing your own personal and financial situation, or without consulting a financial professional. Any opinions expressed herein are solely those of the author, and do not in any way represent the views or opinions of any other person or entity.
NOTE: The signal status reported herein is based upon mechanical trading model signals, specifically, the DecisionPoint Trend Model. They define the implied bias of the price index based upon moving average relationships, but they do not necessarily call for a specific action. They are information flags that should prompt chart review. Further, they do not call for continuous buying or selling during the life of the signal. For example, a BUY signal will probably (but not necessarily) return the best results if action is taken soon after the signal is generated. Additional opportunities for buying may be found as price zigzags higher, but the trader must look for optimum entry points. Conversely, exit points to preserve gains (or minimize losses) may be evident before the model mechanically closes the signal.
Helpful DecisionPoint Links:
DecisionPoint Alert Chart List
DecisionPoint Golden Cross/Silver Cross Index Chart List
DecisionPoint Sector Chart List
Price Momentum Oscillator (PMO)
Swenlin Trading Oscillators (STO-B and STO-V)
DecisionPoint is not a registered investment advisor. Investment and trading decisions are solely your responsibility. DecisionPoint newsletters, blogs or website materials should NOT be interpreted as a recommendation or solicitation to buy or sell any security or to take any specific action.