
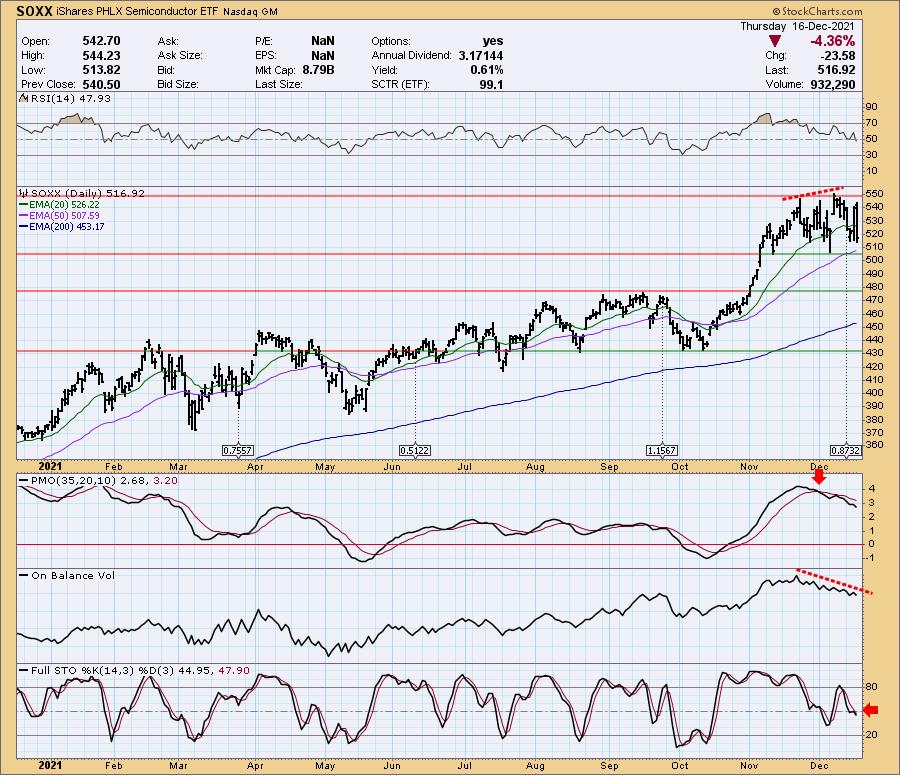
This morning I recorded "The Pitch" for StockChartsTV alongside TG Watkins, Joe Tentarelli with host, David Keller. Pre-show we all chatted about the market as they sized up our video and prepared to record. I love an opportunity to talk to other analysts about the market! Dad is great, but we think too much alike sometimes. David Keller gasped briefly and mentioned the decimation of Semiconductors which were only down about 3% at the time.
The SOXX ended up closing down -4.36%! The chart was already going south, but today's decline pushed the RSI out of positive territory. The PMO has now had its second top below the signal line. Just one of those is especially bearish. There is an OBV negative divergence and Stochastics are in negative territory and falling. There is still hope. Support will arrive at the 50-EMA and November/December lows; however, given the very negative indicators, I'm not so sure that will hold up.
The DecisionPoint Alert Weekly Wrap presents an end-of-week assessment of the trend and condition of the Stock Market, the U.S. Dollar, Gold, Crude Oil, and Bonds. The DecisionPoint Alert daily report (Monday through Thursday) is abbreviated and gives updates on the Weekly Wrap assessments.
Watch the latest episode of DecisionPoint on StockCharts TV's YouTube channel here!
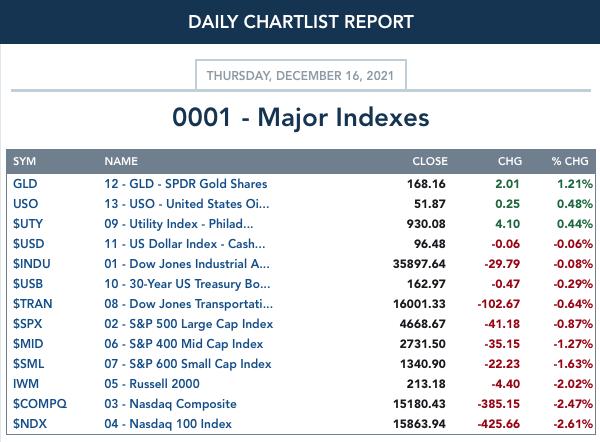
MAJOR MARKET INDEXES
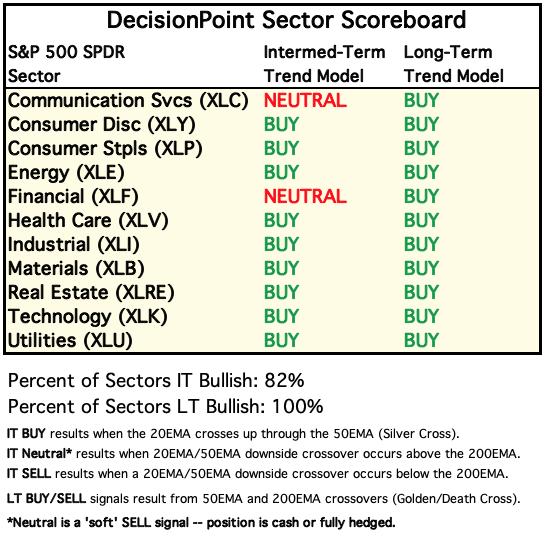
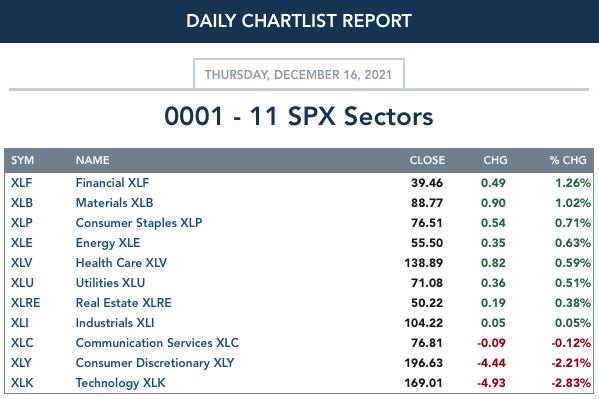
SECTORS
Each S&P 500 Index component stock is assigned to one, and only one, of 11 major sectors. This is a snapshot of the Intermediate-Term (Silver Cross) and Long-Term (Golden Cross) Trend Model signal status for those sectors.
RRG® Chart: Yesterday's comments still apply:
"Defensive sectors still rule the school as they continue to rotate within the Leading quadrant. XLK and XLY are the most bearish as far as relative strength to the SPY with both traveling in the bearish southwest direction. XLC has come back to life, but still has some ground to make up. XLE is moving southward toward Lagging. The remainder all look healthy sitting in Improving."
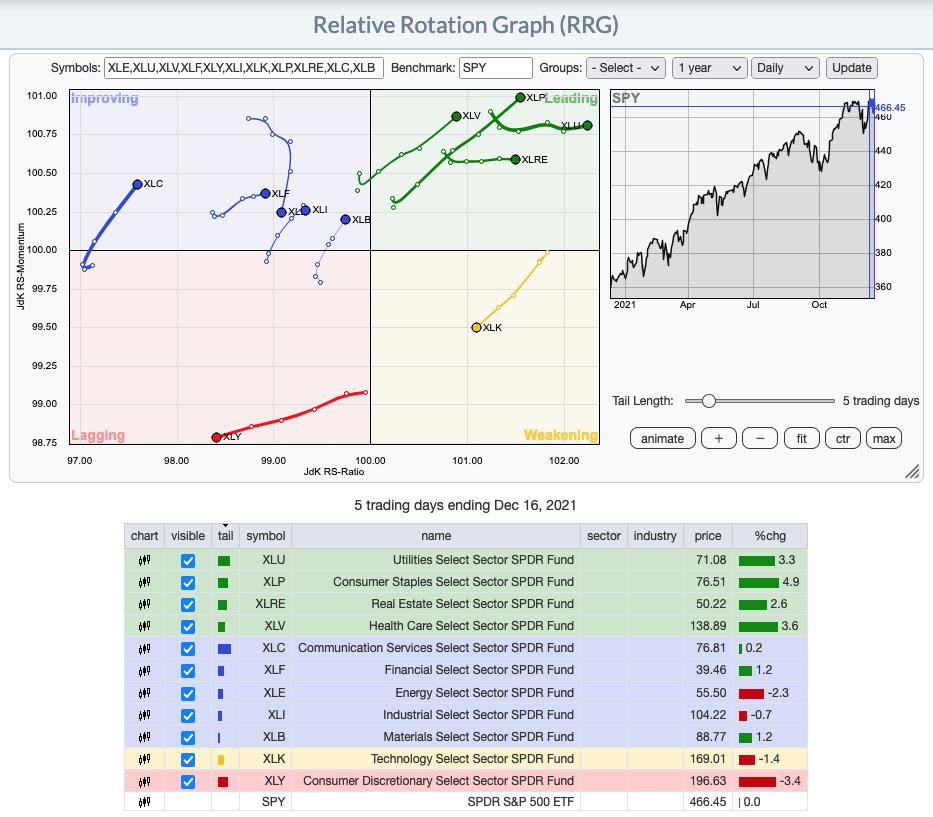
RRG® charts show you the relative strength and momentum for a group of stocks. Stocks with strong relative strength and momentum appear in the green Leading quadrant. As relative momentum fades, they typically move into the yellow Weakening quadrant. If relative strength then fades, they move into the red Lagging quadrant. Finally, when momentum starts to pick up again, they shift into the blue Improving quadrant.
CLICK HERE for an animated version of the RRG chart.
CLICK HERE for Carl's annotated Sector charts.
THE MARKET (S&P 500)
IT Trend Model: BUY as of 10/18/2021
LT Trend Model: BUY as of 6/8/2020
SPY Daily Chart: New intraday all-time highs were set today before the market tanked to finish down -0.88%. The PMO which had been sizing up a crossover BUY signal, turned down. This gives us a second top below the signal line which is especially bearish.
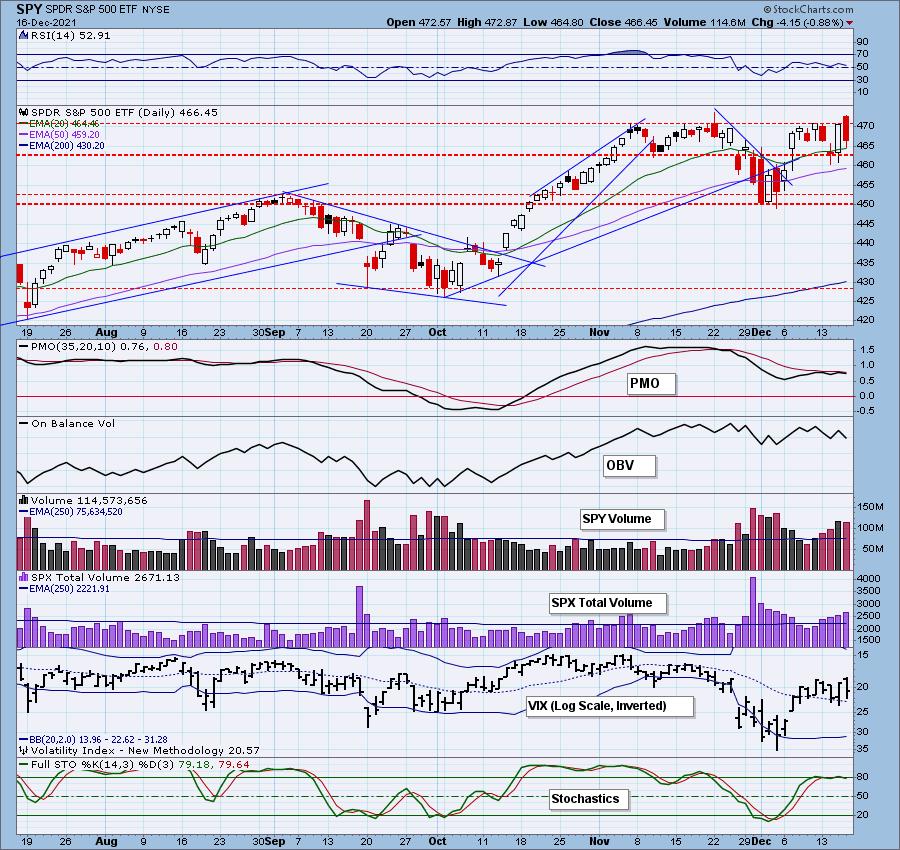
The RSI is still positive. Stochastics turned down slightly. Total Volume was very high and the VIX reading rose telling us investors did nervous selling. Still the VIX remains above its SMA on the inverted scale which is somewhat positive overall.
 Click here to register!DON'T DELAY! IT'S FREE!
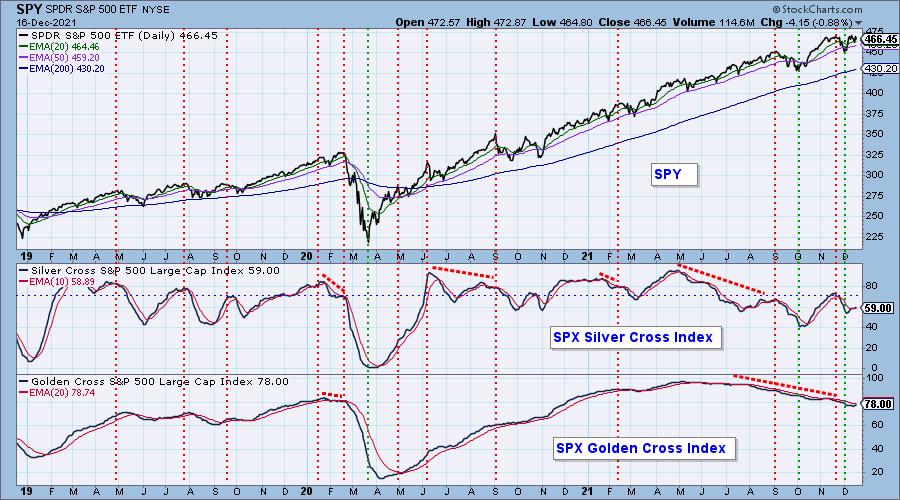
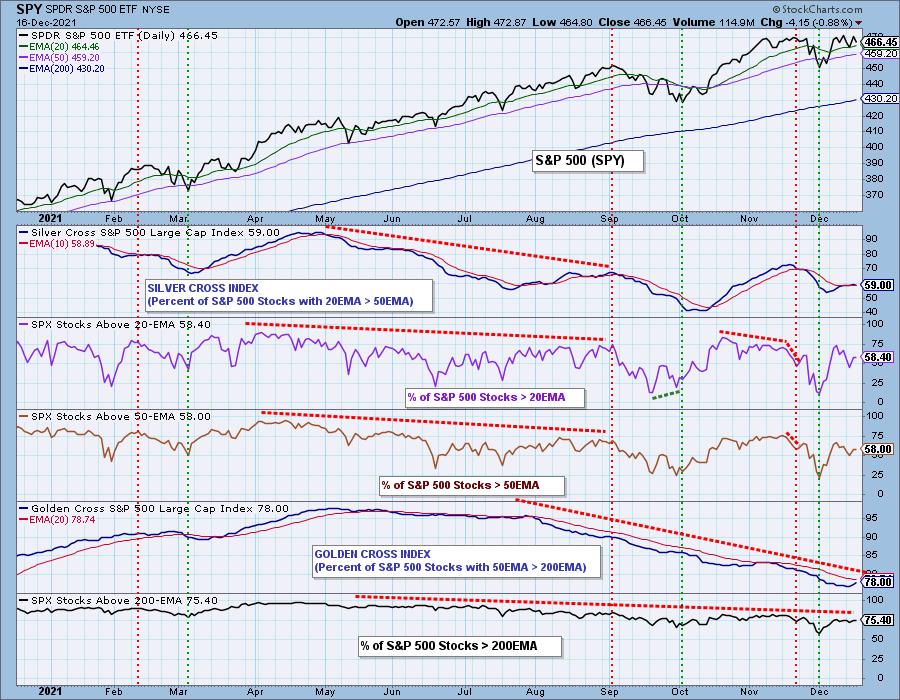
PARTICIPATION: The following chart objectively shows the depth and trend of participation in two time frames.
- Intermediate-Term - the Silver Cross Index (SCI) shows the percentage of SPX stocks on IT Trend Model BUY signals (20-EMA > 50-EMA). The opposite of the Silver Cross is a "Dark Cross" -- those stocks are, at the very least, in a correction.
- Long-Term - the Golden Cross Index (GCI) shows the percentage of SPX stocks on LT Trend Model BUY signals (50-EMA > 200-EMA). The opposite of a Golden Cross is the "Death Cross" -- those stocks are in a bear market.
The SCI tipped over slightly but remains above its signal line. The GCI which ticked up yesterday, continues to rise toward its signal line. 41% of the SPX are correcting based on the SCI. I expect to see more.
S&P 500 New 52-Week Highs/Lows: New Highs expanded greatly, but remember this is an intraday reading. More than likely most of those New Highs were lost by day's end.
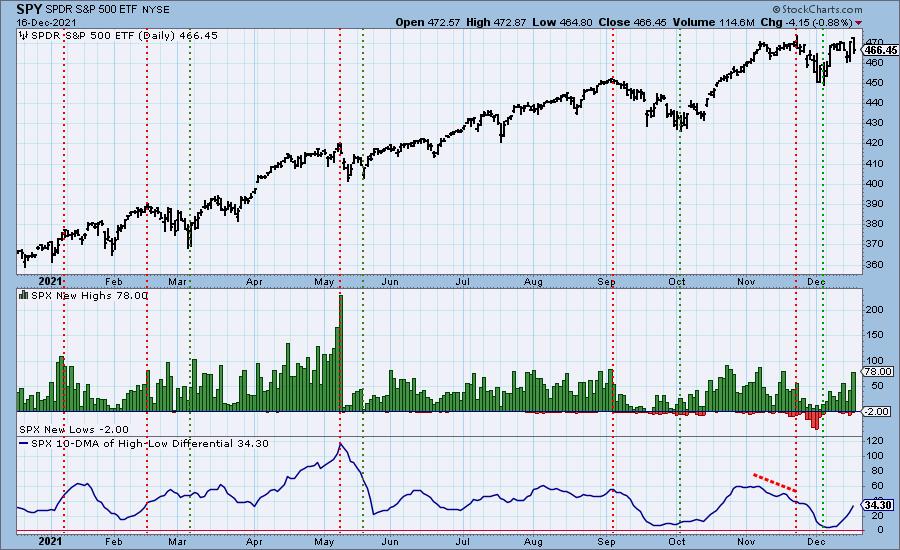
Climax* Analysis: We decided that yesterday's climax was an upside initiation, but there was little follow through today, then prices reversed downward. This makes yesterday's climax look more like an upside exhaustion. Today there was only high SPX Total Volume. Breadth didn't confirm a climax and Volume Ratios didn't even come close.
*A climax is a one-day event when market action generates very high readings in, primarily, breadth and volume indicators. We also include the VIX, watching for it to penetrate outside the Bollinger Band envelope. The vertical dotted lines mark climax days -- red for downside climaxes, and green for upside. Climaxes indicate either initiation or exhaustion.
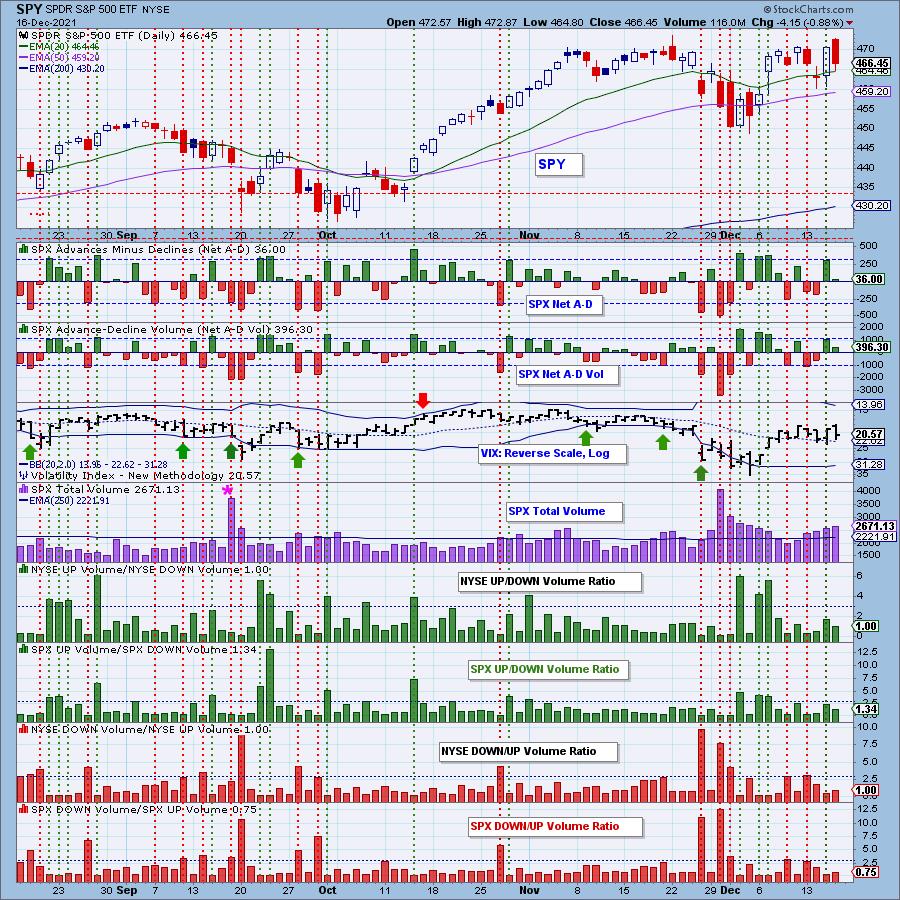
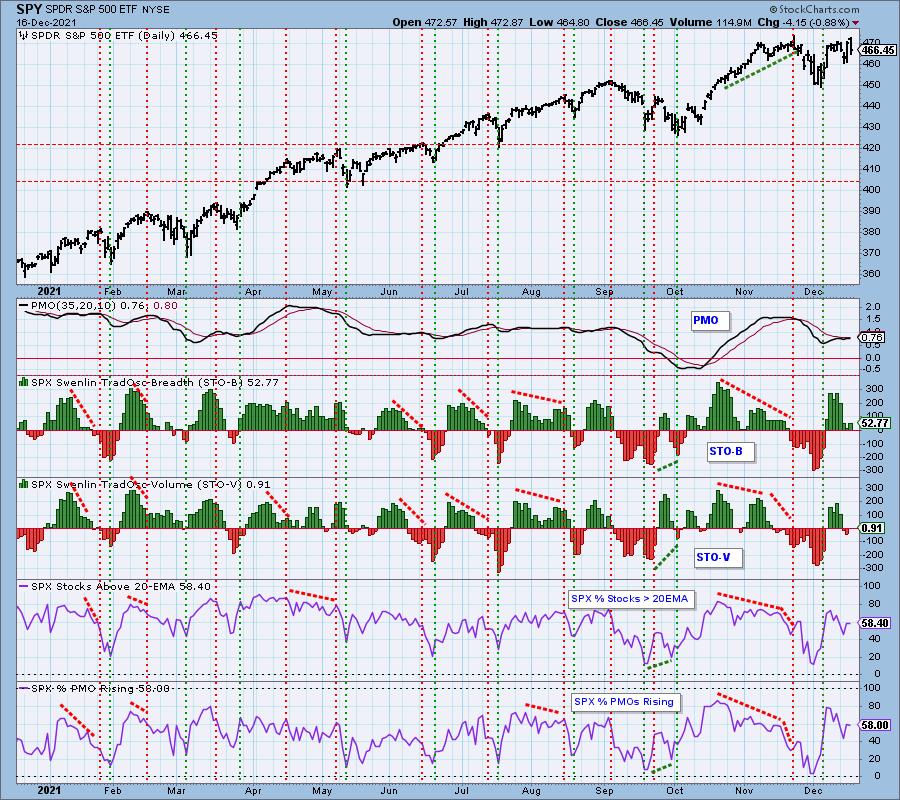
Short-Term Market Indicators: The short-term market trend is UP and the condition is NEUTRAL.
STOs were mixed today with the STO-B rising and the STO-V falling. Participation of stocks > 20-EMA was flat. We saw slightly fewer stocks with rising momentum. Both indicators are in a declining trend.
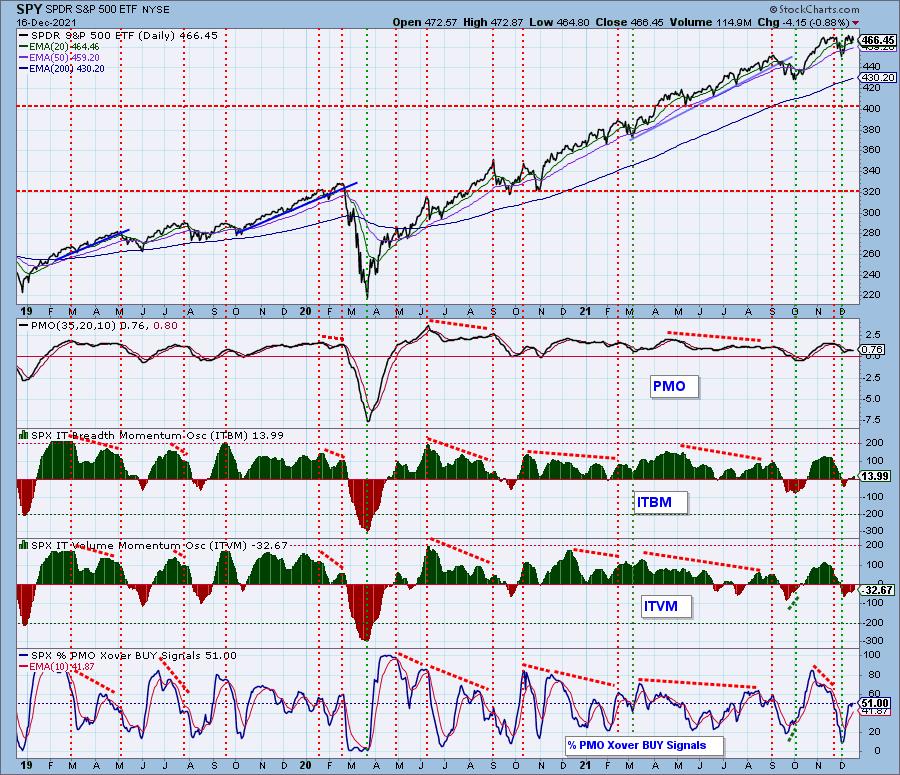
Intermediate-Term Market Indicators: The intermediate-term market trend is UP and the condition is NEUTRAL.
The ITBM/ITVM are rising which is positive, but they are in no man's land, neutral territory. Only half of the SPX have PMO BUY signals, but given 58% have rising PMOs there is some underlying improvement in momentum, but not enough to be meaningful right now.
Bias Assessment: Yesterday's comments still apply:
"The bias is mostly neutral in all three timeframes. %Stocks > 20/50-EMAs are only slightly below the 59.2% SCI reading and %Stocks > 200-EMA is slightly lower than the GCI. Given all of these indicators are rising, it's more on the bullish side of neutral."
CONCLUSION: Overall, the market is weak or at best "neutral" based on the indicators. Remember that options expiration is tomorrow. We normally expect low volatility on Thursday and Friday of an option expiration week, but today's market action puts the plug in that jug. We also expect very high volume on Friday (end-of-quarter expiration), but tomorrow's high volume could easily be a mix of expiration and heavy selling. We shall see.
I am considering some high yield positions in the Consumer Staples sector as adds to my portfolio tomorrow or Monday. Currently I am 10% exposed to the market.
Have you subscribed the DecisionPoint Diamonds yet? DP does the work for you by providing handpicked stocks/ETFs from exclusive DP scans! Add it with a discount! Contact support@decisionpoint.com for more information!
BITCOIN
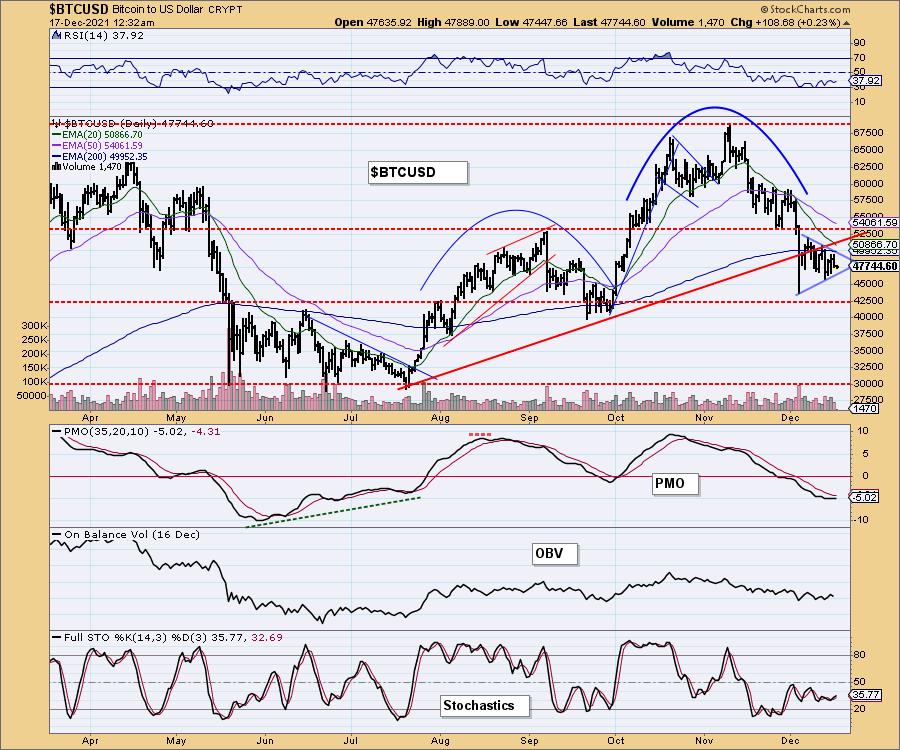
Bitcoin is still in a short-term declining trend despite rallying this week. There is a symmetrical triangle or pennant. These are continuation patterns so expect Bitcoin to move lower. Indicators are trying to improve, but not enough to get bullish here.
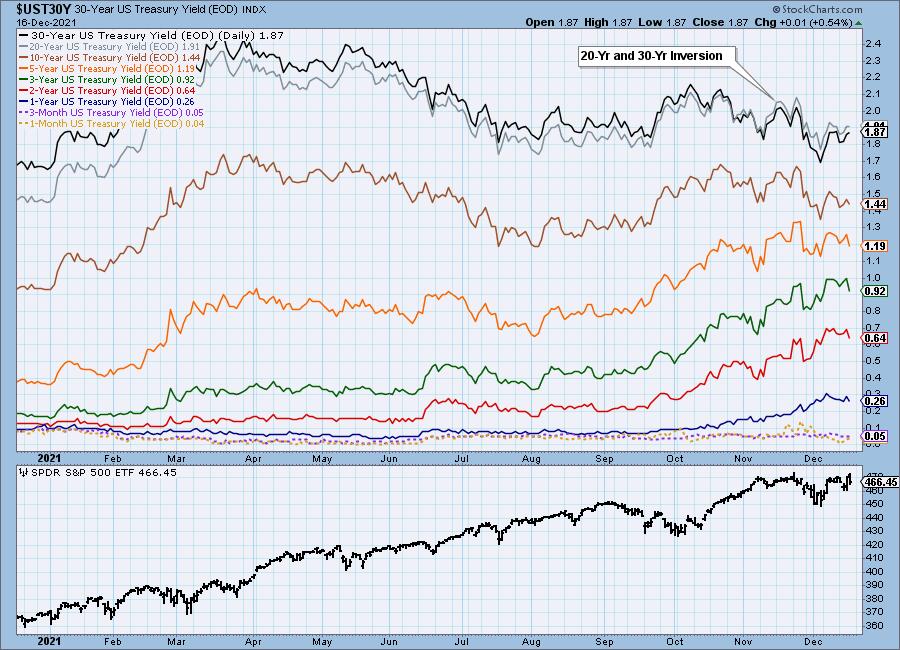
INTEREST RATES
Shorter-term yields fell today, but longer-term yields were mostly unchanged.
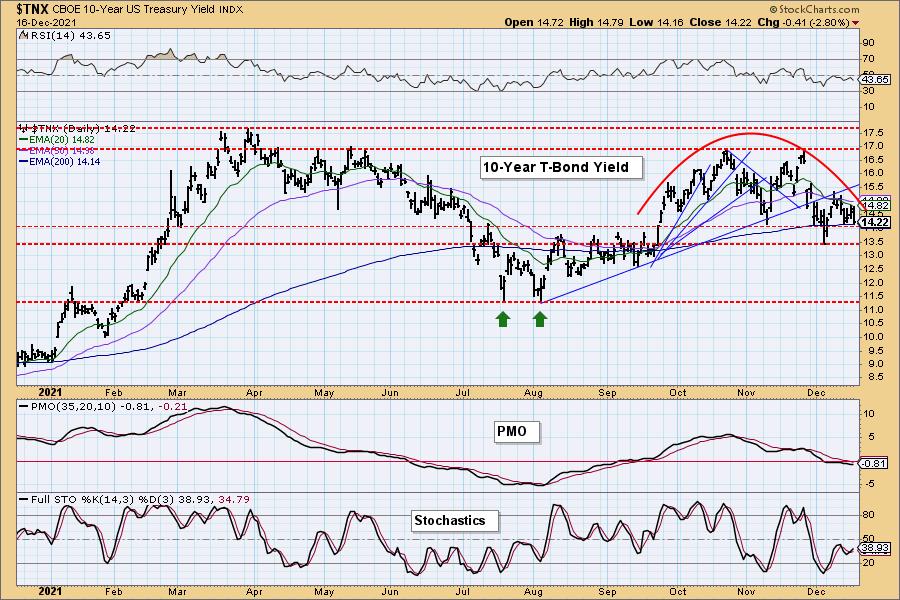
10-YEAR T-BOND YIELD
The 10-year yield took back yesterday's gains and then some as rates fell almost three basis points. Still, support is being held and Stochastics are turning back up. The PMO is flat and Stochastics are hovering in negative territory below net neutral (50).
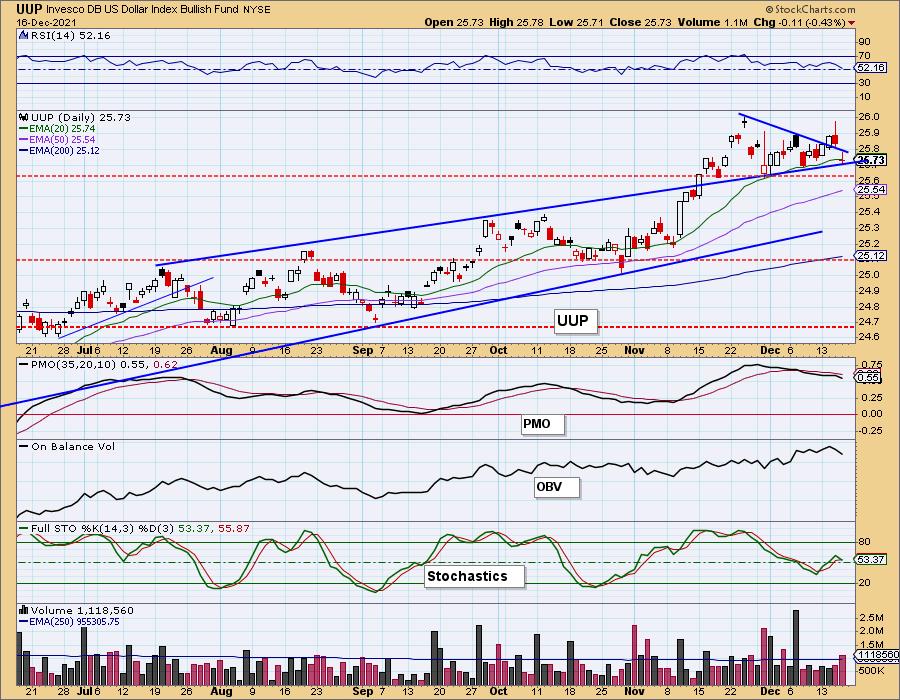
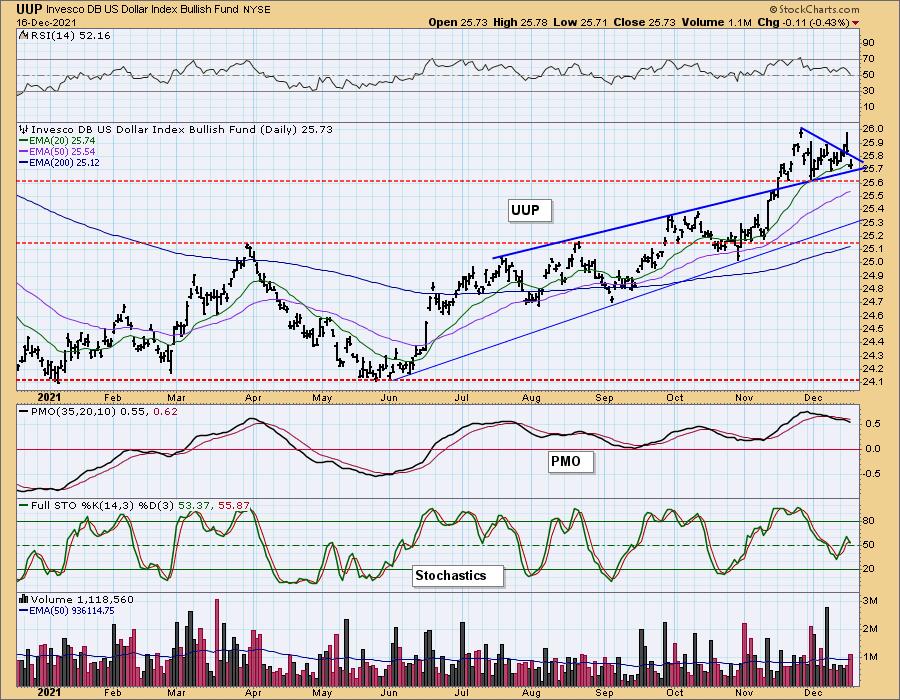
DOLLAR (UUP)
IT Trend Model: BUY as of 6/22/2021
LT Trend Model: BUY as of 8/19/2021
UUP Daily Chart: The Dollar pulled back to the 20-EMA and the top of the bearish rising wedge. The indicators are looking negative with a PMO accelerating lower and Stochastics turning over. The RSI is positive, but losing ground. Overall we would expect more consolidation between $25.65 and $26.00.
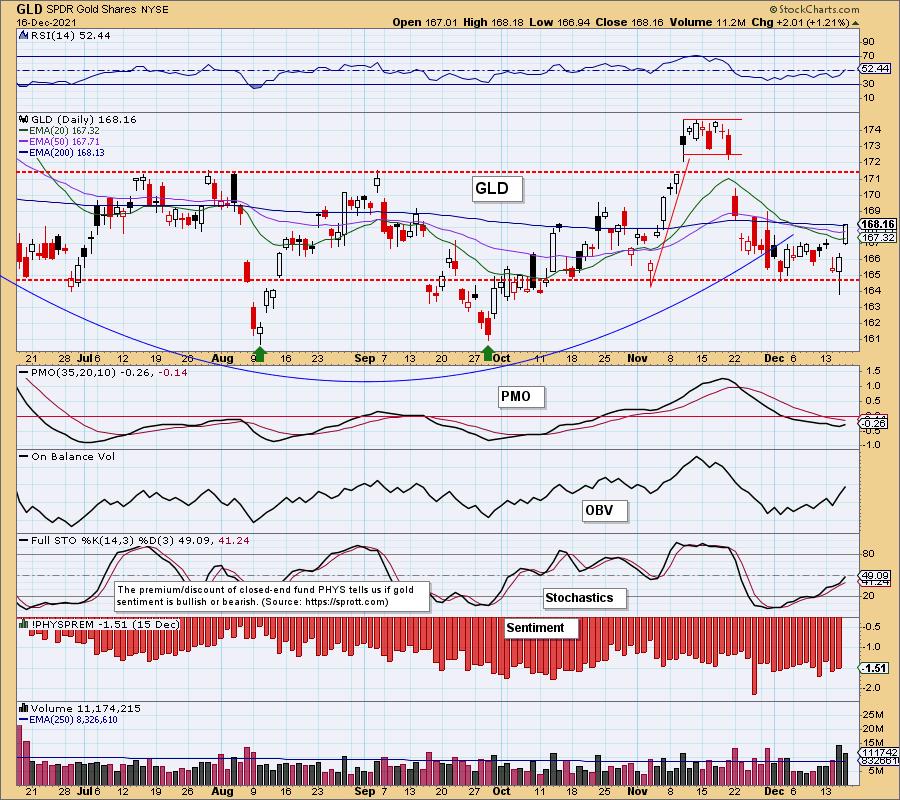
GOLD
IT Trend Model: SELL as of 12/7/2021
LT Trend Model: SELL as of 12/3/2021
GLD Daily Chart: Yesterday's bullish engulfing candle played out with a strong thrust upward. Finally we are seeing improving indicators. The 200-EMA did hold as overhead resistance, but with the indicators rising, we should see an upside breakout.
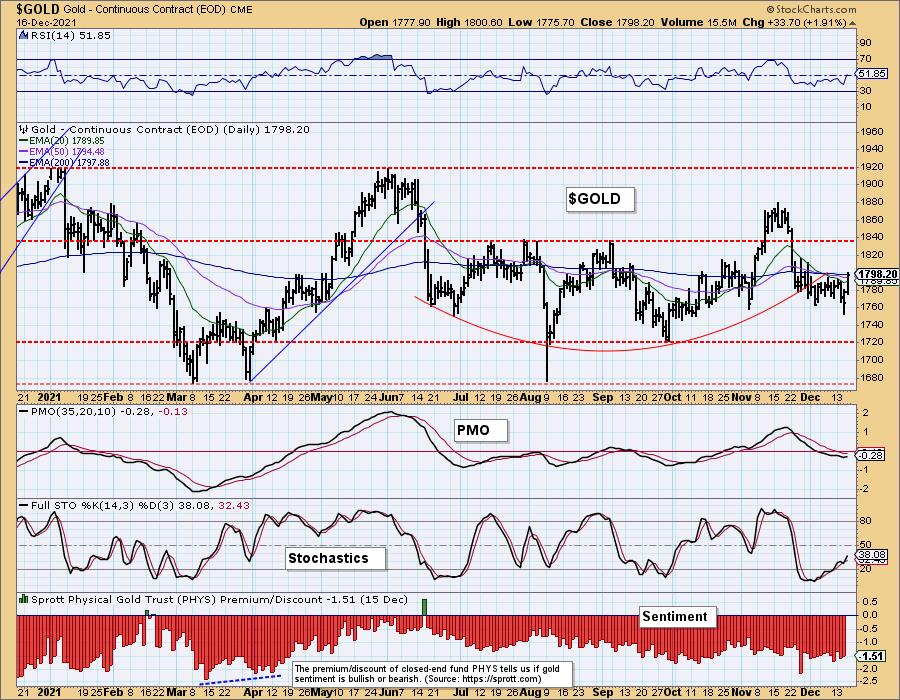
GOLD Daily Chart: $Gold closed above all three key moving averages. It should hold above based on rising Stochastics and a newly positive RSI. The PMO bottoming is also encouraging.
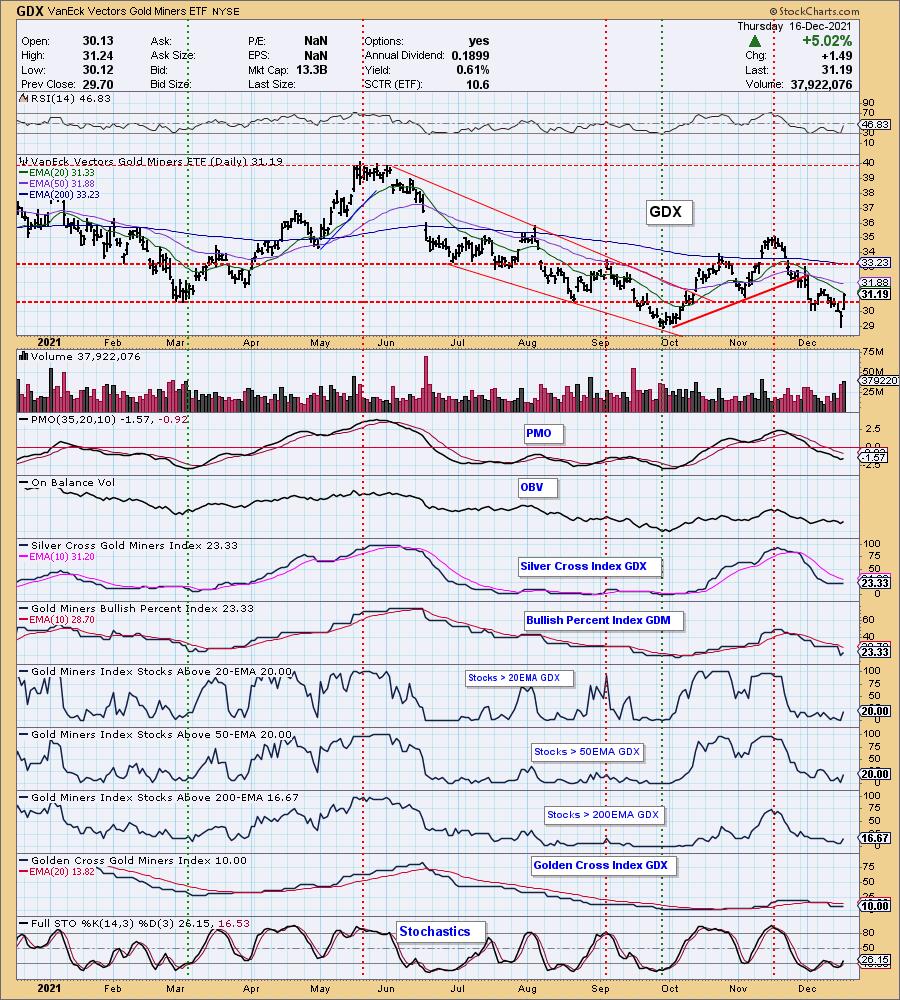
GOLD MINERS Golden and Silver Cross Indexes: I mentioned yesterday that we should watch for a bottom in Gold Miners based on it testing support at the September low. I didn't expect to see a reversal today, but I'll take it. The PMO has turned up and we are seeing some participation bubbling. Might be time to check out the chart of your favorite Gold Miners.
CRUDE OIL (USO)
IT Trend Model: NEUTRAL as of 11/30/2021
LT Trend Model: BUY as of 3/9/2021
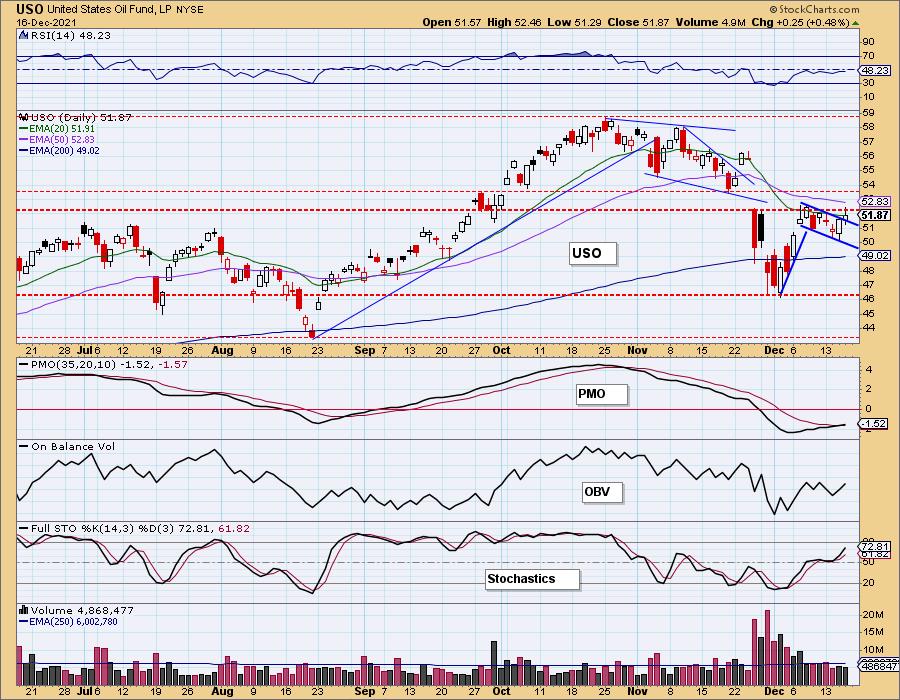
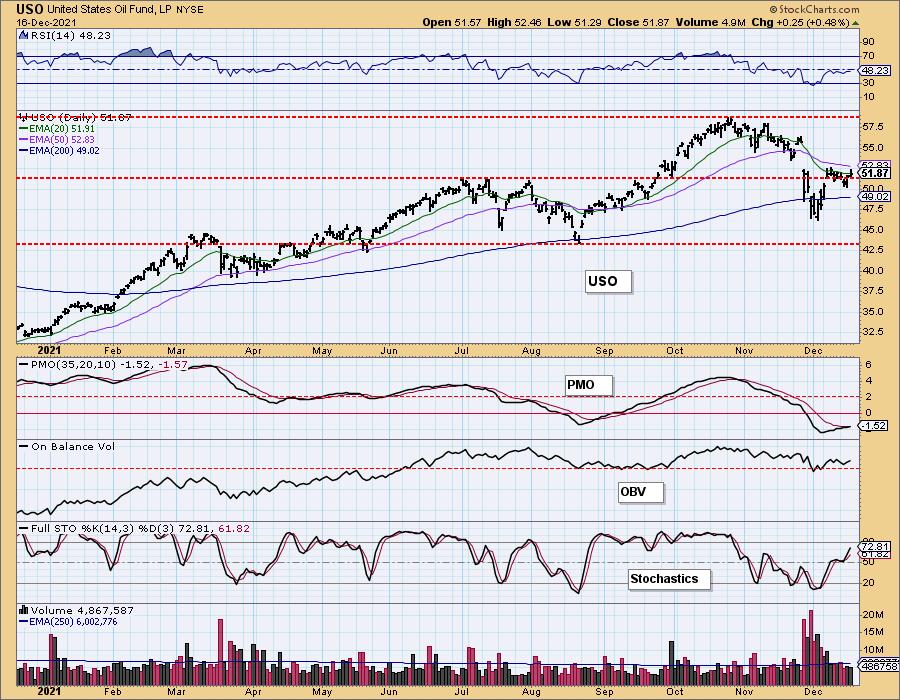
USO Daily Chart: USO saw a tiny breakout from the short-term bull flag. The PMO also triggered a crossover BUY signal. Stochastics had already been rising. The only lagging indicator is the RSI which remains negative. The 20-EMA, 50-EMA and gap resistance will be difficult to get past, but with improving indicators I believe we will get a breakout here.
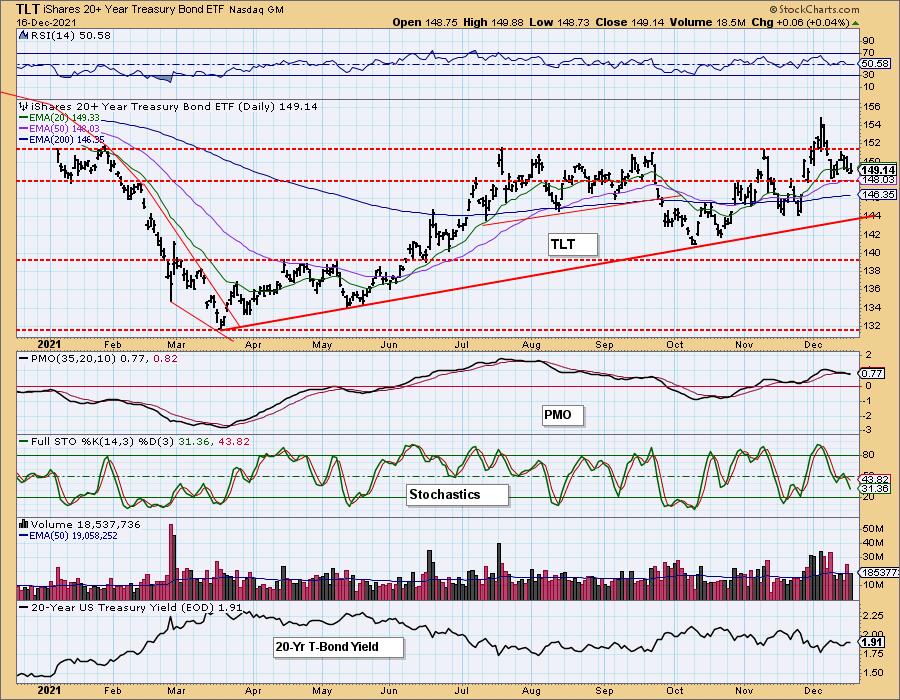
BONDS (TLT)
IT Trend Model: BUY as of 11/8/2021
LT Trend Model: BUY as of 11/5/2021
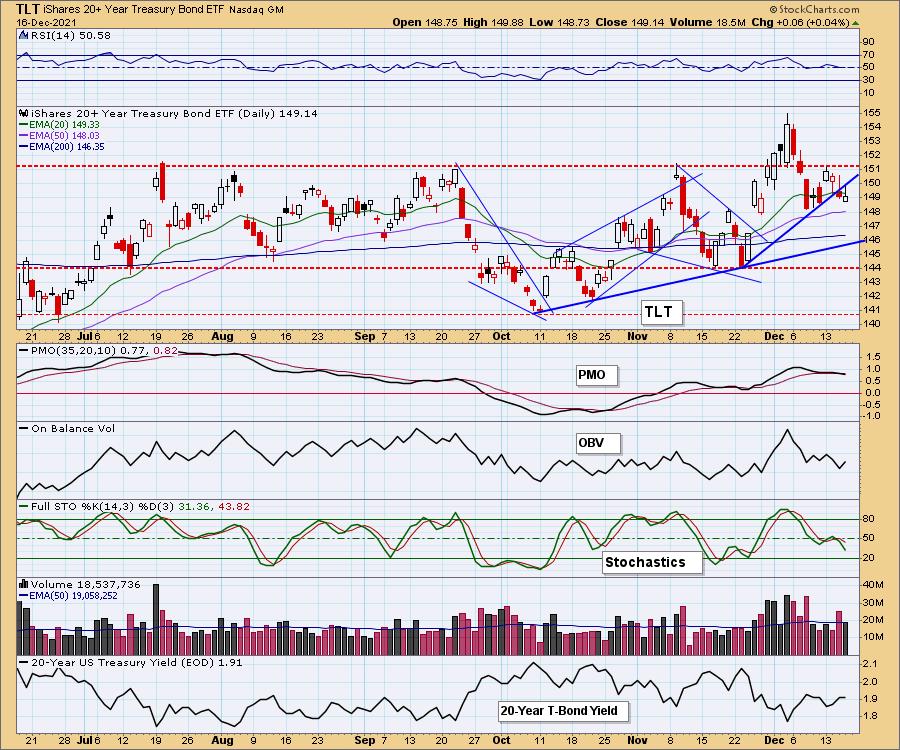
TLT Daily Chart: Yesterday's comments still apply:
"TLT broke the short-term declining trend. The RSI is still in positive territory and the PMO is still on a BUY signal. Stochastics, on the other hand, are pointed downward and are negative. The technicals are beginning to weigh heavy."
Technical Analysis is a windsock, not a crystal ball.
--Erin Swenlin
(c) Copyright 2021 DecisionPoint.com
Disclaimer: This blog is for educational purposes only and should not be construed as financial advice. The ideas and strategies should never be used without first assessing your own personal and financial situation, or without consulting a financial professional. Any opinions expressed herein are solely those of the author, and do not in any way represent the views or opinions of any other person or entity.
NOTE: The signal status reported herein is based upon mechanical trading model signals, specifically, the DecisionPoint Trend Model. They define the implied bias of the price index based upon moving average relationships, but they do not necessarily call for a specific action. They are information flags that should prompt chart review. Further, they do not call for continuous buying or selling during the life of the signal. For example, a BUY signal will probably (but not necessarily) return the best results if action is taken soon after the signal is generated. Additional opportunities for buying may be found as price zigzags higher, but the trader must look for optimum entry points. Conversely, exit points to preserve gains (or minimize losses) may be evident before the model mechanically closes the signal.
Helpful DecisionPoint Links:
DecisionPoint Alert Chart List
DecisionPoint Golden Cross/Silver Cross Index Chart List
DecisionPoint Sector Chart List
Price Momentum Oscillator (PMO)
Swenlin Trading Oscillators (STO-B and STO-V)
DecisionPoint is not a registered investment advisor. Investment and trading decisions are solely your responsibility. DecisionPoint newsletters, blogs or website materials should NOT be interpreted as a recommendation or solicitation to buy or sell any security or to take any specific action.