
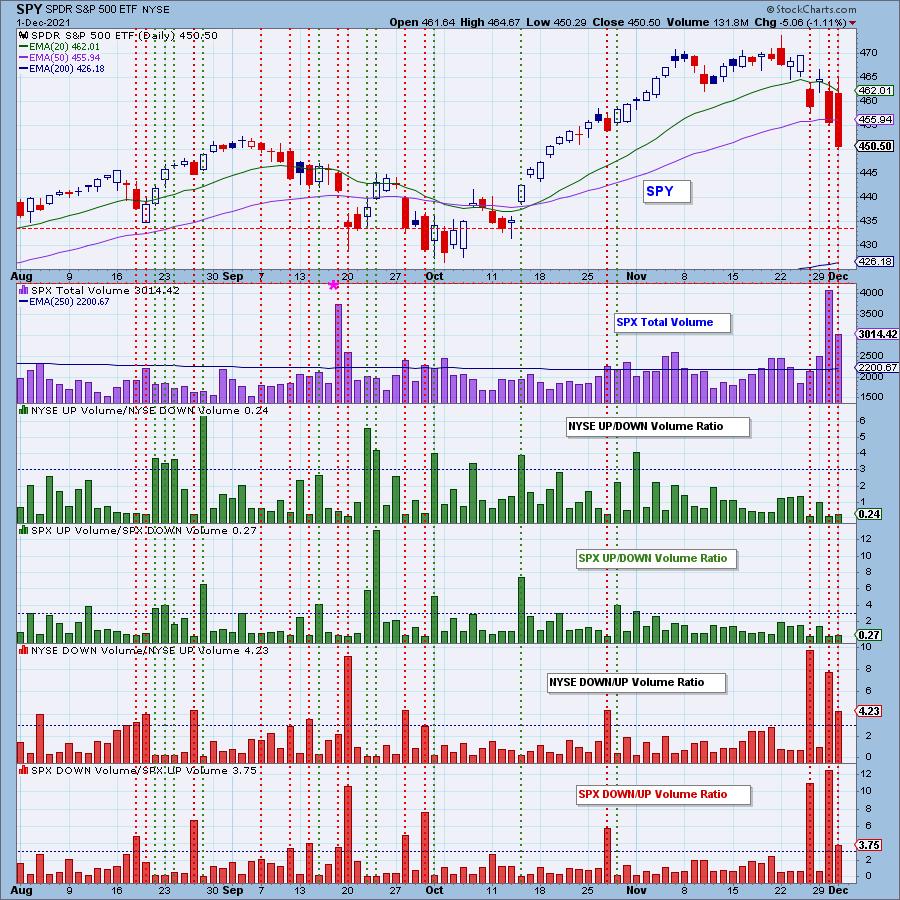
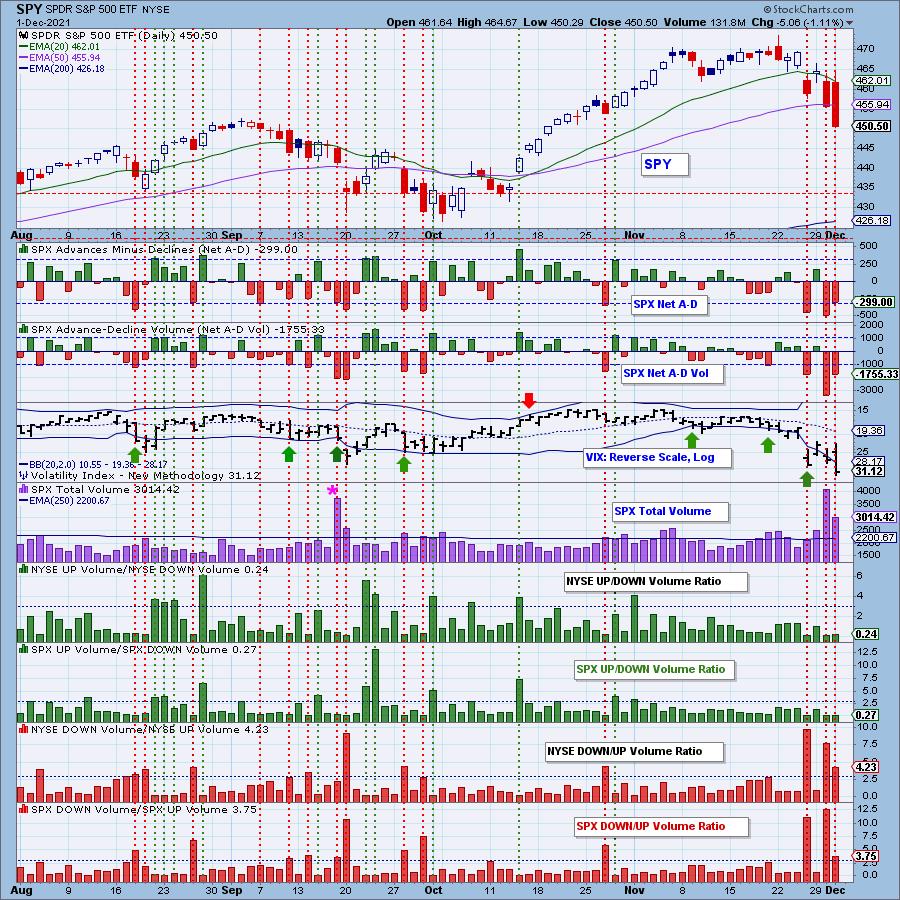
It was another day of serious selling. Looking at the Volume Ratio chart below you can see that our threshold of 3.0 was again broken on the Down/Up Volume Ratios for both the SPX and NYSE. Total Volume was also climactic though not nearly as high as yesterday. The Volume Ratios were also not as elevated as yesterday.
The question is whether this is a downside initiation climax or exhaustion climax. Typically we would rule this an initiation climax since it is appearing after an exhaustion climax. However, Carl and I believe this is a follow-on to yesterday's exhaustion. The lower Total Volume and Down/Up Volume Ratios suggest that the selling may be ebbing. This isn't to say it has ended. We are looking for churn and chop into the end of the week with an outside chance of a healthy rebound given indicators are oversold.
The DecisionPoint Alert Weekly Wrap presents an end-of-week assessment of the trend and condition of the Stock Market, the U.S. Dollar, Gold, Crude Oil, and Bonds. The DecisionPoint Alert daily report (Monday through Thursday) is abbreviated and gives updates on the Weekly Wrap assessments.
Watch the latest episode of DecisionPoint on StockCharts TV's YouTube channel here!
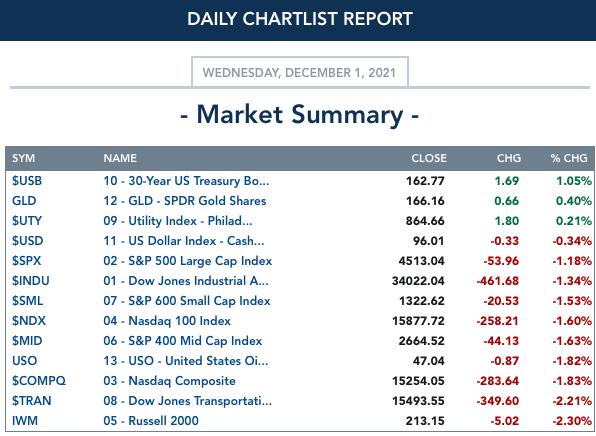
MAJOR MARKET INDEXES
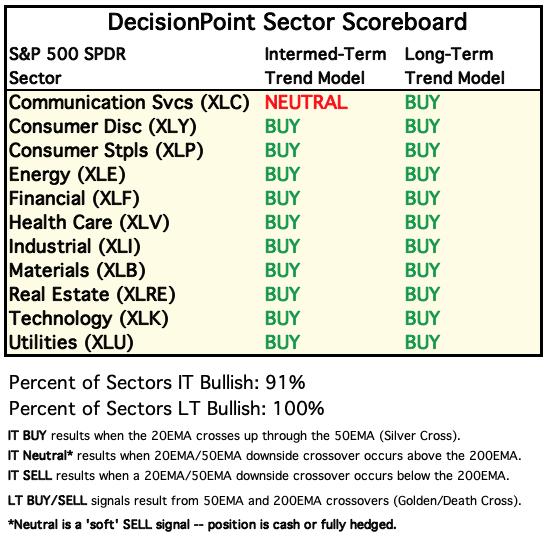
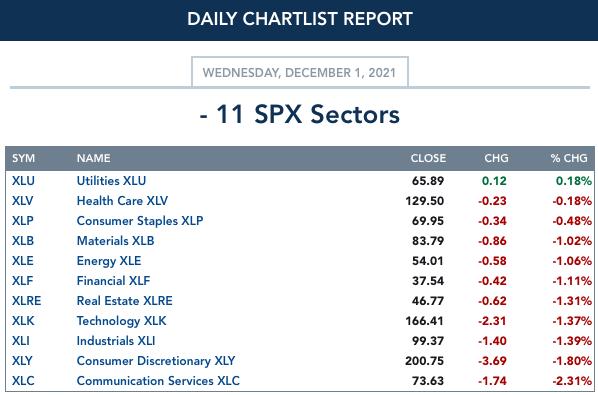
SECTORS
Each S&P 500 Index component stock is assigned to one, and only one, of 11 major sectors. This is a snapshot of the Intermediate-Term (Silver Cross) and Long-Term (Golden Cross) Trend Model signal status for those sectors.
RRG® Chart: XLK and XLY remain in Leading, although XLY switched its heading to bearish southwest. XLV, XLU and XLRE, all defensive sectors are traveling in the bullish northeast direction. All other sectors look bearish. XLP doesn't have a bullish heading, but it is still in Improving and as a defensive sector it may come around.
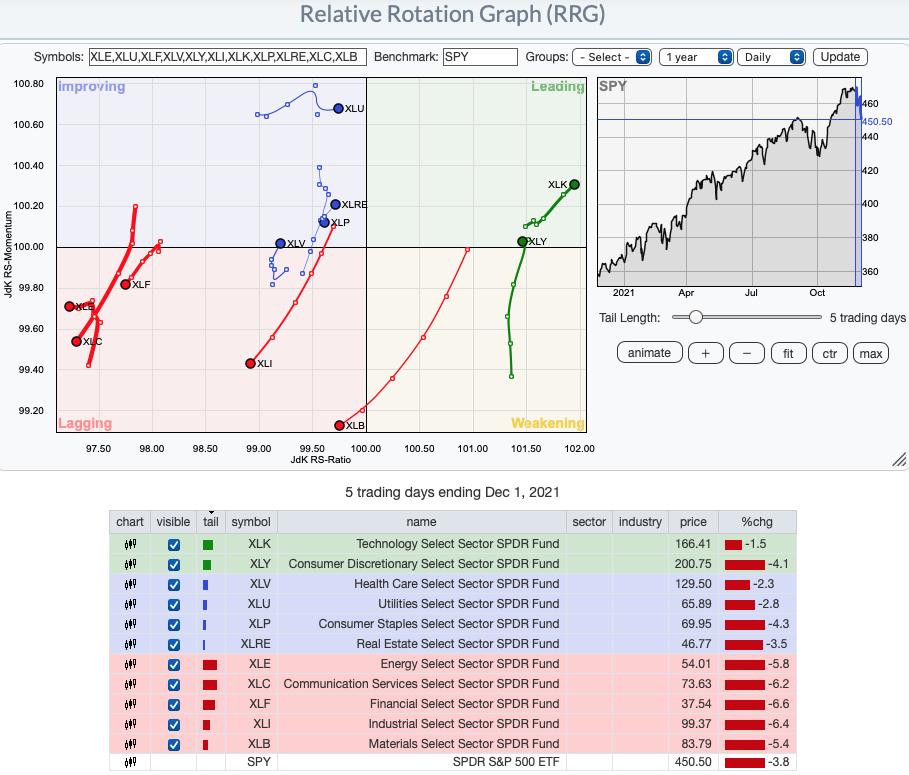
RRG® charts show you the relative strength and momentum for a group of stocks. Stocks with strong relative strength and momentum appear in the green Leading quadrant. As relative momentum fades, they typically move into the yellow Weakening quadrant. If relative strength then fades, they move into the red Lagging quadrant. Finally, when momentum starts to pick up again, they shift into the blue Improving quadrant.
CLICK HERE for an animated version of the RRG chart.
CLICK HERE for Carl's annotated Sector charts.
THE MARKET (S&P 500)
IT Trend Model: BUY as of 10/18/2021
LT Trend Model: BUY as of 6/8/2020
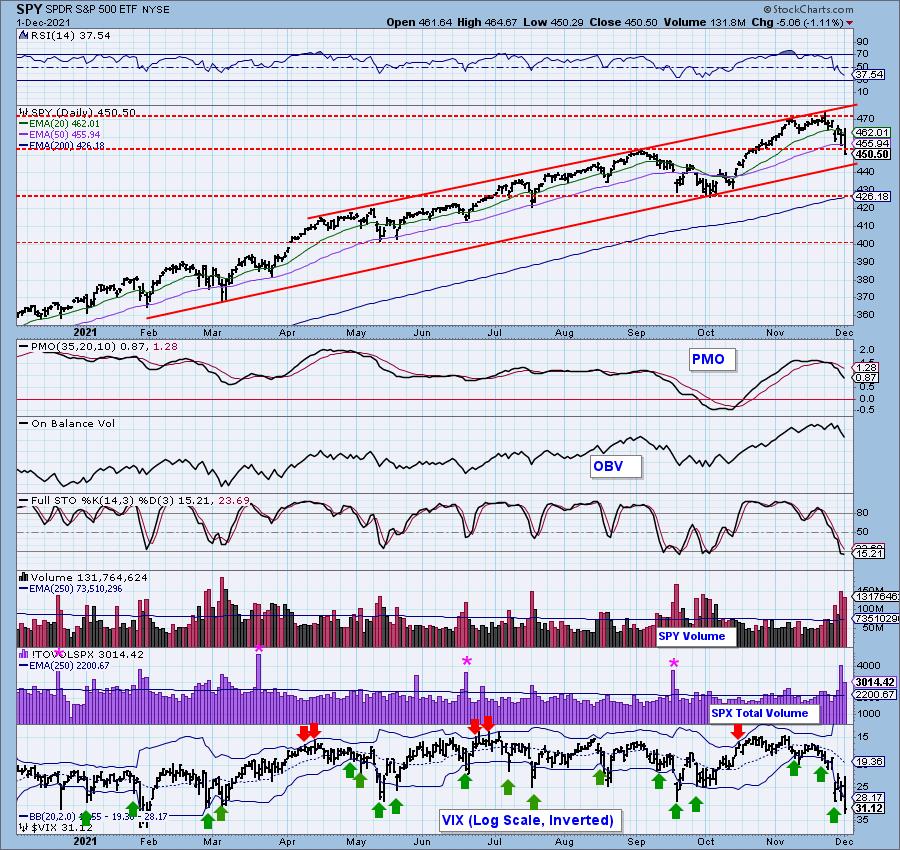
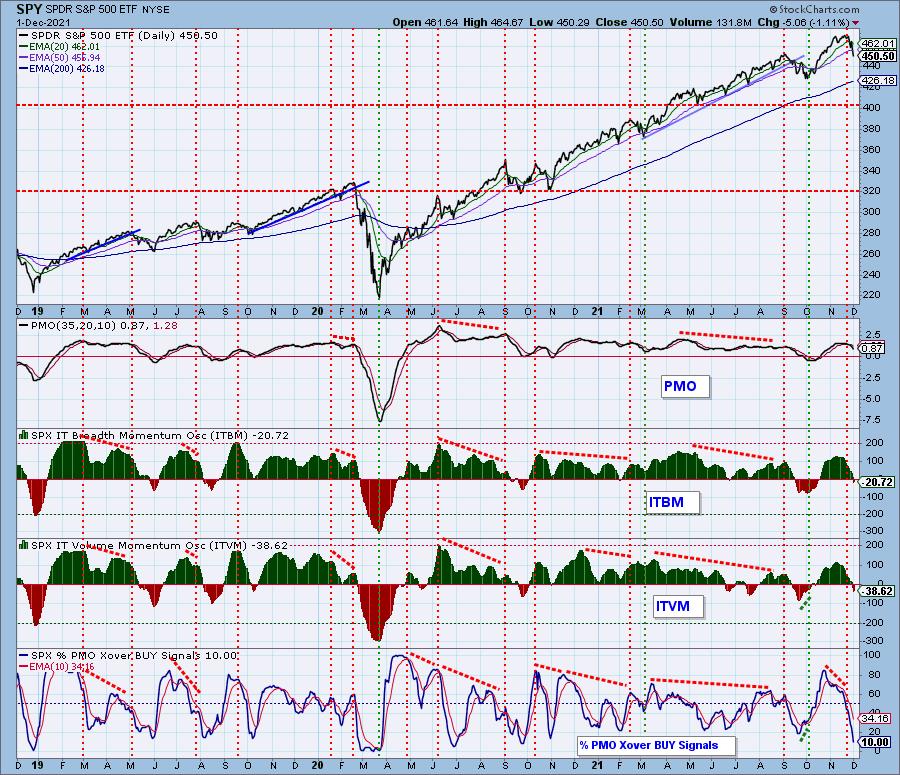
SPY Daily Chart: We missed a bearish engulfing candlestick by a hair, but it still looks ugly. Important support at the September top was lost. The short-term rising trend was also compromised.
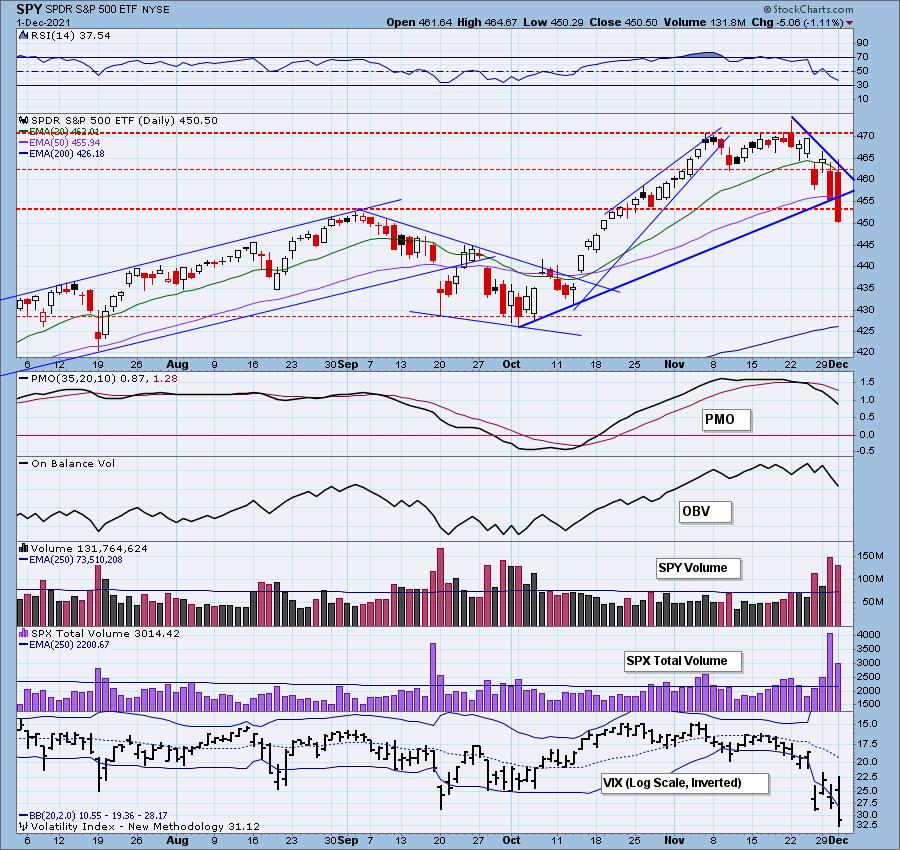
The RSI is negative and still headed lower. The PMO is falling, but hasn't reached oversold territory yet. Stochastics did flatten slightly in oversold territory. The VIX closed at its highest reading since January.

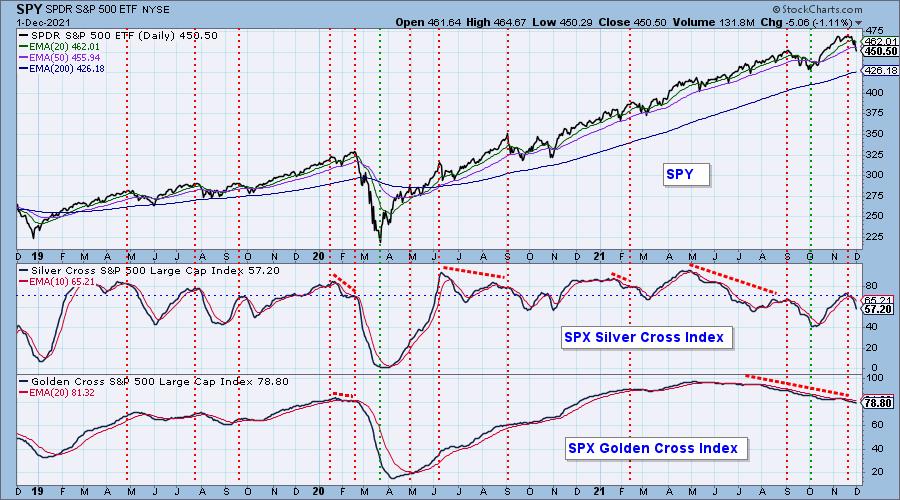
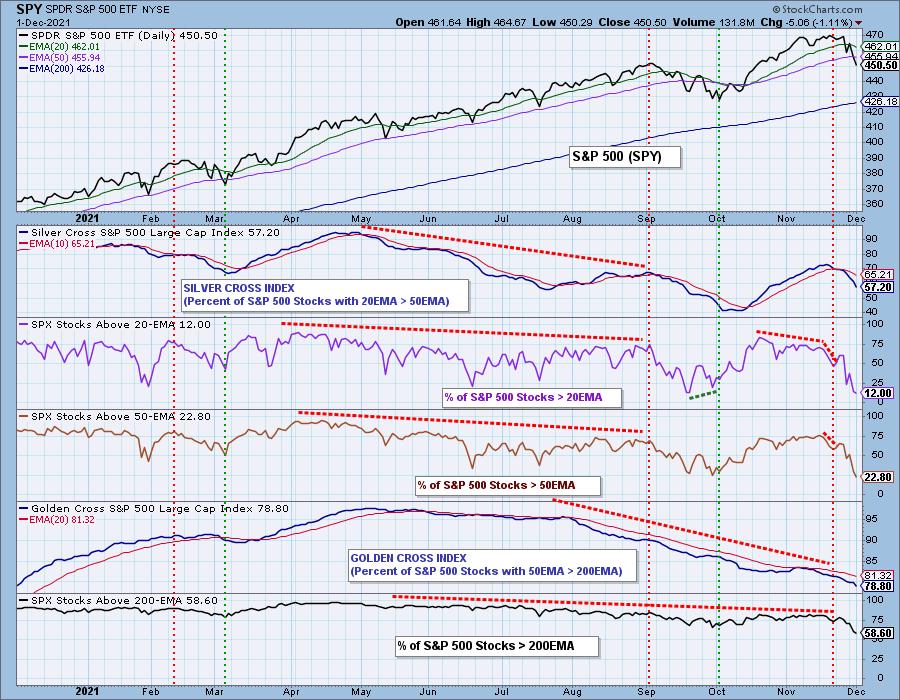
PARTICIPATION: The following chart objectively shows the depth and trend of participation in two time frames.
- Intermediate-Term - the Silver Cross Index (SCI) shows the percentage of SPX stocks on IT Trend Model BUY signals (20-EMA > 50-EMA). The opposite of the Silver Cross is a "Dark Cross" -- those stocks are, at the very least, in a correction.
- Long-Term - the Golden Cross Index (GCI) shows the percentage of SPX stocks on LT Trend Model BUY signals (50-EMA > 200-EMA). The opposite of a Golden Cross is the "Death Cross" -- those stocks are in a bear market.
The SCI lost almost 4 percentage points today, but it isn't oversold yet. The GCI is still trending lower.
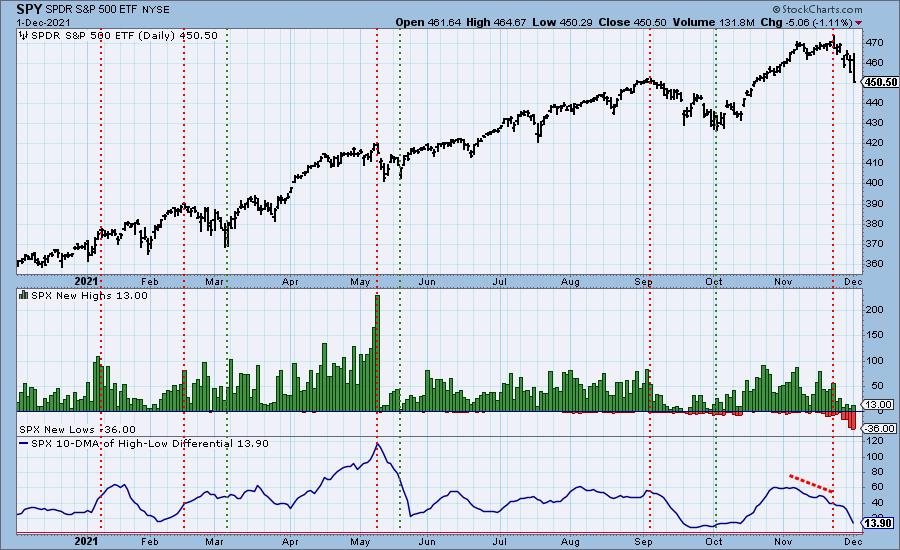
New 52-Week Highs/Lows: We have oversold New Low readings as far as the past year.
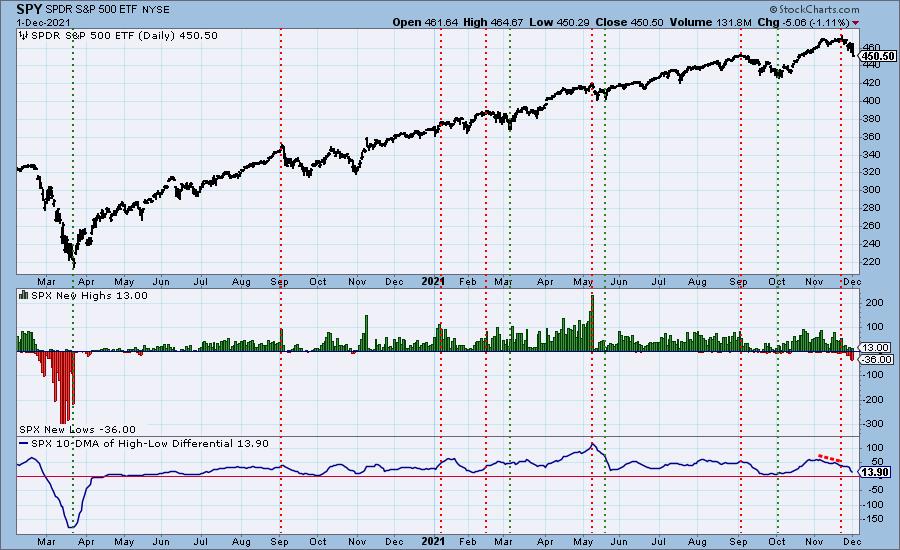
Looking at a two year chart, we can see they aren't particularly oversold when compared to 2020. If they expand much further, it could be indicative of a new bear market.
Climax Analysis: We said yesterday that the exhaustion climax didn't mean the decline was over. We feel the same about today's exhaustion climax. With the VIX so oversold and high total volume, the market is ripe for a bounce or a pause. I'm reminded of the 2020 bear market where we had forceful down days followed by strong up days followed by an even stronger down day, etc.
*A climax is a one-day event when market action generates very high readings in, primarily, breadth and volume indicators. We also include the VIX, watching for it to penetrate outside the Bollinger Band envelope. The vertical dotted lines mark climax days -- red for downside climaxes, and green for upside. Climaxes indicate either initiation or exhaustion.
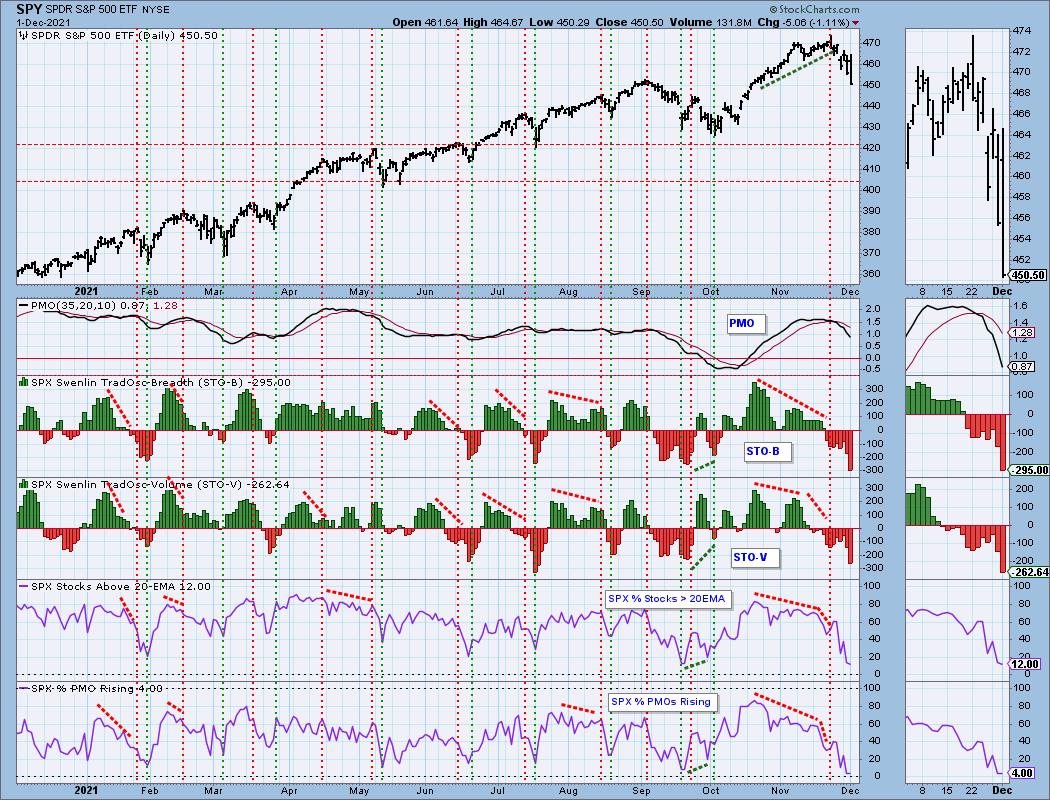
Short-Term Market Indicators: The short-term market trend is DOWN and the condition is OVERSOLD.
These indicators are all very oversold. Only 12% of stocks are above their 20-EMA with only 4% showing positive momentum. They suggest a rebound, but we can see how September worked out when they started rising again. It didn't mark the end of the decline, it merely took indicators out of oversold territory in preparation for another leg down.
Intermediate-Term Market Indicators: The intermediate-term market trend is UP and the condition is NEUTRAL.
The ITBM/ITVM have hit negative territory, but unlike the STOs, they are far from being oversold. There are only 10% of SPX stocks with PMO BUY signals. It's a very oversold reading, but we did see lower in 2020.
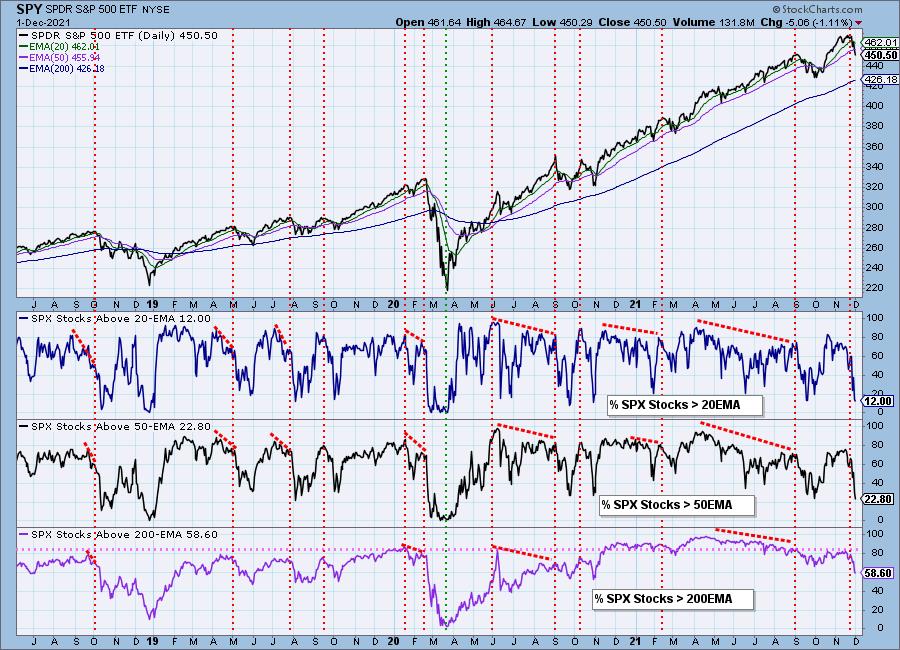
Bias Assessment: The bearish bias remains in all three timeframes.
%Stocks > 200-EMA appears oversold at 59% in the chart above. However, on the longer-term chart, that is not the case. More damage needs to be done. %Stocks > 20/50-EMAs are oversold, although the bear market and 2018 end of year blood bath saw these readings move even lower.
CONCLUSION: We believe that today's downside climax is a follow-on to yesterday's exhaustion climax. Clearly investors weren't done divesting. Indicators are oversold in nearly all timeframes, but in all of those cases we have seen even lower readings. An exhaustion climax tells us to expect a bounce or at the very least a pause in the decline. We favor the latter. Remember that in September it appeared the market was done with its decline after oversold indicators began to rise again. However, it was only an opportunity for those indicators to unwind out of oversold extremes. Once they did, the market plummeted even lower. Be prepared for that scenario.
Erin is 15% exposed to the market with 85% in cash and available to trade.
Have you subscribed the DecisionPoint Diamonds yet? DP does the work for you by providing handpicked stocks/ETFs from exclusive DP scans! Add it with a discount! Contact support@decisionpoint.com for more information!
BITCOIN
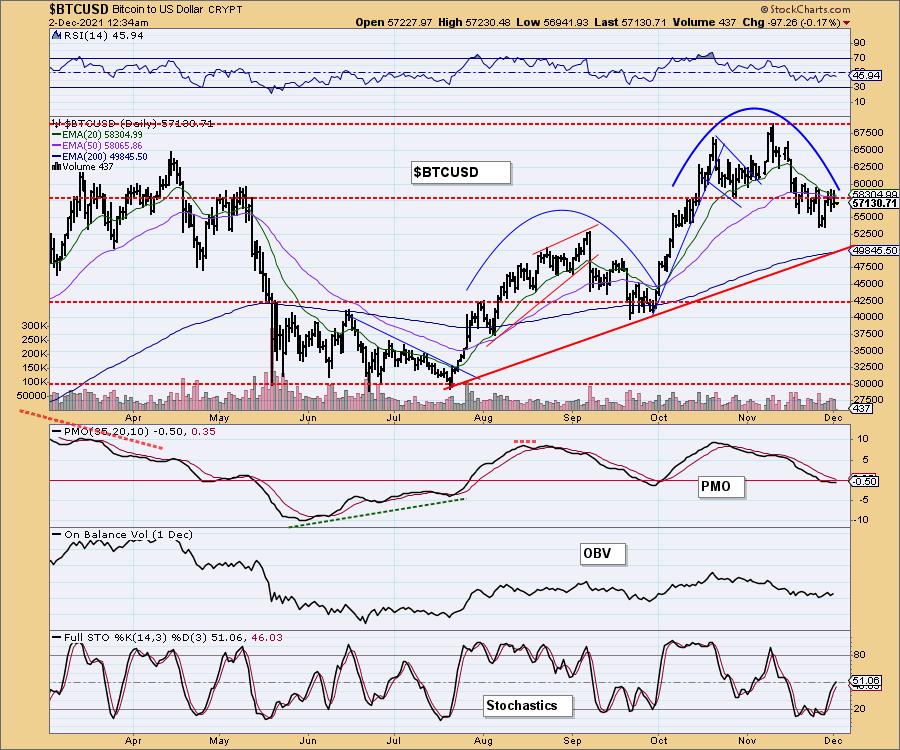
Yesterday's comments still apply:
"Bitcoin has rebounded out of its low last week. Some are considering cryptocurrencies as a place to hide out. However, right now, price is struggling to overcome resistance. The RSI is still negative, but the PMO appears to be coming around and Stochastics are rising again. It is set up to breakout, but for now overhead resistance is holding price back."
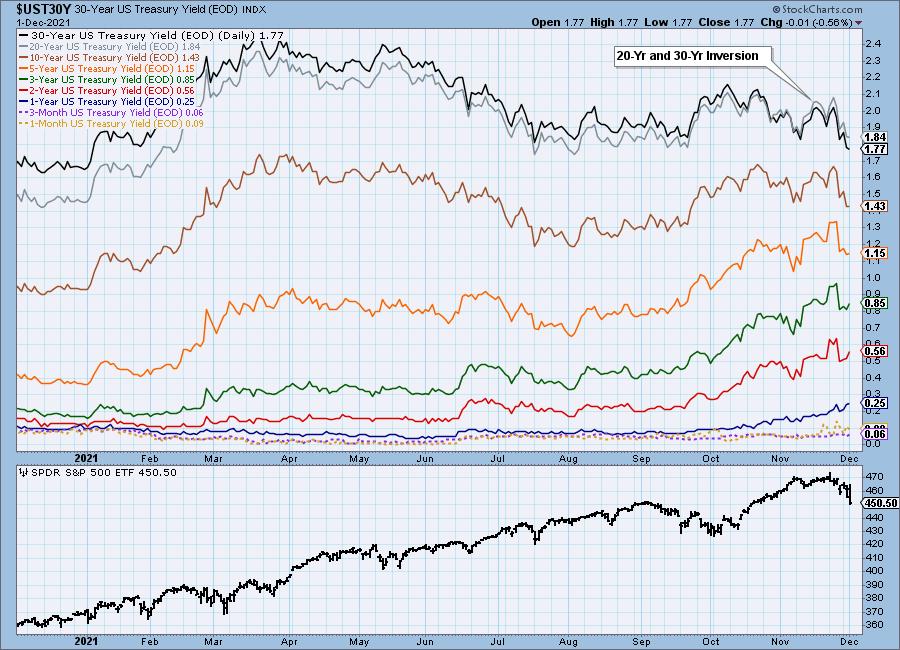
INTEREST RATES
Longer-term yields have broken support at their November lows as the flight to safety to Bonds continues.
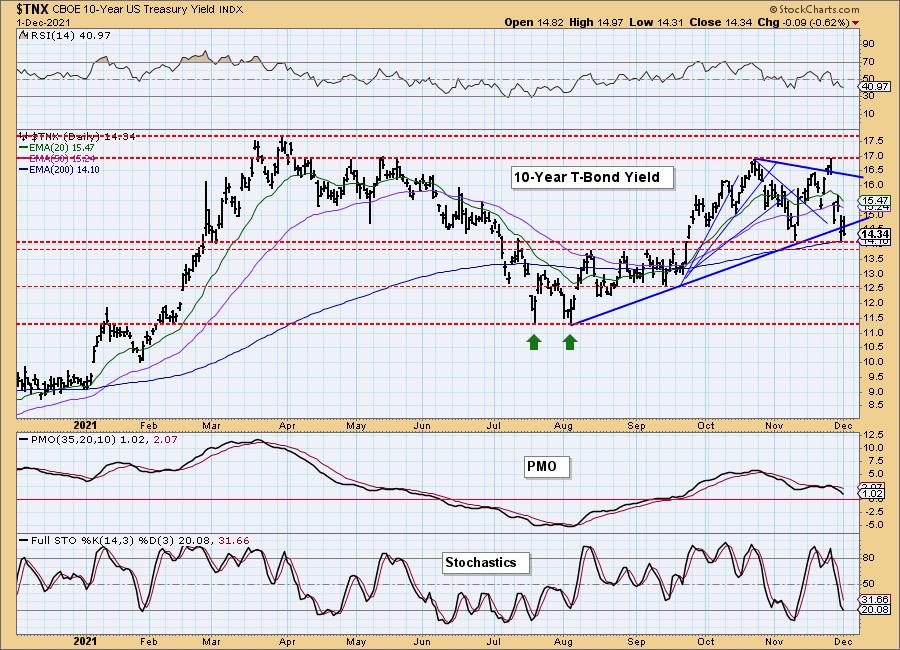
10-YEAR T-BOND YIELD
$TNX fell, but is holding support at both the 200-EMA and earlier November low. Indicators are still very negative so we could see a drop to the August highs. After that it could get dicey with the next level of support not arriving until 12.5.
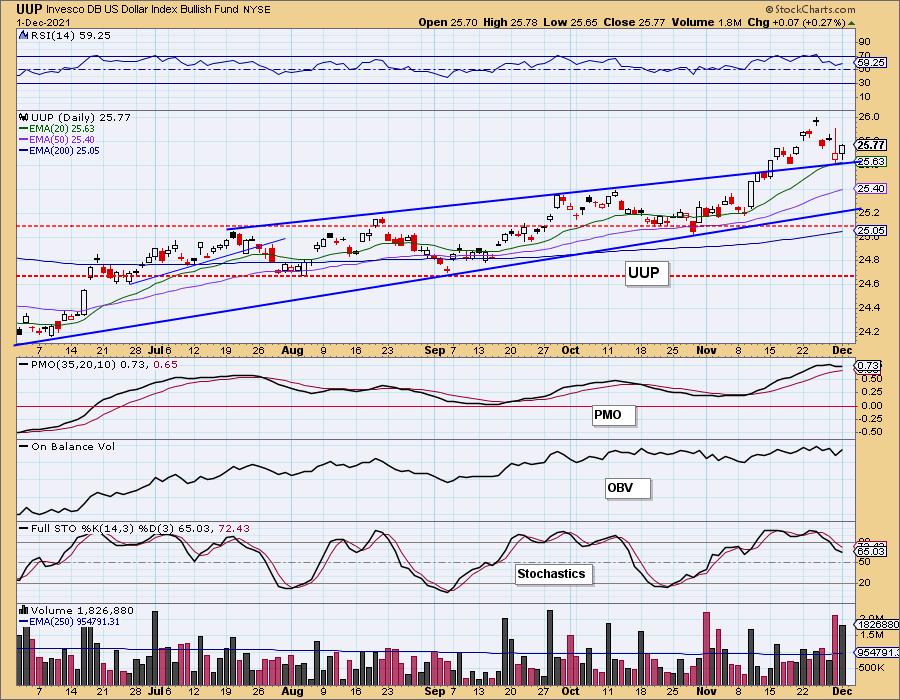
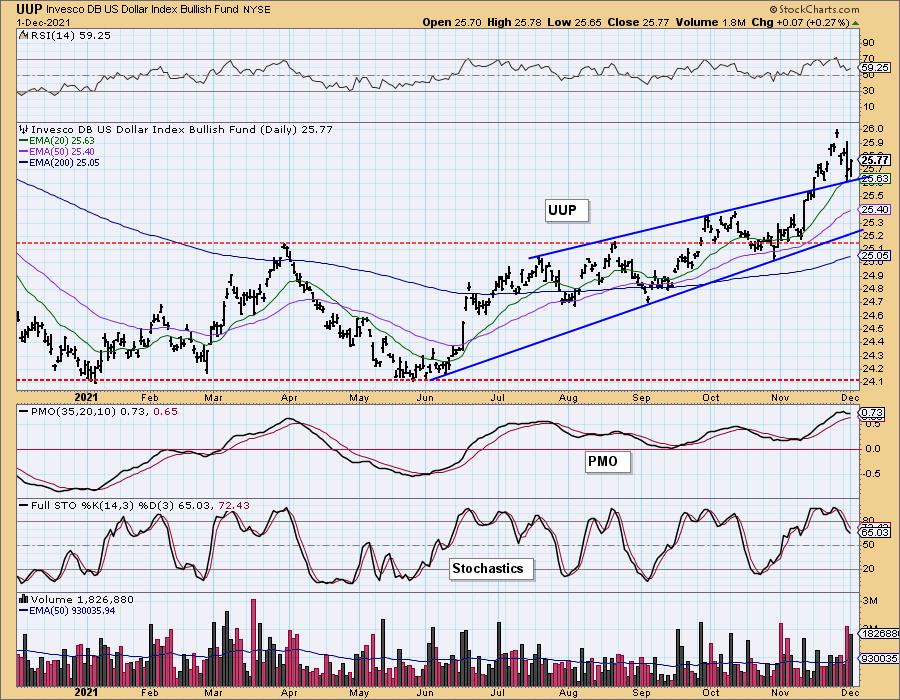
DOLLAR (UUP)
IT Trend Model: BUY as of 6/22/2021
LT Trend Model: BUY as of 8/19/2021
UUP Daily Chart: The PMO is attempting to rise again as UUP bounced off the 20-EMA and the top of the prior bearish rising wedge. Stochastics are still negative so I'm not expecting much to come from this rebound.
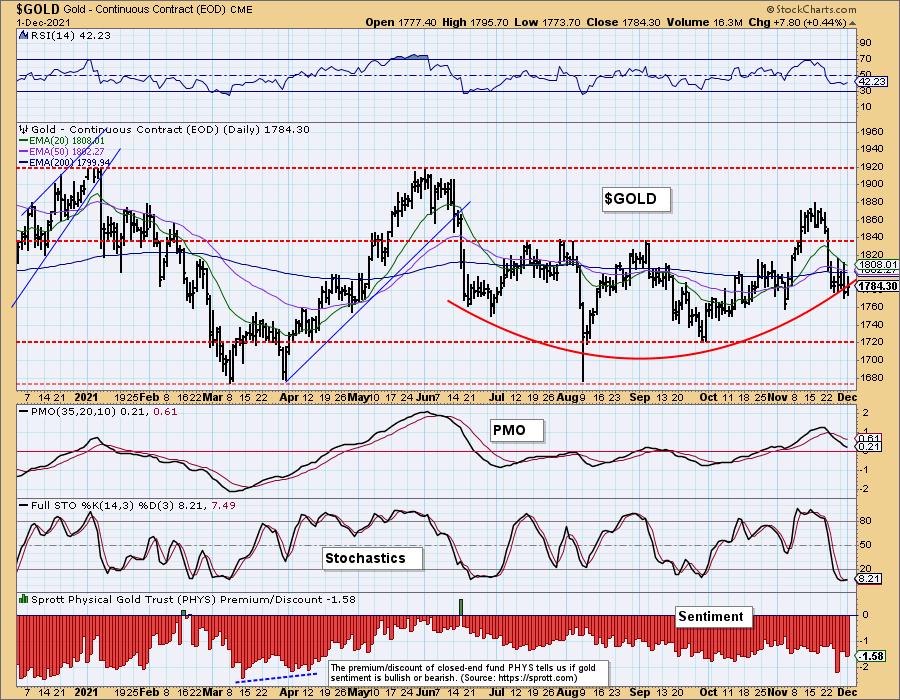
GOLD
IT Trend Model: BUY as of 10/28/2021
LT Trend Model: BUY as of 11/16/2021
GOLD Daily Chart: Gold was higher, but not impressively so. Still hope springs eternal as Stochastics are bottoming in oversold territory and the RSI is rising again. Discounts are still very high so investors are still bearish on Gold.
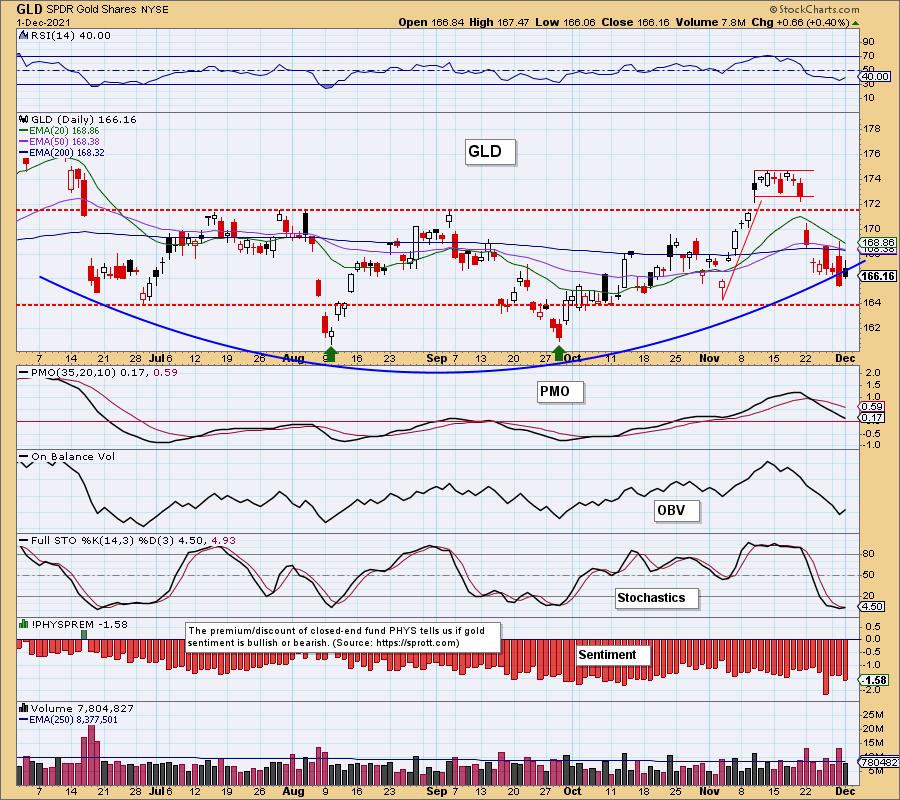
The PMO is still declining, but the saucer shaped bottom also provides hope. However, we don't trade on hope so I'd stay clear of Gold for the time being.
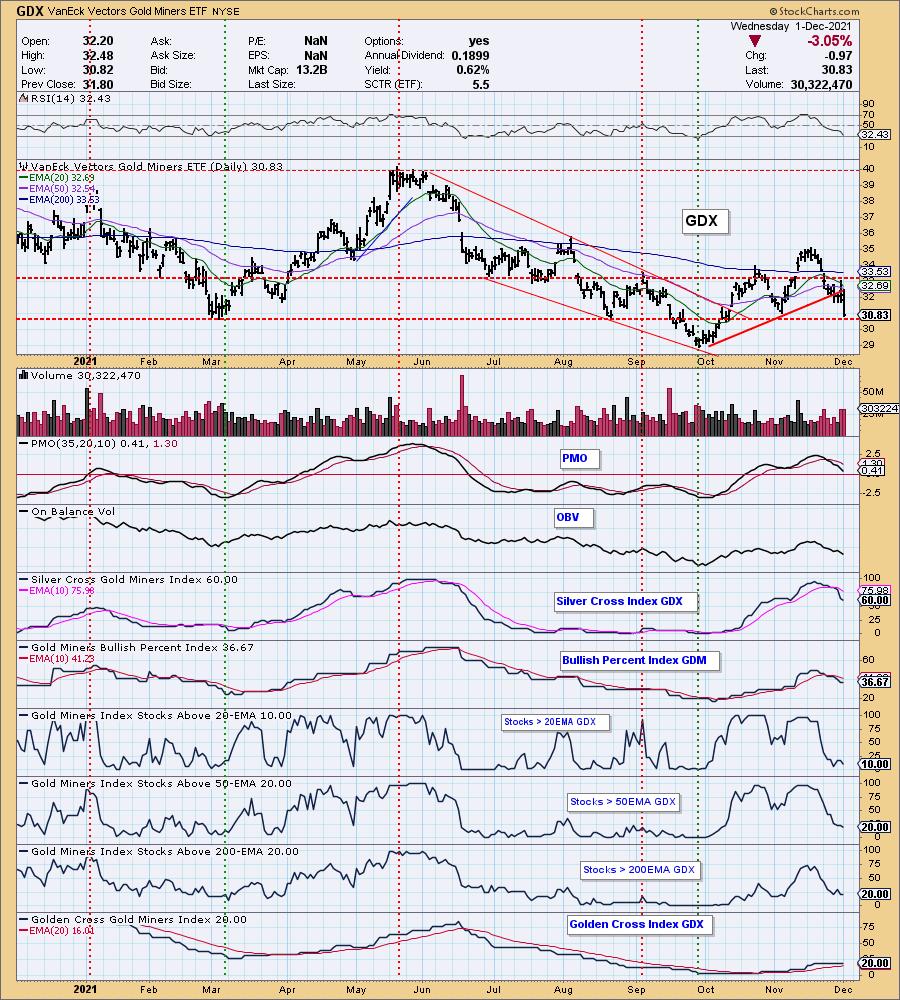
GOLD MINERS Golden and Silver Cross Indexes: Gold Miners took it on the chin despite higher Gold prices. Price is now on strong support. The RSI is nearing oversold territory, but the PMO is far from oversold. Participation is lacking, but it didn't take a huge hit today. I own a Gold Miner and it was up quite a bit. There are still a few pockets of strength in this group.
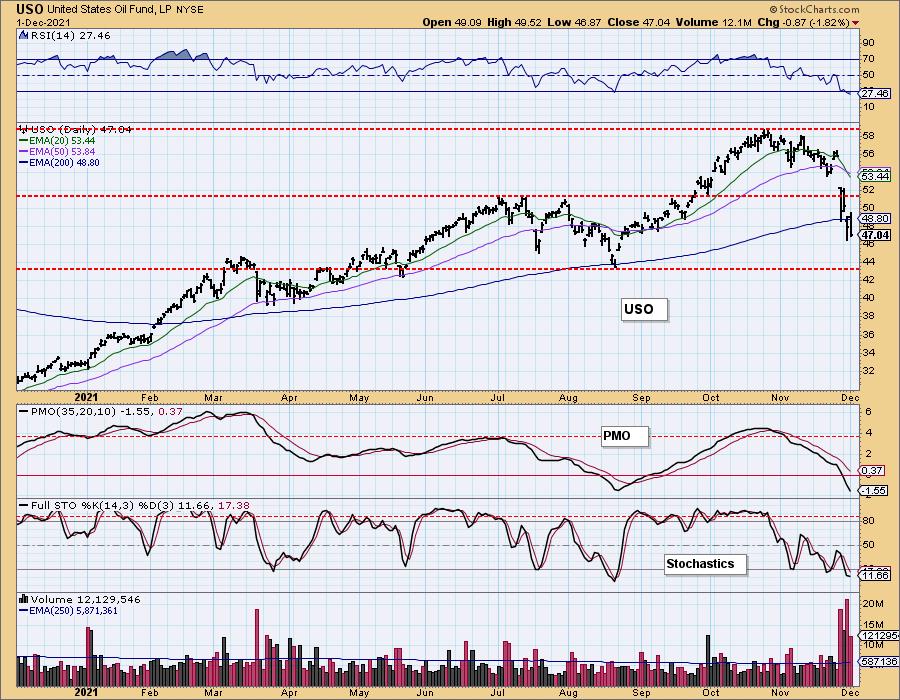
CRUDE OIL (USO)
IT Trend Model: NEUTRAL as of 11/30/2021
LT Trend Model: BUY as of 3/9/2021
USO Daily Chart: Another deep decline for Crude Oil today. It set up a bearish engulfing candlestick which suggests the decline isn't over yet. The indicators are now oversold and support is arriving, but until we see some improvement on those indicators, we could see USO drop to the August low.
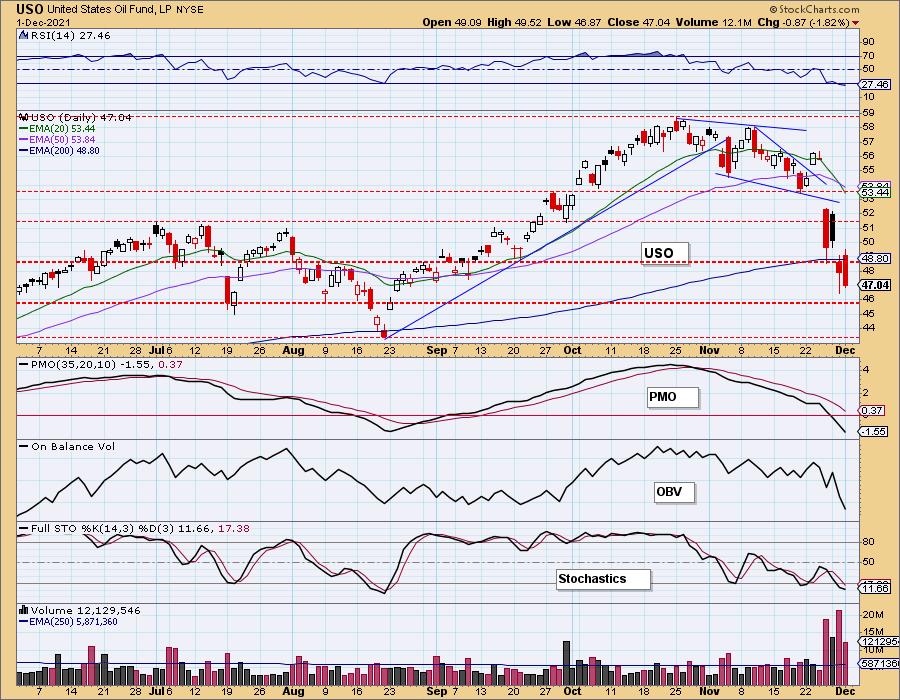
We expect support to be tested at the $43 level.
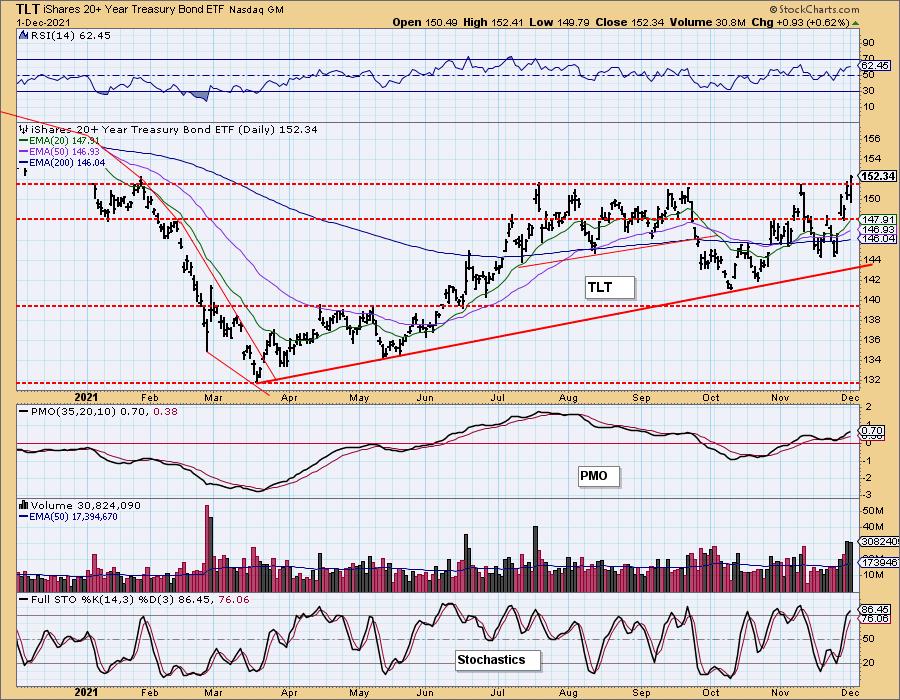
BONDS (TLT)
IT Trend Model: BUY as of 11/8/2021
LT Trend Model: BUY as of 11/5/2021
TLT Daily Chart: USO had a bearish engulfing candlestick, but TLT has a bullish engulfing candlestick. The RSI is positive and Stochastics have now reached above 80. The PMO is rising and not at all overbought.
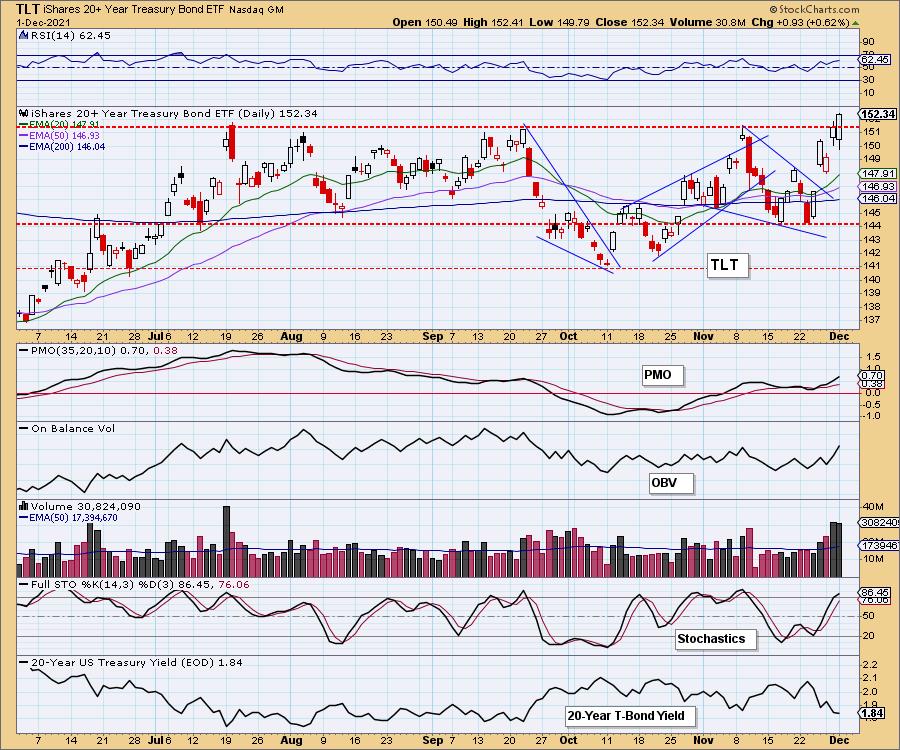
There is an intermediate-term ascending triangle (rising bottoms, flat tops) in play. Today's close above resistance is executing the pattern.
Technical Analysis is a windsock, not a crystal ball.
-- Erin Swenlin
(c) Copyright 2021 DecisionPoint.com
Disclaimer: This blog is for educational purposes only and should not be construed as financial advice. The ideas and strategies should never be used without first assessing your own personal and financial situation, or without consulting a financial professional. Any opinions expressed herein are solely those of the author, and do not in any way represent the views or opinions of any other person or entity.
NOTE: The signal status reported herein is based upon mechanical trading model signals, specifically, the DecisionPoint Trend Model. They define the implied bias of the price index based upon moving average relationships, but they do not necessarily call for a specific action. They are information flags that should prompt chart review. Further, they do not call for continuous buying or selling during the life of the signal. For example, a BUY signal will probably (but not necessarily) return the best results if action is taken soon after the signal is generated. Additional opportunities for buying may be found as price zigzags higher, but the trader must look for optimum entry points. Conversely, exit points to preserve gains (or minimize losses) may be evident before the model mechanically closes the signal.
Helpful DecisionPoint Links:
DecisionPoint Alert Chart List
DecisionPoint Golden Cross/Silver Cross Index Chart List
DecisionPoint Sector Chart List
Price Momentum Oscillator (PMO)
Swenlin Trading Oscillators (STO-B and STO-V)
DecisionPoint is not a registered investment advisor. Investment and trading decisions are solely your responsibility. DecisionPoint newsletters, blogs or website materials should NOT be interpreted as a recommendation or solicitation to buy or sell any security or to take any specific action.