
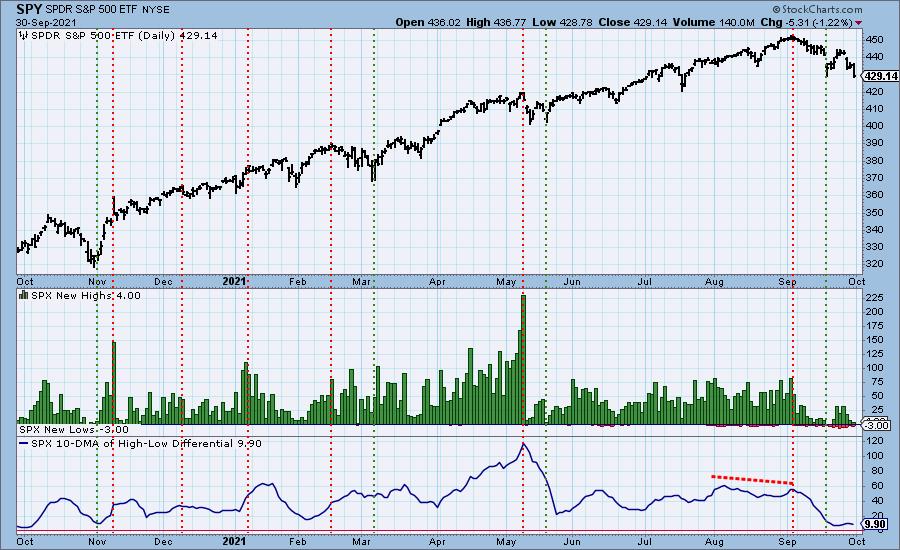
It shouldn't surprise us that a sell-off like we had today would trigger a downside climax. However, there were a few indicators that didn't go along for the ride. The first of those indicators is New Highs/New Lows.
Generally on a climax day we will see a big contraction in New Highs or a marked expansion in New Lows. Neither happened today. Although I do note that the 10-DMA of the High-Low Differential is topping and that generally is bearish for the market.
The DecisionPoint Alert Weekly Wrap presents an end-of-week assessment of the trend and condition of the Stock Market, the U.S. Dollar, Gold, Crude Oil, and Bonds. The DecisionPoint Alert daily report (Monday through Thursday) is abbreviated and gives updates on the Weekly Wrap assessments.
Watch the latest episode of DecisionPoint on StockCharts TV's YouTube channel here!
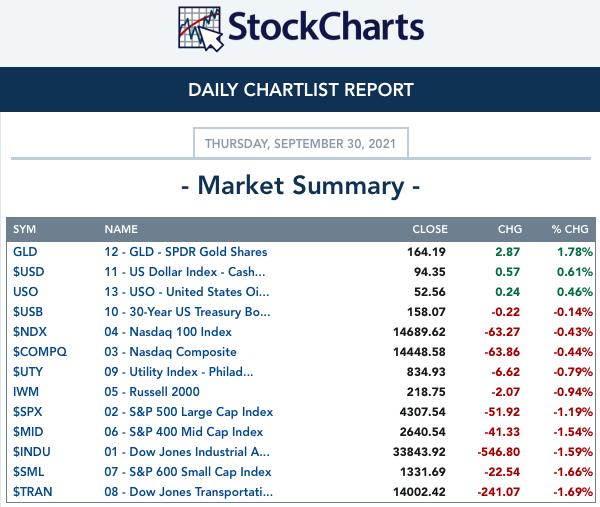
MAJOR MARKET INDEXES
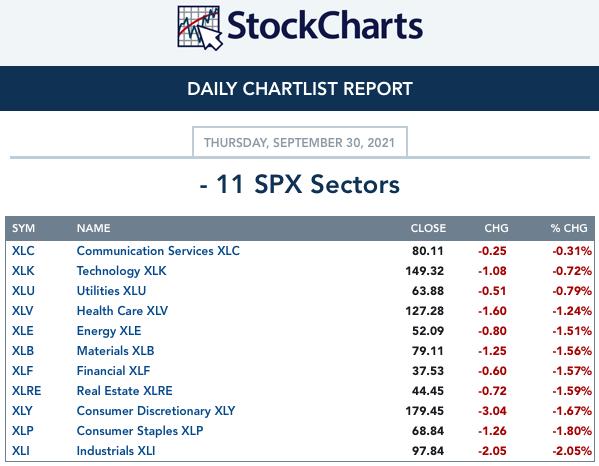
SECTORS
Each S&P 500 Index component stock is assigned to one, and only one, of 11 major sectors. This is a snapshot of the Intermediate-Term (Silver Cross) and Long-Term (Golden Cross) Trend Model signal status for those sectors.
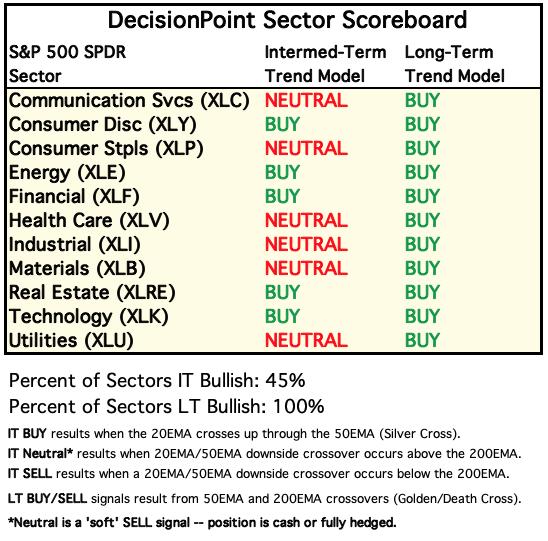
We had a shake up on the Sector Scoreboard. XLC and XLV both lost their "silver crosses" triggering IT Trend Model Neutral signals. More sectors now have more neutral signals than buy signals. The market is very weak, but their are winning industry groups to be found within Energy and Financials.
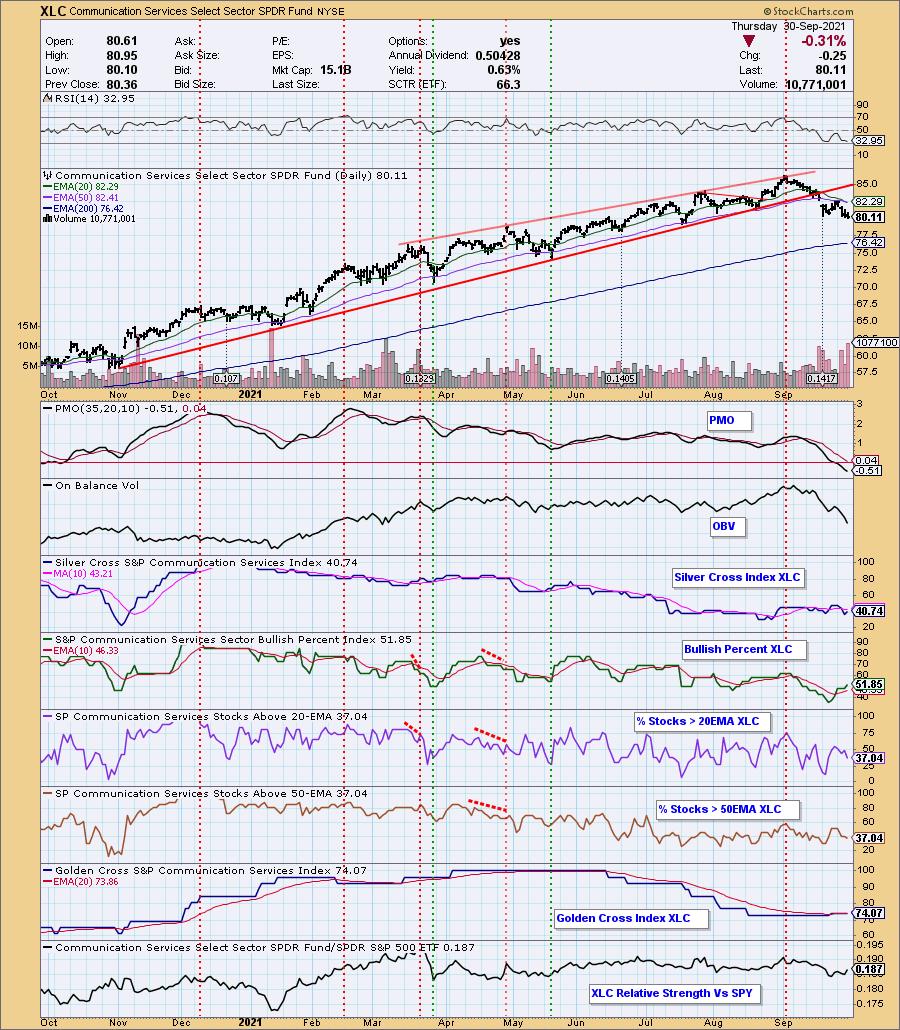
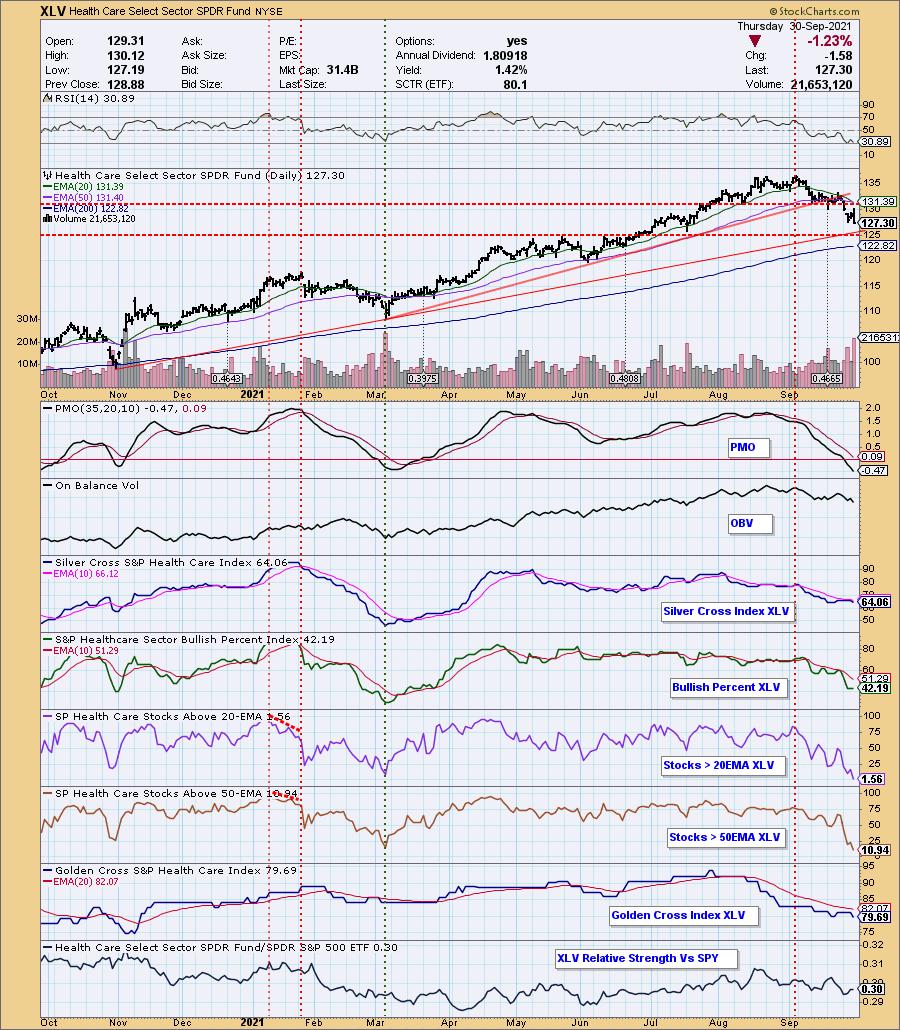
XLC has found support, but the PMO is still in decline. Participation is weak and getting weaker.
XLV is nearing support. The RSI is negative and the PMO is pointed straight down. However, participation is getting very oversold. We could see a turnaround if support holds at the May/June tops and corresponding July low. For now, it is too weak to catch this falling knife.
RRG® Chart: XLV and XLP have reversed course and are back in Improving. We can also see relative strength improvement on XLU and XLB. XLI continues to head toward Leading to join strong leaders XLE and XLF. XLY continues to weaken.
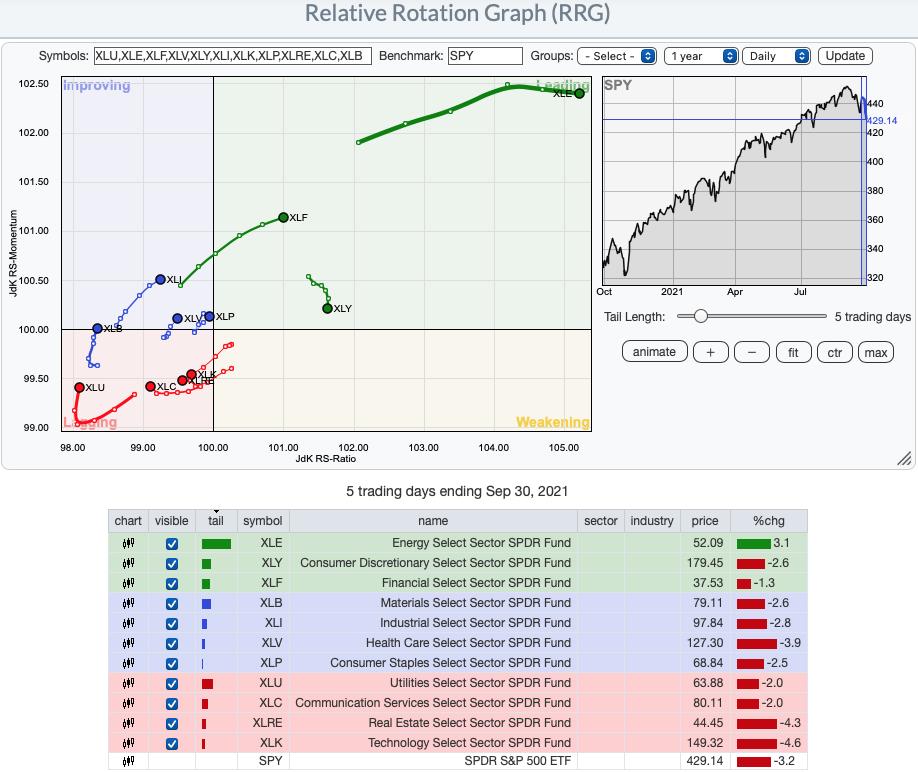
CLICK HERE for an animated version of the RRG chart.
CLICK HERE for Carl's annotated Sector charts.
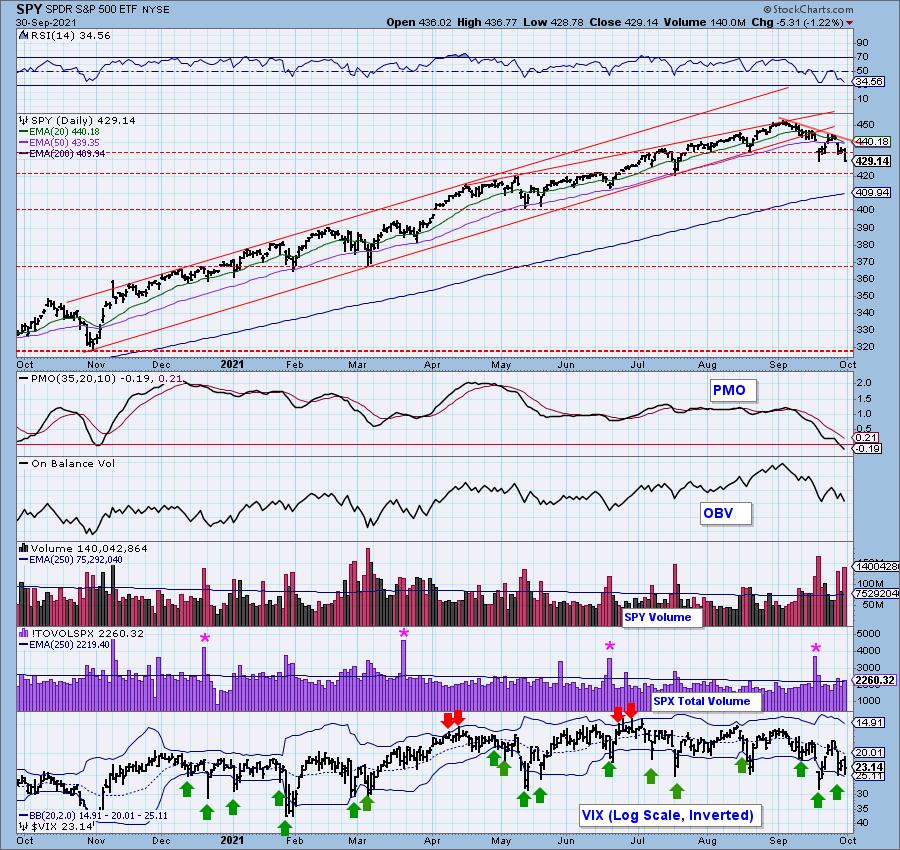
THE MARKET (S&P 500)
IT Trend Model: BUY as of 5/8/2020
LT Trend Model: BUY as of 6/8/2020
SPY Daily Chart: Support was obliterated today and the next level of support doesn't arrive until about $422 for the SPY. We also have a bearish engulfing candle that looks quite ominous. The PMO is continuing to move deeper into negative territory and the RSI is in decline.
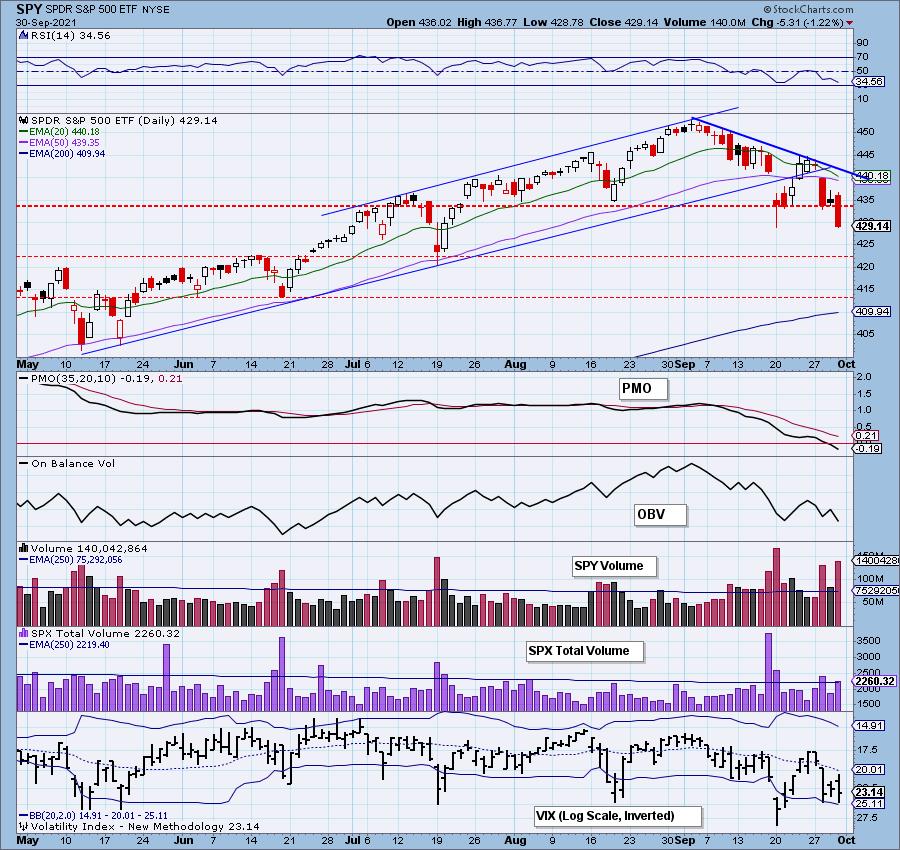
Total volume expanded and finished above the annual average so that is in line with a climax day.
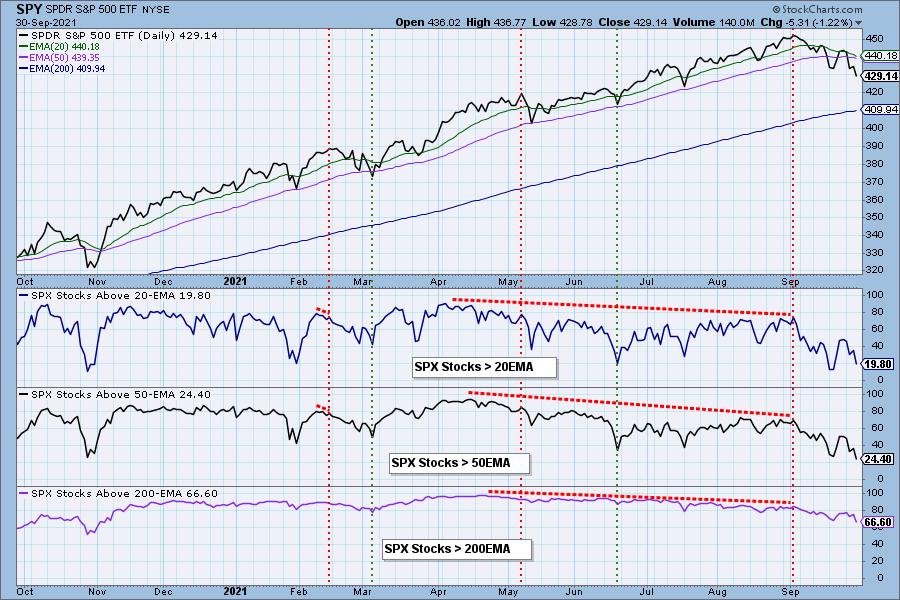
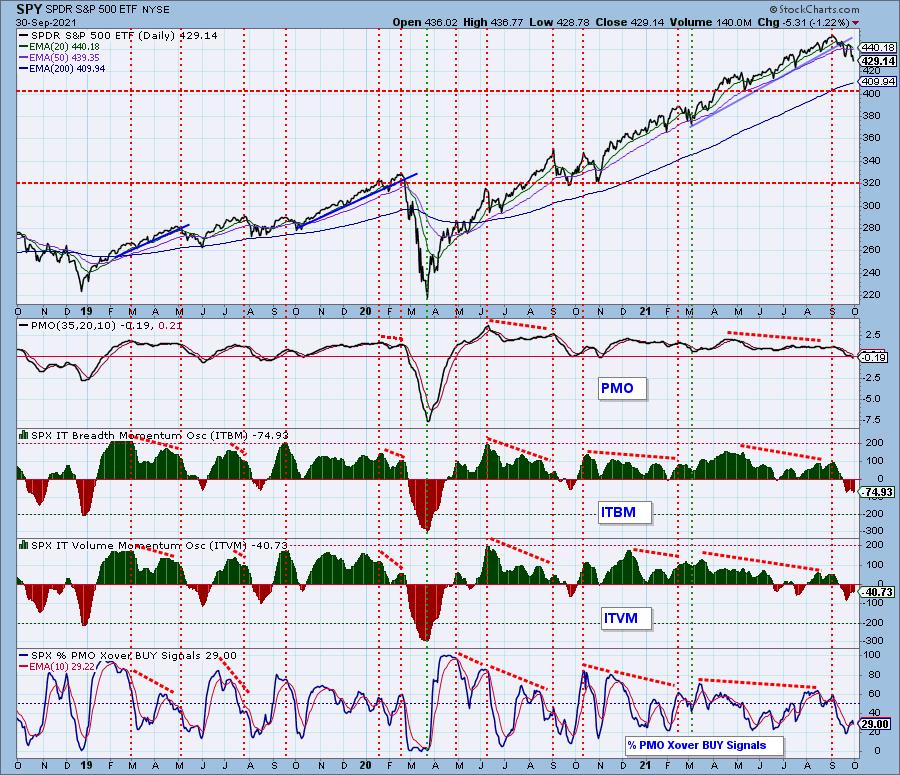
Participation: The following chart uses different methodologies for objectively showing the depth and trend of participation for intermediate- and long-term time frames.
- The Silver Cross Index (SCI) shows the percentage of SPX stocks on IT Trend Model BUY signals (20-EMA > 50-EMA).
- The Golden Cross Index (GCI) shows the percentage of SPX stocks on LT Trend Model BUY signals (50-EMA > 200-EMA).
- The Bullish Percent Index (BPI) shows the percentage of SPX stocks on Point & Figure BUY signals.
It's visible in the thumbnail that both the SCI and GCI have topped below their signal lines which is very bearish.
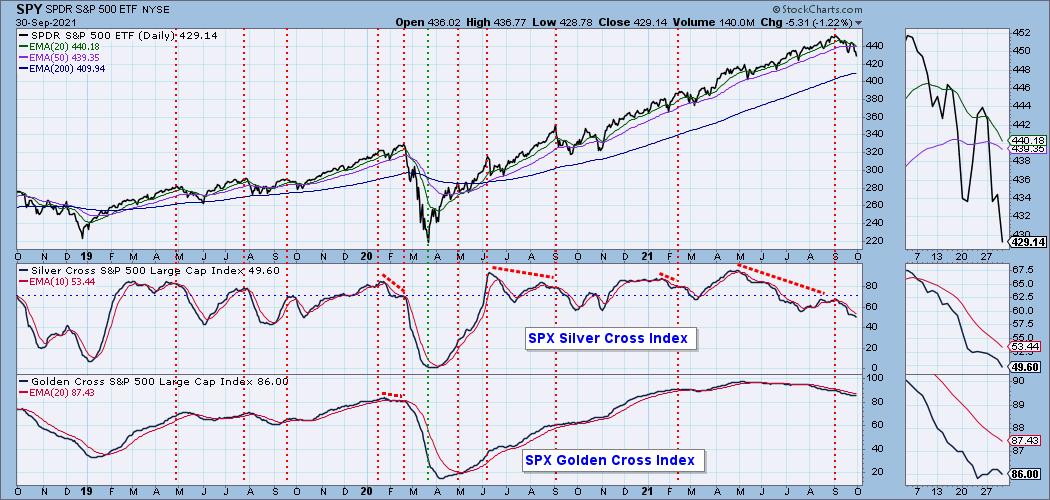
Participation slid further into oversold territory.
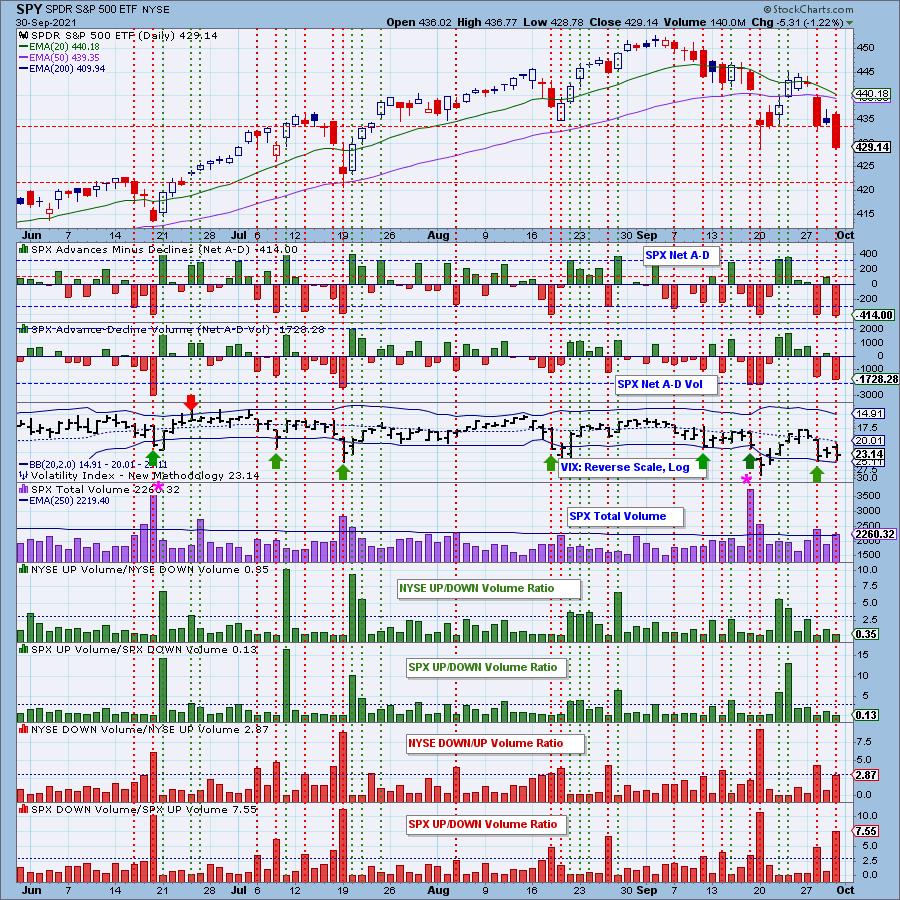
Climax Analysis: Today's climax is considered a downside exhaustion climax. We had outside readings on Net A-D and nearly saw outside readings on Net A-D Volume. Besides elevated total volume, we see that both the NYSE and SPX Volume Ratios spiked, alerting us to this climax day. Why is it an exhaustion climax? Mainly because it is coming off a downside initiation climax on Tuesday. Another indicator that isn't in line with a climax day is the VIX. It hasn't yet punctured the lower Bollinger Band on the inverted scale. This tells us we could be in for some more downside before a rally.
Short-Term Market Indicators: The short-term market trend is DOWN and the condition is OVERBOUGHT.
STOs continued lower and neither are oversold. This also suggests more downside ahead.
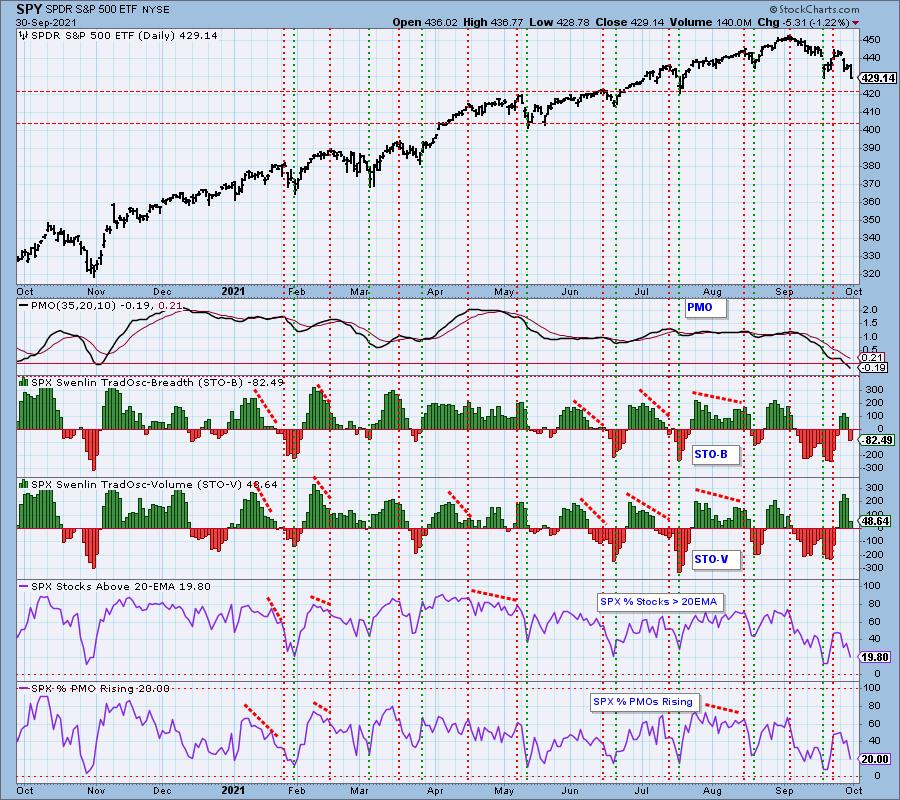
Intermediate-Term Market Indicators: The intermediate-term rising market trend has been BROKEN and the condition is OVERSOLD.
Both the ITBM/ITVM fell and are very oversold. The ITVM isn't as low as it was on the last bottom and suggests to me these could move even lower.
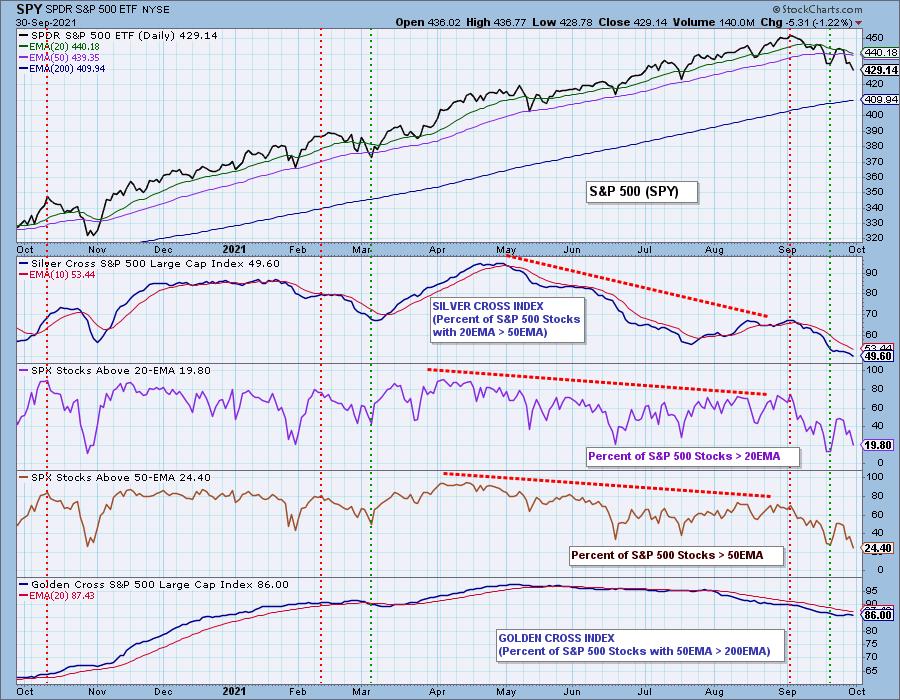
Bias Assessment: It occurred to us that one of the ways we can measure market bias is to compare the SCI to the percent of stocks above their 20/50-EMAs. When the percentages are lower than the SCI, the market bias is bearish and if they are higher, it is bullish. Any "mechanical" signal requires additional analysis to confirm the numbers.
The market bias is getting very bearish as participation sinks quickly, moving percentages well below the SCI reading. The good news is all of the indicators are oversold.
CONCLUSION: We could be looking at the completion of Tuesday's downside initiation climax given today's selling exhaustion climax. However, the STOs suggest this short-term decline isn't quite over. We could see a bounce tomorrow, but I get the feeling we haven't seen traders fully capitulate. The best news is that indicators are getting very oversold. The bad news is the bearish bias is strong right now. I don't think the selling is over. This exhaustion likely signals a pause in selling, not the end of selling.
I'm 70% exposed to the market, but have rotated out of aggressive positions and into more energy and materials stocks.
Have you subscribed the DecisionPoint Diamonds yet? DP does the work for you by providing handpicked stocks/ETFs from exclusive DP scans! Add it with a discount! Contact support@decisionpoint.com for more information!
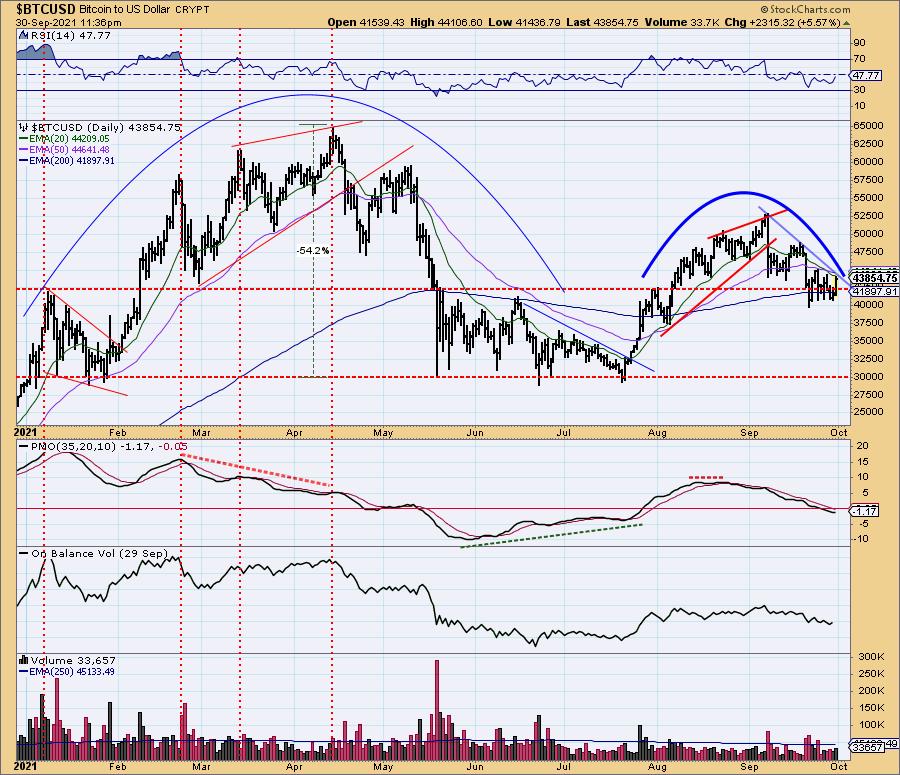
BITCOIN
Bitcoin rallied today but remains below resistance at the 20/50-EMAs. The declining trend has not yet been broken, but it is getting close. The RSI is improving but is still negative. The PMO is ticked up slightly. I won't believe this is a bottom until the declining trend is broken and price can remain above the 20/50-EMAs for more than a day or two.
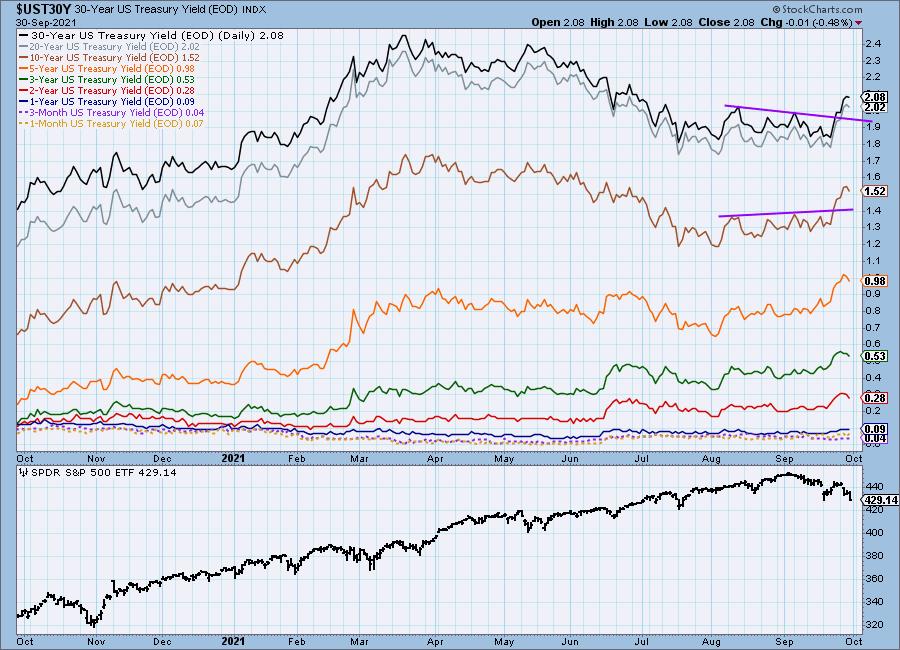
INTEREST RATES
Yields are breaking out which will favor Financials but decimate Bonds.
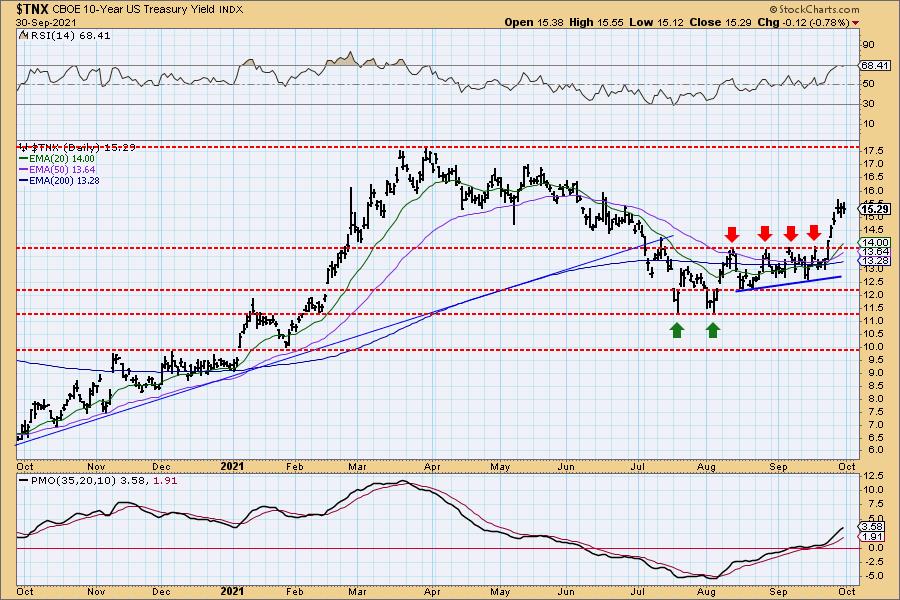
10-YEAR T-BOND YIELD
Looks as though yields are pausing after shooting up earlier this week. The chart is still very bullish as price is forming a bull flag and the PMO is still rising strongly.
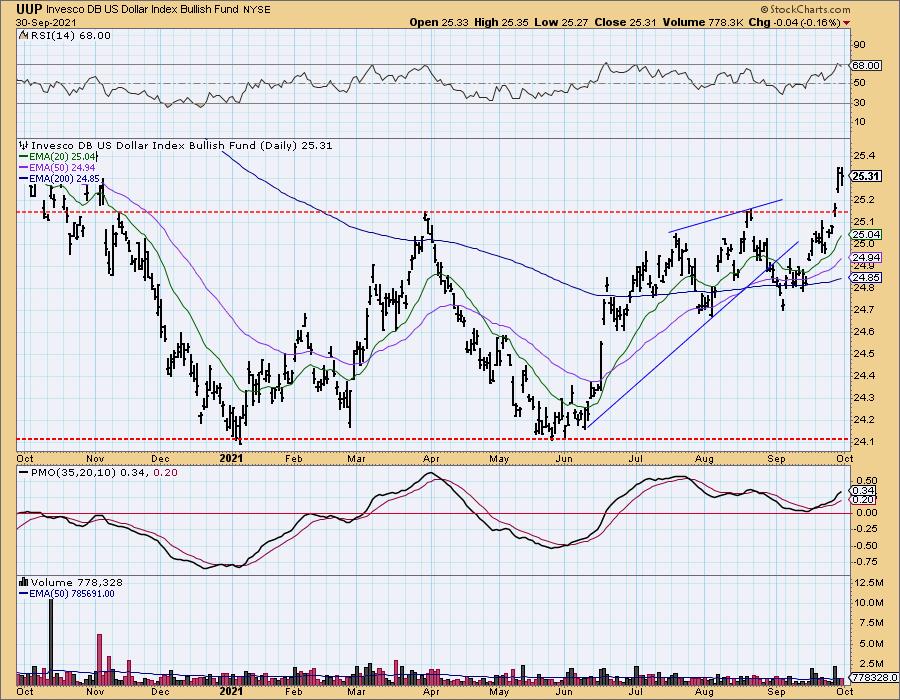
DOLLAR (UUP)
IT Trend Model: BUY as of 6/22/2021
LT Trend Model: BUY as of 8/19/2021
UUP Daily Chart: UUP took a pause today. The indicators are still very bullish so I expect the Dollar to continue its rally.
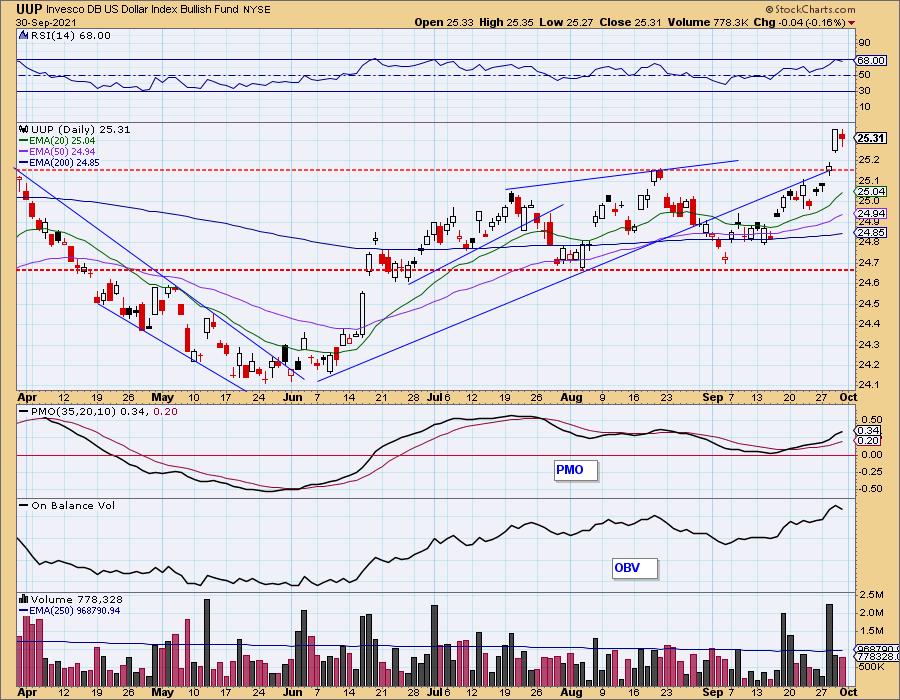
It appears the large double-bottom is finally seeing results with price soaring above the confirmation line. We could see a pause, but overall look for the Dollar to rise even higher.
GOLD
IT Trend Model: NEUTRAL as of 6/24/2021
LT Trend Model: SELL as of 8/9/2021
GLD Daily Chart: Today's bounce for GLD is very encouraging. It comes off support at the August low. The PMO is turning back up and the RSI, while negative, is rising strongly. As with Bitcoin, we need to see the declining trend broken and price to get back above the 20-EMA at a minimum. I won't get bullish on Gold until I see some serious follow-through.
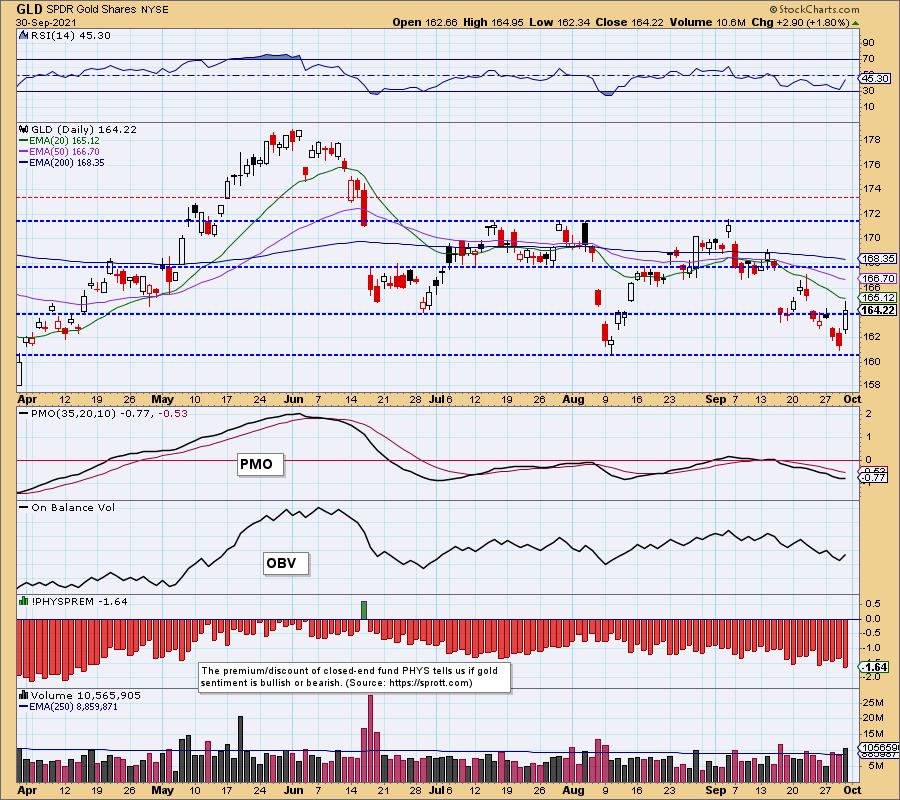
(Full disclosure: I own GLD as a long-term buy and hold position.)
GOLD Daily Chart: Discounts continue to expand, telling us investors are very bearish on Gold right now. It's bearish enough to look for a rally here, but as I implied above, Gold has some work to do before we can get bullish.
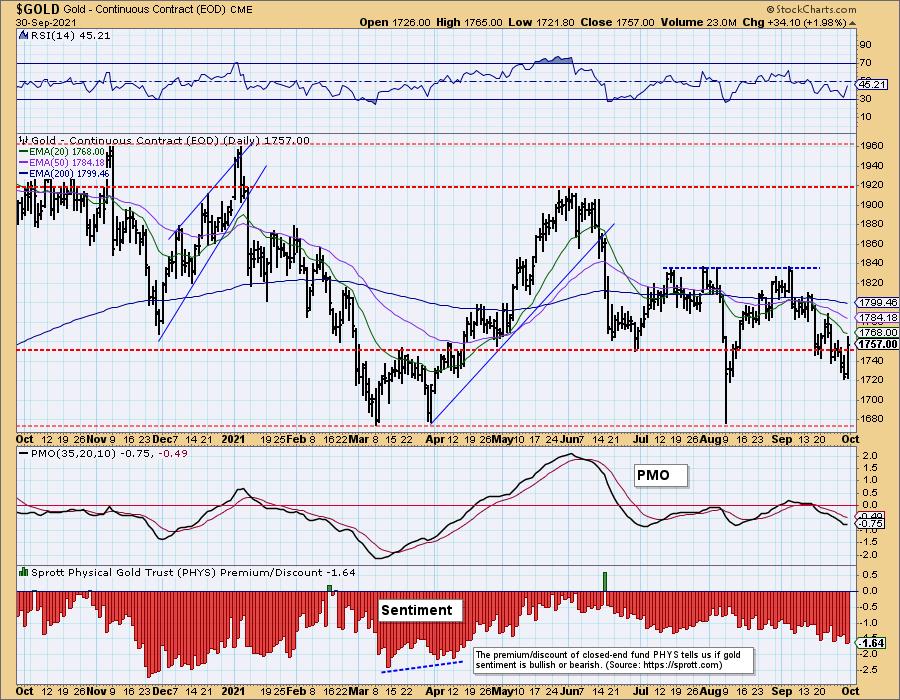
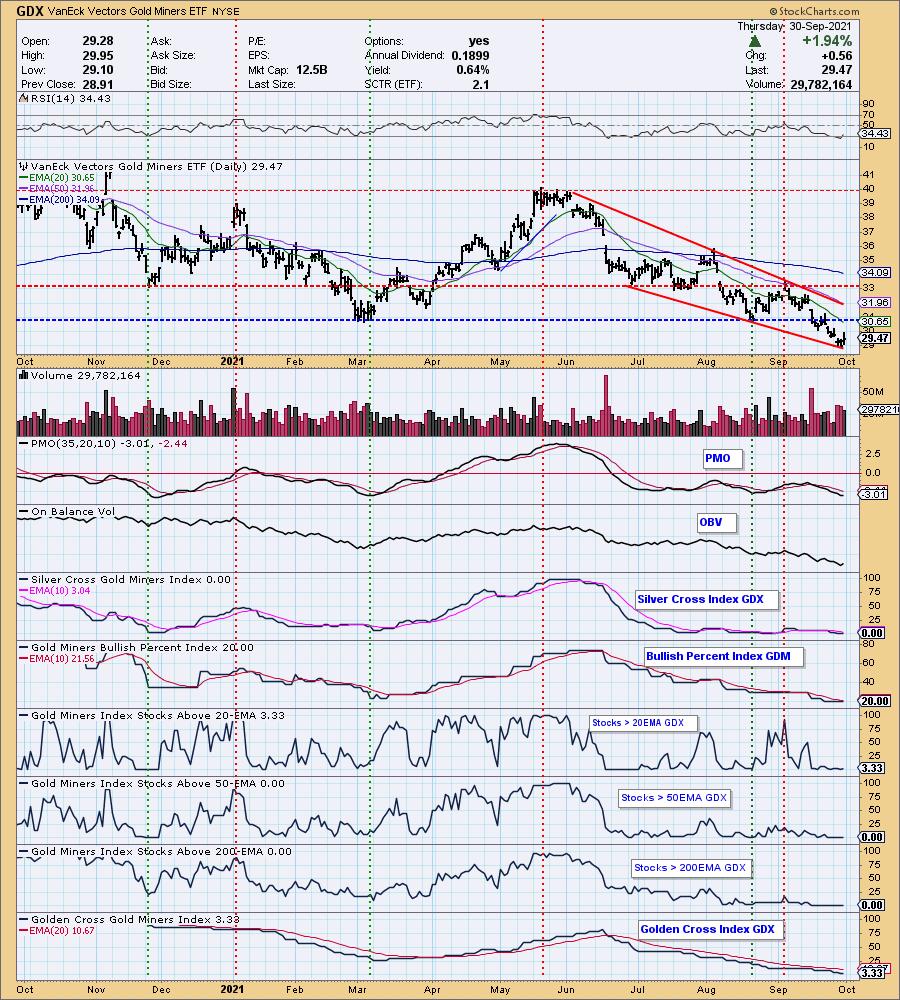
GOLD MINERS Golden and Silver Cross Indexes: Gold Miners bounced of the bottom of the bullish falling wedge. Much of this could be attributed to the rally in Gold today as GDX was up by about the same percentage as Gold. I wouldn't go 'all in' on this industry group given there is no heartbeat as far as participation. Only about 3% have price ABOVE their 200-EMA! Talk about a bearish configuration. Don't count on this rally lasting.
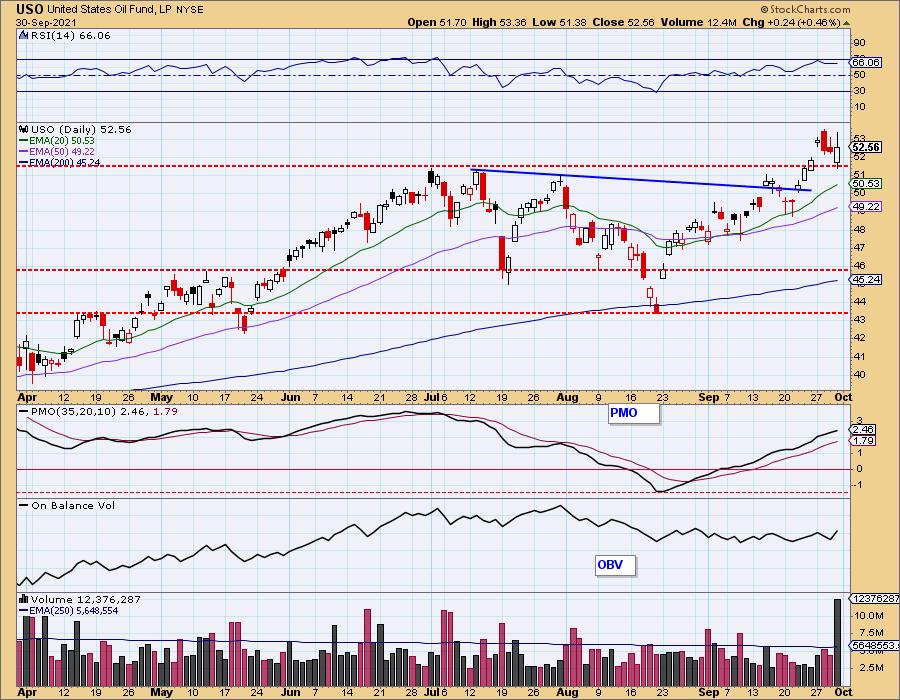
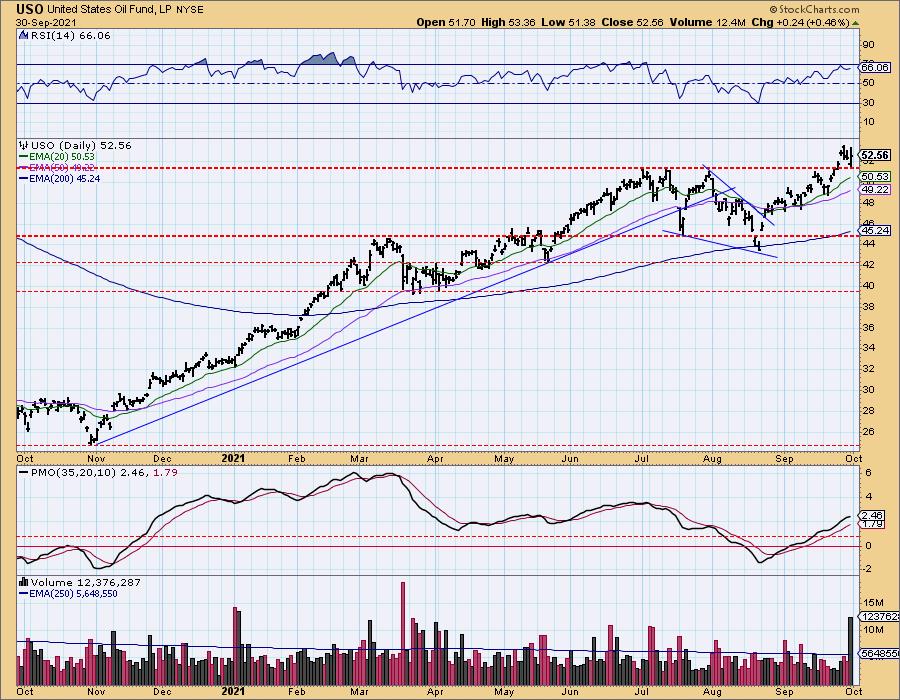
CRUDE OIL (USO)
IT Trend Model: BUY as of 9/7/2021
LT Trend Model: BUY as of 3/9/2021
USO Daily Chart: USO has formed a short-term bull flag. I like the pullback toward the breakout point that finished with a rebound and a positive close for USO. The RSI is positive and the PMO is rising and is not overbought. We remain bullish on Crude Oil.
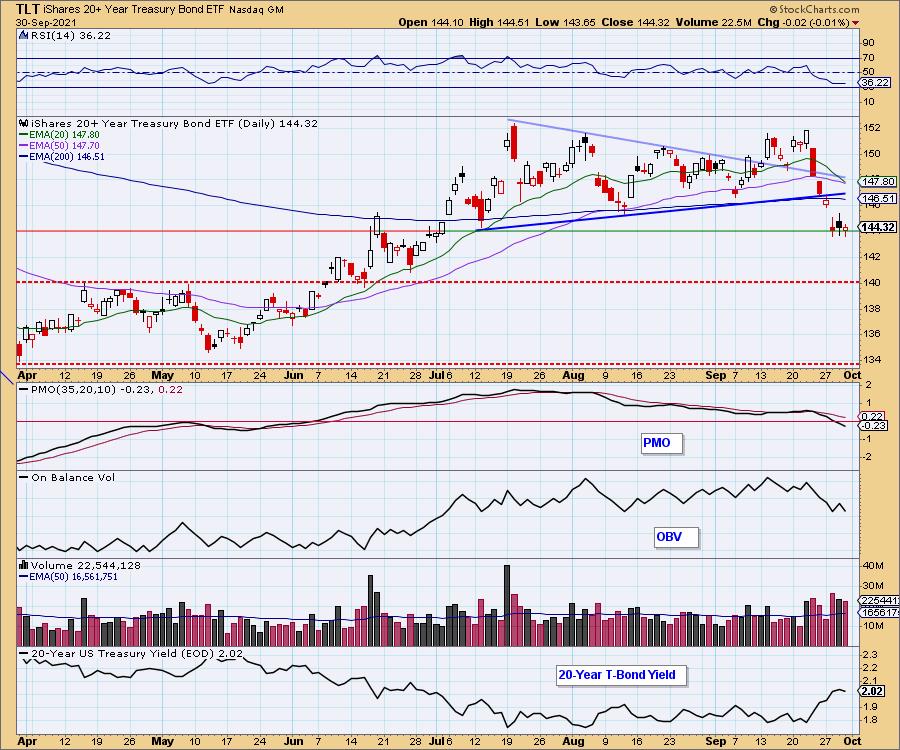
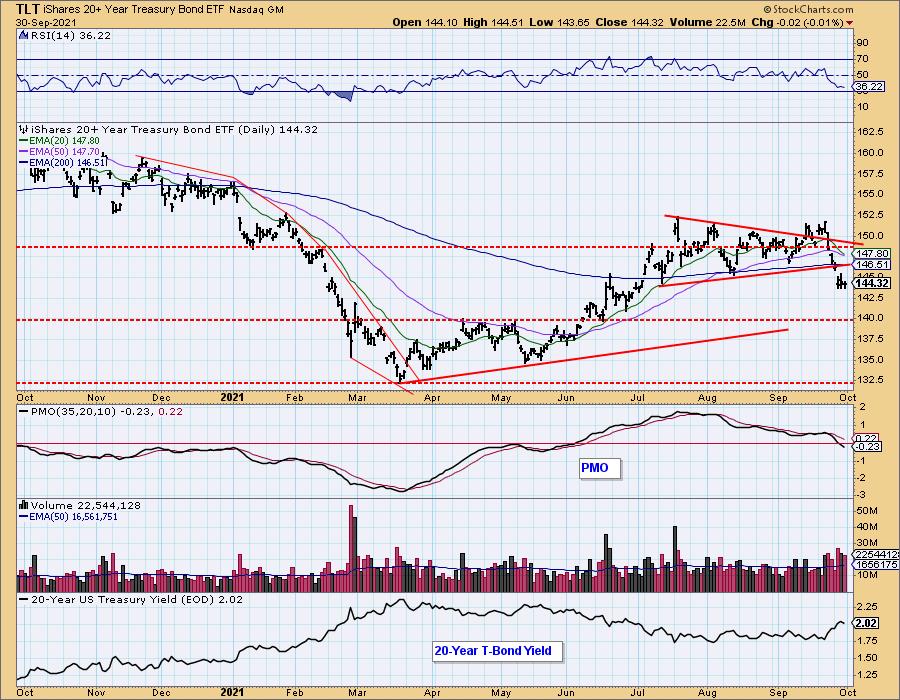
BONDS (TLT)
IT Trend Model: BUY as of 6/10/2021
LT Trend Model: BUY as of 8/10/2021
TLT Daily Chart: TLT is clinging to support at the July low. This support line is tenuous at best given it only aligns with one bottom. The RSI is firmly planted in negative territory and the PMO is continuing its slide. More than likely TLT will test stronger support at the April/May tops and corresponding June low.
Technical Analysis is a windsock, not a crystal ball.
--Erin Swenlin
(c) Copyright 2021 DecisionPoint.com
Disclaimer: This blog is for educational purposes only and should not be construed as financial advice. The ideas and strategies should never be used without first assessing your own personal and financial situation, or without consulting a financial professional. Any opinions expressed herein are solely those of the author, and do not in any way represent the views or opinions of any other person or entity.
NOTE: The signal status reported herein is based upon mechanical trading model signals, specifically, the DecisionPoint Trend Model. They define the implied bias of the price index based upon moving average relationships, but they do not necessarily call for a specific action. They are information flags that should prompt chart review. Further, they do not call for continuous buying or selling during the life of the signal. For example, a BUY signal will probably (but not necessarily) return the best results if action is taken soon after the signal is generated. Additional opportunities for buying may be found as price zigzags higher, but the trader must look for optimum entry points. Conversely, exit points to preserve gains (or minimize losses) may be evident before the model mechanically closes the signal.
Helpful DecisionPoint Links:
DecisionPoint Alert Chart List
DecisionPoint Golden Cross/Silver Cross Index Chart List
DecisionPoint Sector Chart List
Price Momentum Oscillator (PMO)
Swenlin Trading Oscillators (STO-B and STO-V)
DecisionPoint is not a registered investment advisor. Investment and trading decisions are solely your responsibility. DecisionPoint newsletters, blogs or website materials should NOT be interpreted as a recommendation or solicitation to buy or sell any security or to take any specific action.