
We have a freak storm plowing through our area in Southern California. There's been buckets of rain, some hail and lots of thunder and lightning. My golden retriever is scared out of his mind. So, it's been interesting working off my hotspot given power has been out for about an hour or so now. I think a cell tower went down because the graphics are struggling to load which never happens with my hotspot in my home. Anyway, let's get down to business.
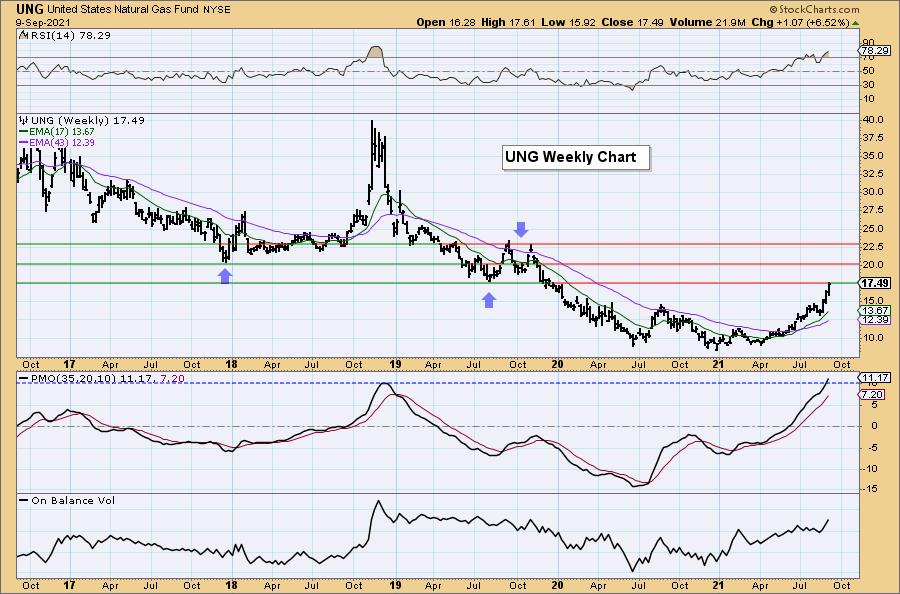
I have been keeping an eye on UNG of late. I think the weekly chart is worth a viewing. Price has been rising quickly but it appears it is finally reaching some strong overhead resistance now. I marked three levels of resistance. Price is already tapping on the door of the resistance line drawn from the mid-2019 low. Next up is resistance at the 2017 low. After that we have resistance at the 2019 double-top. These resistance zones could be a problem especially given that the weekly RSI is so overbought. The weekly PMO is positive and rising, but is now at overbought extremes. If you are fortunate enough to have UNG in your portfolio, I would consider setting a trailing or hard stop now.
The DecisionPoint Alert Weekly Wrap presents an end-of-week assessment of the trend and condition of the Stock Market, the U.S. Dollar, Gold, Crude Oil, and Bonds. The DecisionPoint Alert daily report (Monday through Thursday) is abbreviated and gives updates on the Weekly Wrap assessments.
Watch the latest episode of DecisionPoint on StockCharts TV's YouTube channel here!
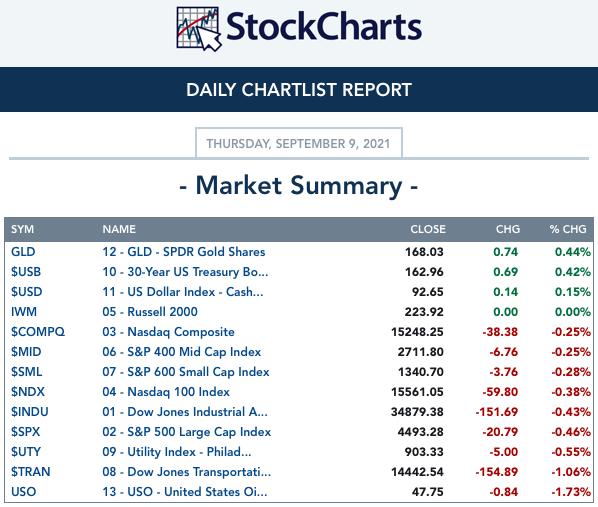
MAJOR MARKET INDEXES
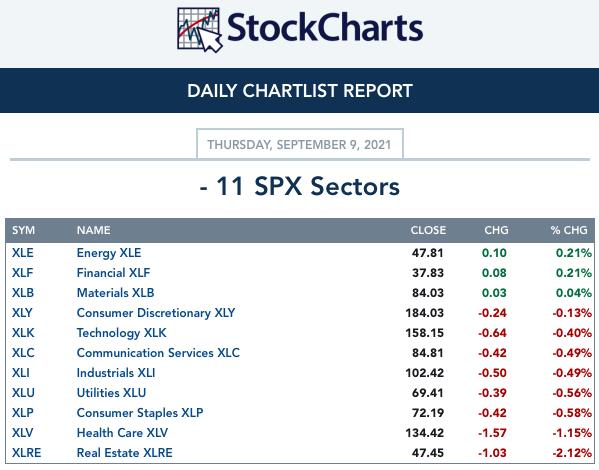
SECTORS
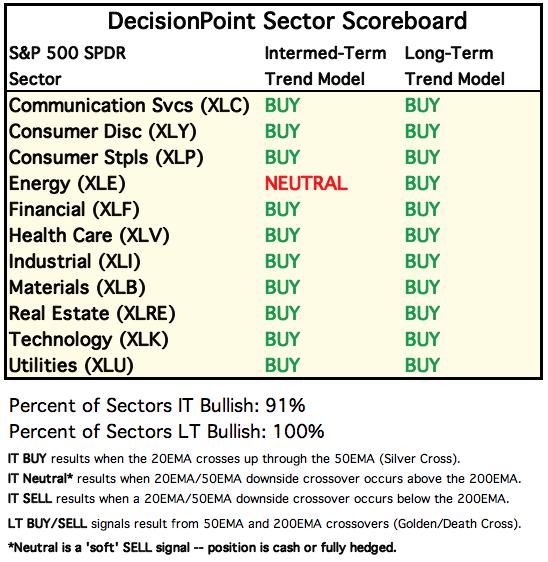
Each S&P 500 Index component stock is assigned to one, and only one, of 11 major sectors. This is a snapshot of the Intermediate-Term (Silver Cross) and Long-Term (Golden Cross) Trend Model signal status for those sectors.
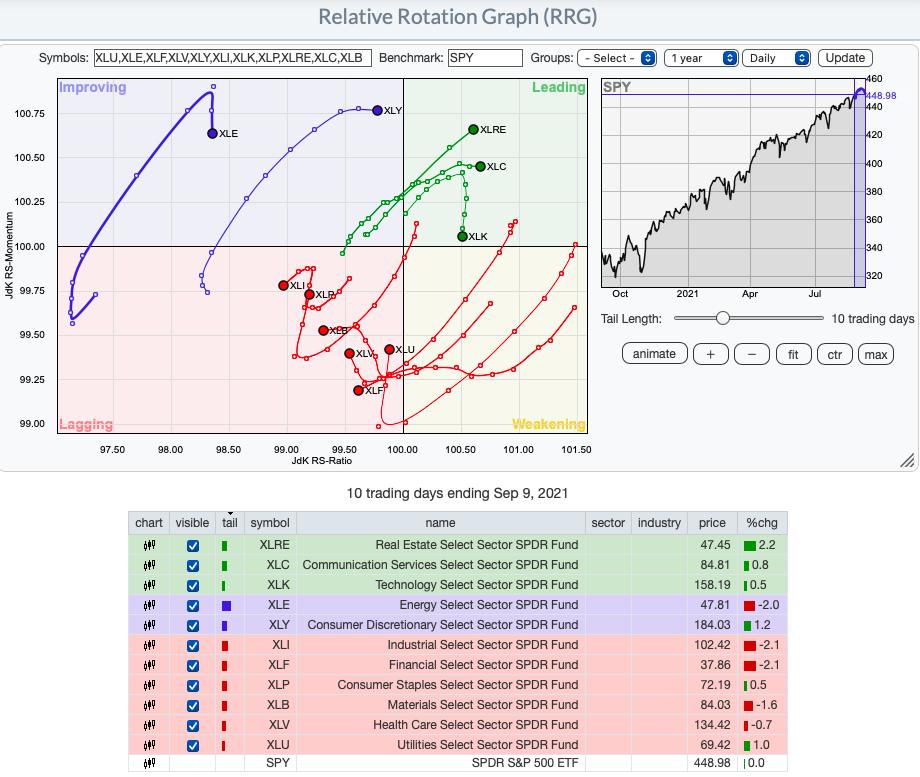
RRG® Chart: XLK is fading fast, but remains in Leading. Other than the Leading sectors and XLY, the rest are Lagging or in XLE's case, traveling southward toward Lagging.

Don't miss the RECORDING of Mr. RRG, Julius de Kempanear's appearance in the FREE DP Trading Room from Monday!
Topic: DecisionPoint Trading Room
Start Time : Sep 7, 2021 08:45 AM
Meeting Recording Link HERE.
Access Passcode: Sept@7th
If you haven't registered for the free Trading Room yet, here is the LINK.
CLICK HERE for an animated version of the RRG chart.
CLICK HERE for Carl's annotated Sector charts.
THE MARKET (S&P 500)
IT Trend Model: BUY as of 5/8/2020
LT Trend Model: BUY as of 6/8/2020
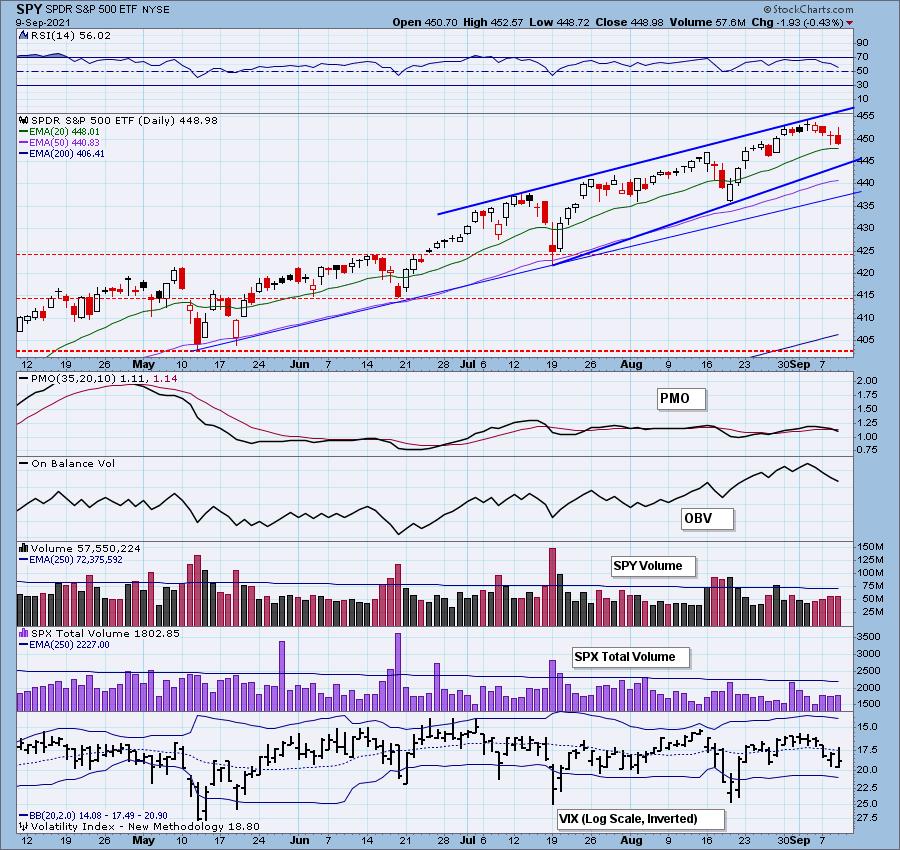
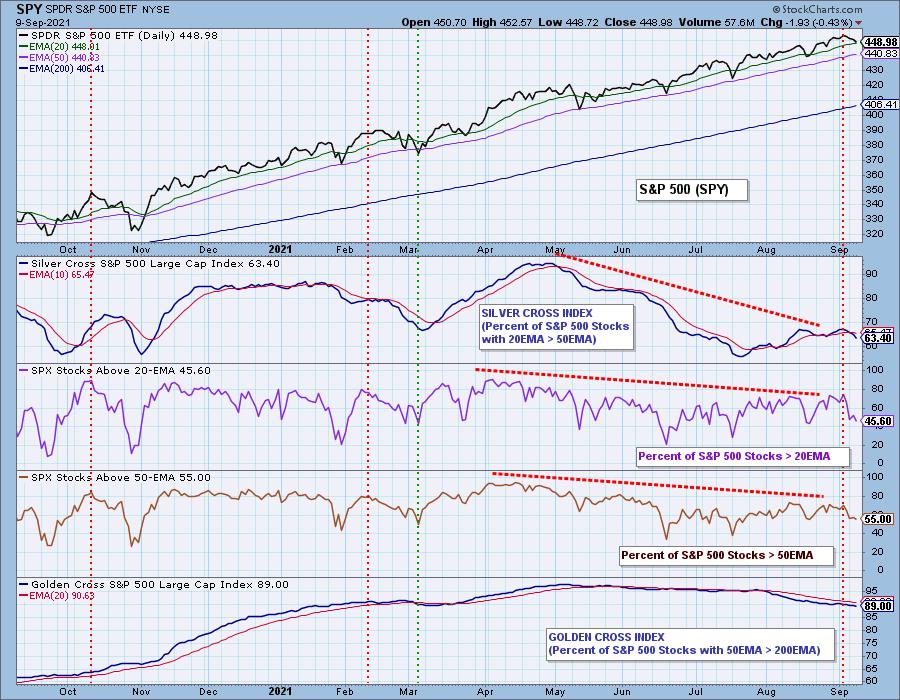
SPY Daily Chart: The "morning star doji" never formed. It required an up day for that to happen. The market continues to pullback, but the 20-EMA has not yet been tested. The RSI is now headed toward negative territory and the PMO had a crossover SELL signal.
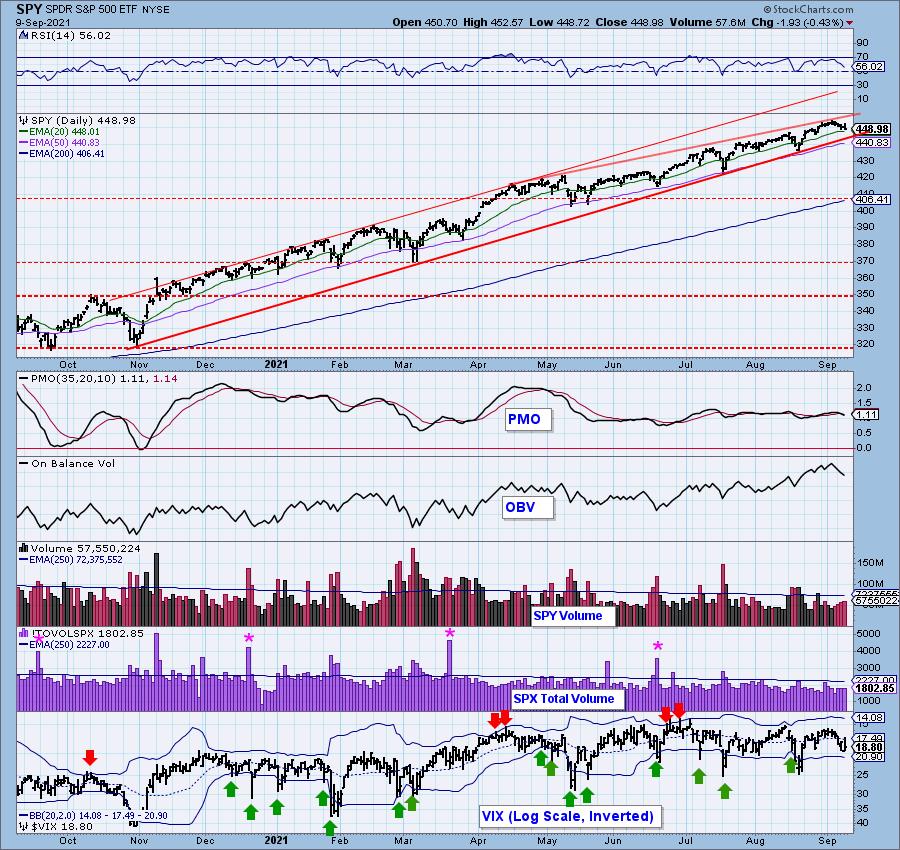
The longer term rising wedge is still a problem. Price has continually failed to reach the top of the rising trend channel.
Participation: The following chart uses different methodologies for objectively showing the depth and trend of participation for intermediate- and long-term time frames.
- The Silver Cross Index (SCI) shows the percentage of SPX stocks on IT Trend Model BUY signals (20-EMA > 50-EMA).
- The Golden Cross Index (GCI) shows the percentage of SPX stocks on LT Trend Model BUY signals (50-EMA > 200-EMA).
- The Bullish Percent Index (BPI) shows the percentage of SPX stocks on Point & Figure BUY signals.
Not surprisingly, the SCI is continuing lower while the GCI was unchanged.
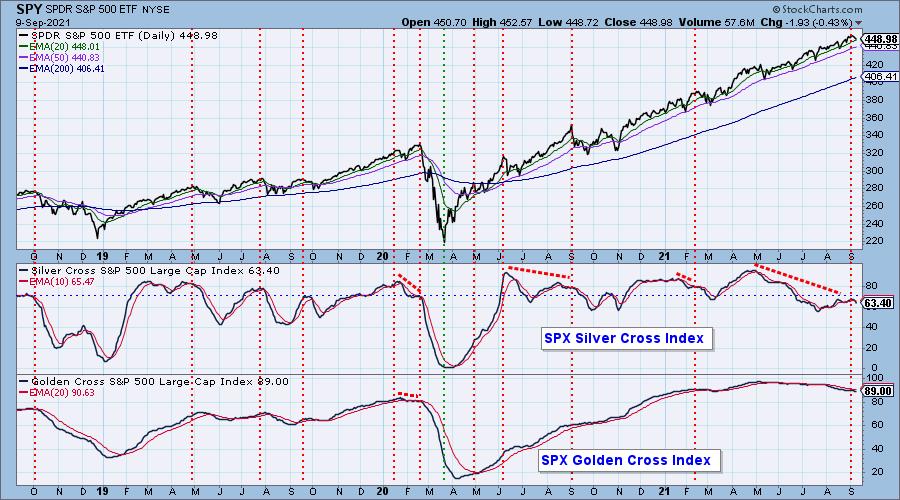
Participation continues to trail off but is beginning to reach near-term oversold territory.
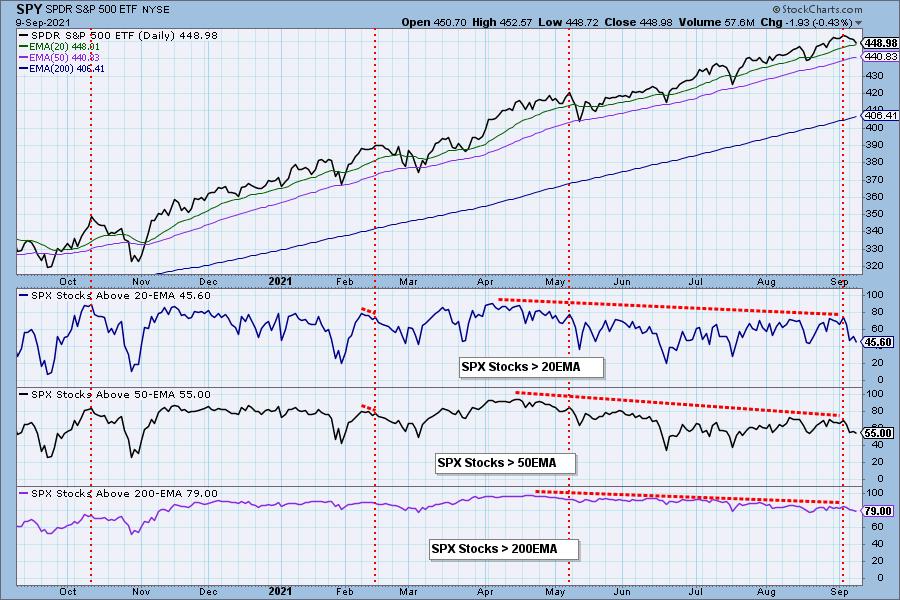
Climax Analysis: No climax today. The VIX remains beneath its EMA on the inverted scale which suggests internal weakness. We would like to see it puncture the lower Bollinger Band as that usually leads to an upside reversal. Total Volume was mostly unchanged from the last two days.
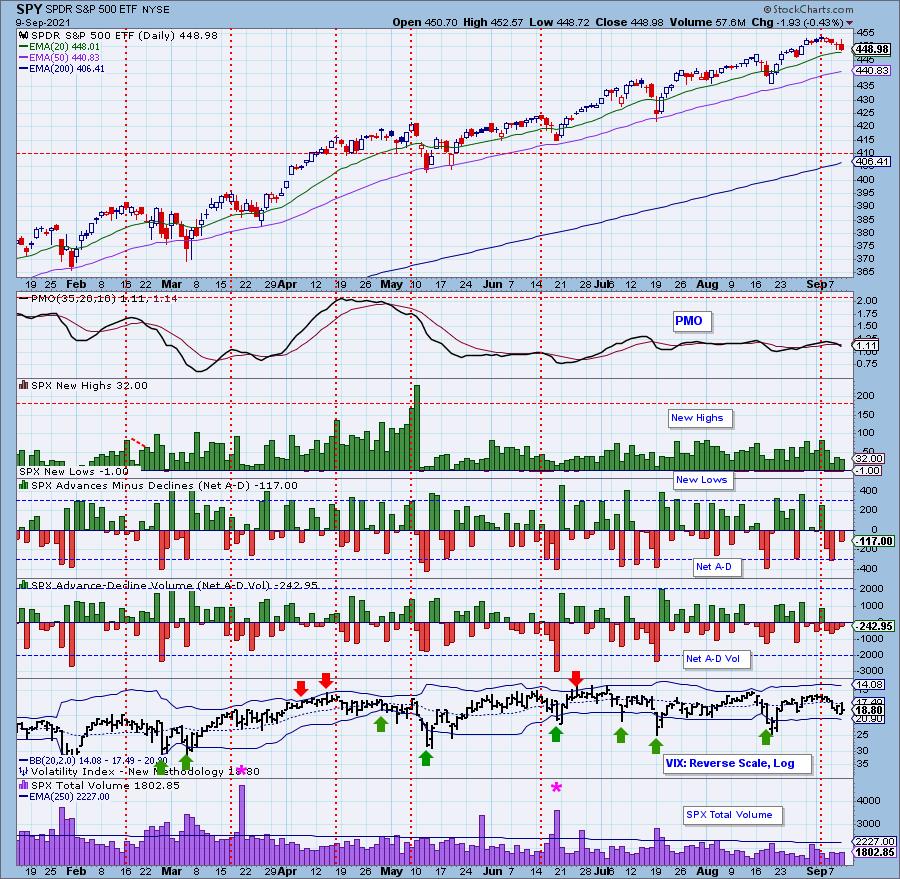
Short-Term Market Indicators: The short-term market trend is DOWN and the condition is SOMEWHAT OVERSOLD.
STOs continue lower and are in somewhat overbought territory. %Stocks with rising momentum has fallen considerably. We now only have about a quarter of the SPX with rising momentum.
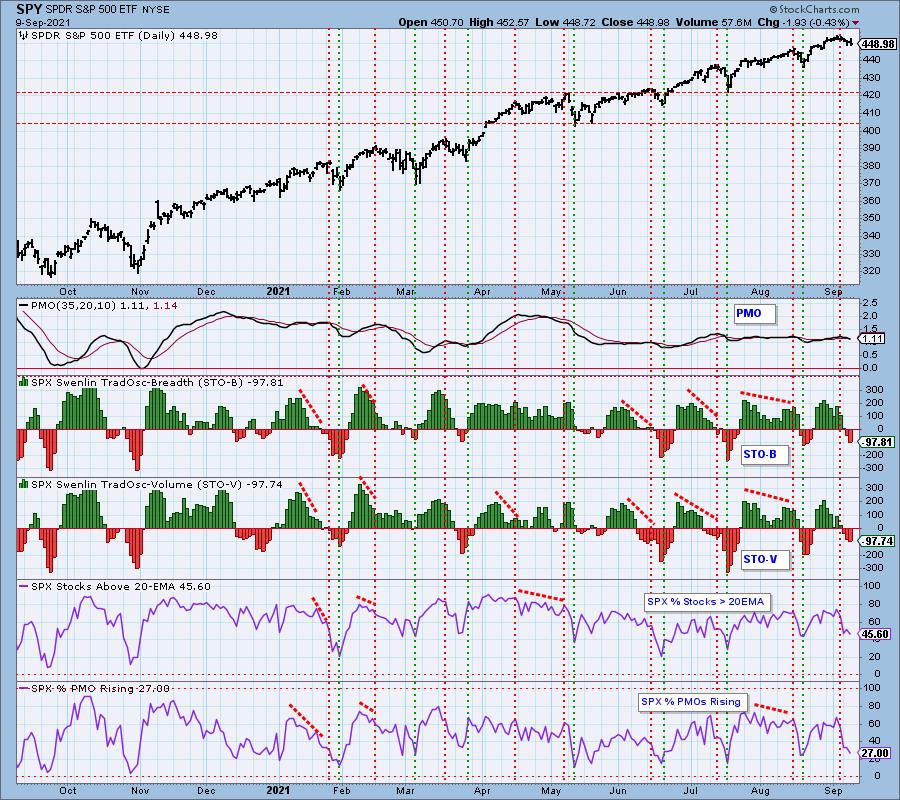
Intermediate-Term Market Indicators: The intermediate-term market trend is UP and the condition is OVERBOUGHT.
IT indicators are continuing to move lower and less than half of the SPX have crossover BUY signals.
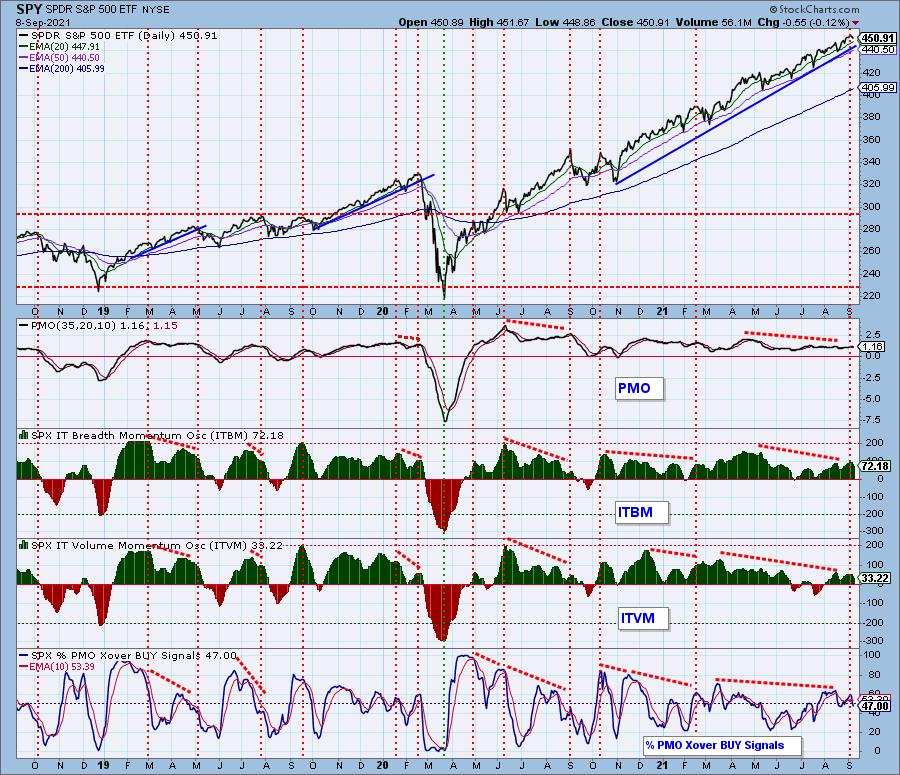
Bias Assessment: It occurred to us that one of the ways we can measure market bias is to compare the SCI to the percent of stocks above their 20/50-EMAs. When the percentages are lower than the SCI, the market bias is bearish and if they are higher, it is bullish. Any "mechanical" signal requires additional analysis to confirm the numbers.
As with yesterday, the bearish bias continues as participation percentages are lower than the SCI reading. Since EMAs move in the direction of price, there's no way for the SCI to move higher unless more stocks have price above their 20/50-EMAs.
CONCLUSION: The market is showing weakness across the board, but indicators aren't oversold enough to look for a reversal. The 20-EMA has presented itself as a possible reversal point, but it seems more likely that the bottom of the rising wedge will be tested again. I trust the STOs and they continue to move lower so I would look for lower prices tomorrow and likely next week.
Have you subscribed the DecisionPoint Diamonds yet? DP does the work for you by providing handpicked stocks/ETFs from exclusive DP scans! Add it with a discount! Contact support@decisionpoint.com for more information!
BITCOIN
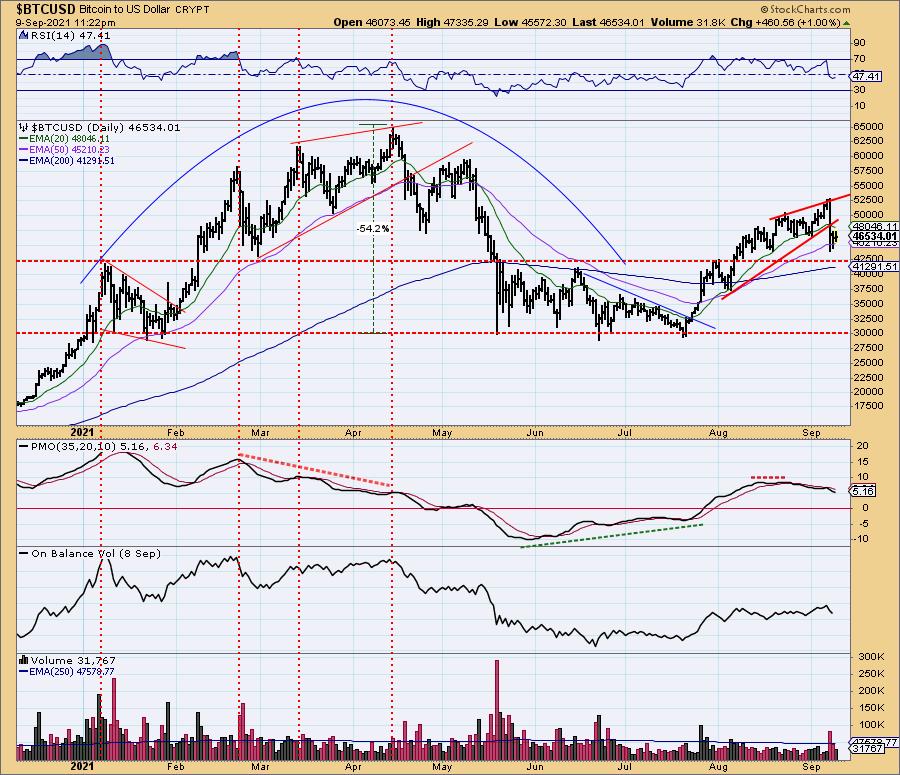
Bitcoin has formed a bearish reverse flag formation. If it executes, the minimum downside target could take Bitcoin as low as $37,500. On the bright side support is near at the 200-EMA and $42,500.
INTEREST RATES
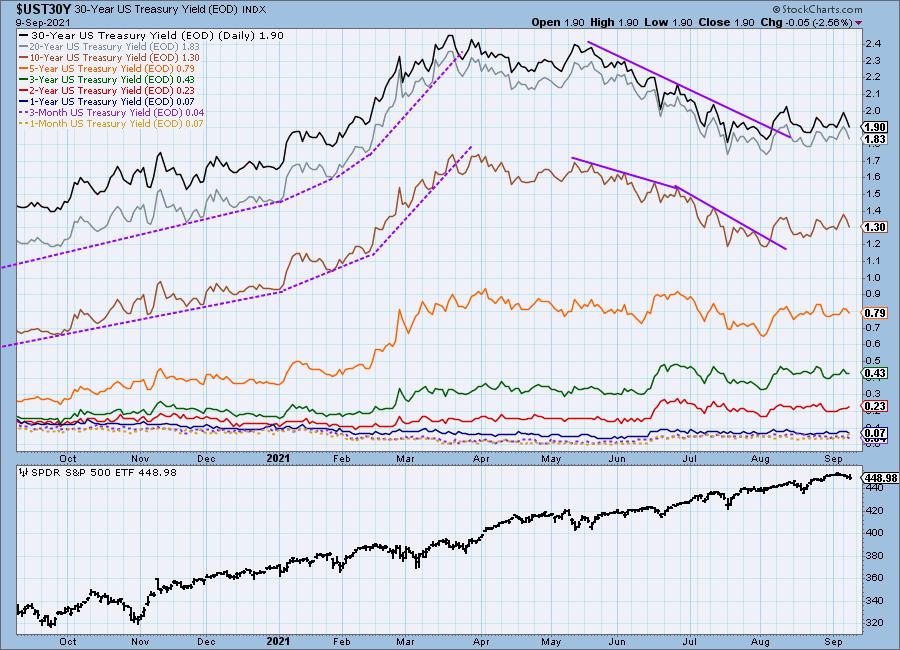
Yields are moving mostly sideways since breaking out of their declining trend.
10-YEAR T-BOND YIELD
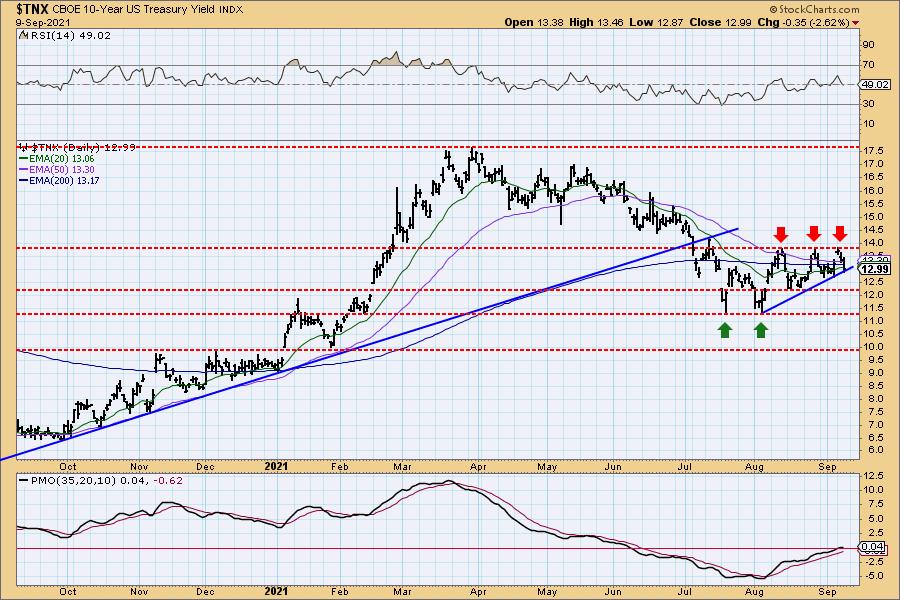
We can see a bullish ascending triangle. Price was unable to breakout on this third try. It is now sitting on the bottom of the triangle along rising bottoms. The RSI is mostly neutral and the PMO is flat. Not many clues here except the bullish triangle.
DOLLAR (UUP)
IT Trend Model: BUY as of 6/22/2021
LT Trend Model: BUY as of 8/19/2021
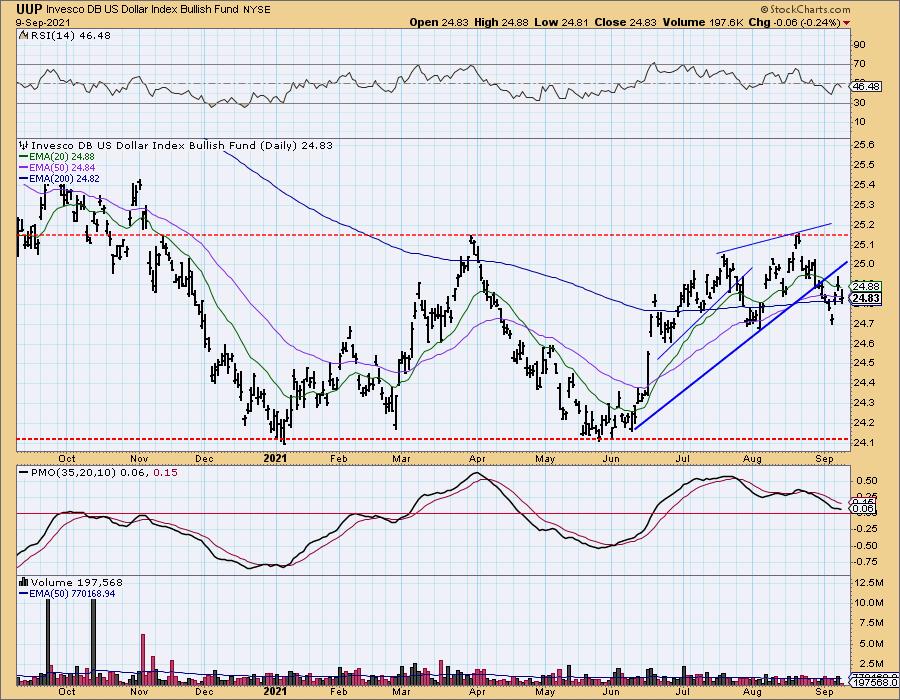
UUP Daily Chart: UUP made another trip down to test the 200-EMA after failing to recapture the short-term rising trend. This decline executed the bearish rising wedge and this last rally failure suggests price will move lower.
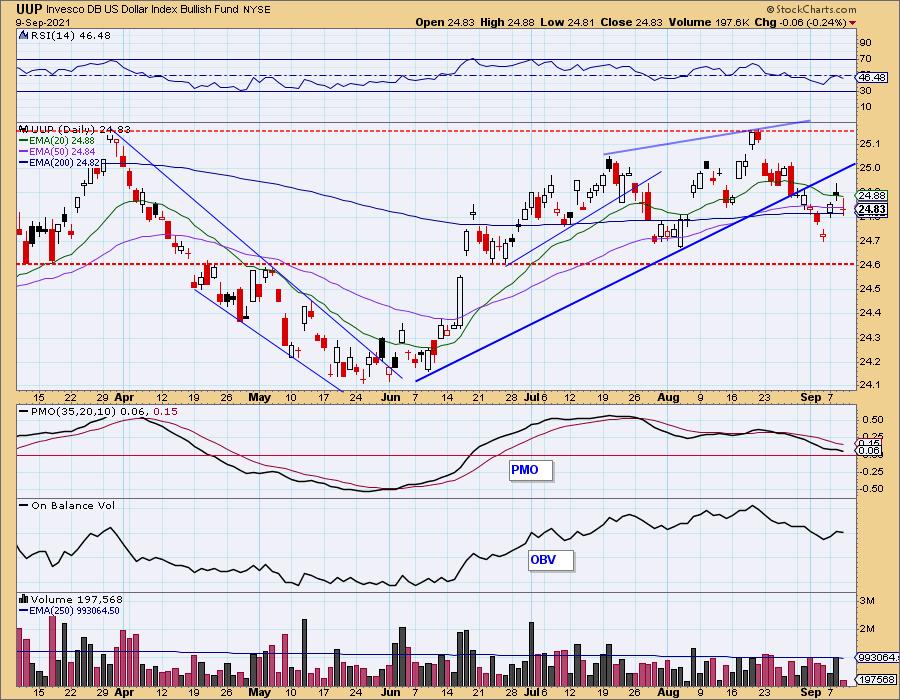
The RSI turned down before reaching positive territory. This also leads me to believe UUP will continue to fall.
GOLD
IT Trend Model: NEUTRAL as of 6/24/2021
LT Trend Model: SELL as of 8/9/2021
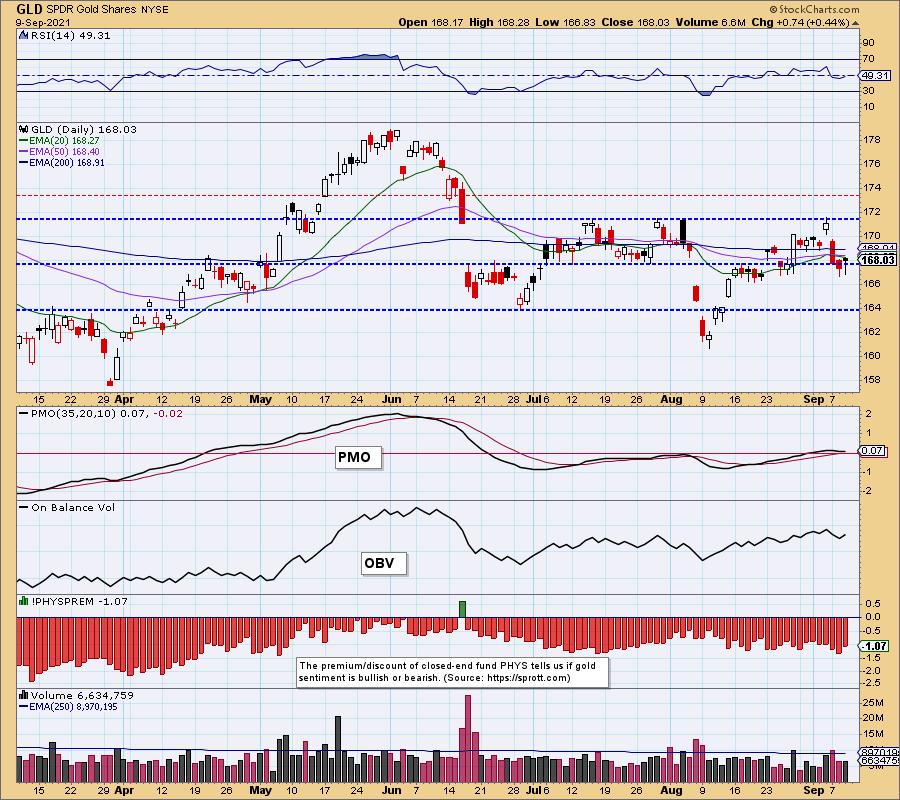
GLD Daily Chart: Gold formed a bullish hammer candlestick, but price didn't get back above the 20/50-EMAs. If my read on the Dollar is correct, we should see GLD test overhead resistance at the top of the July trading range.
(Full disclosure: I own GLD)
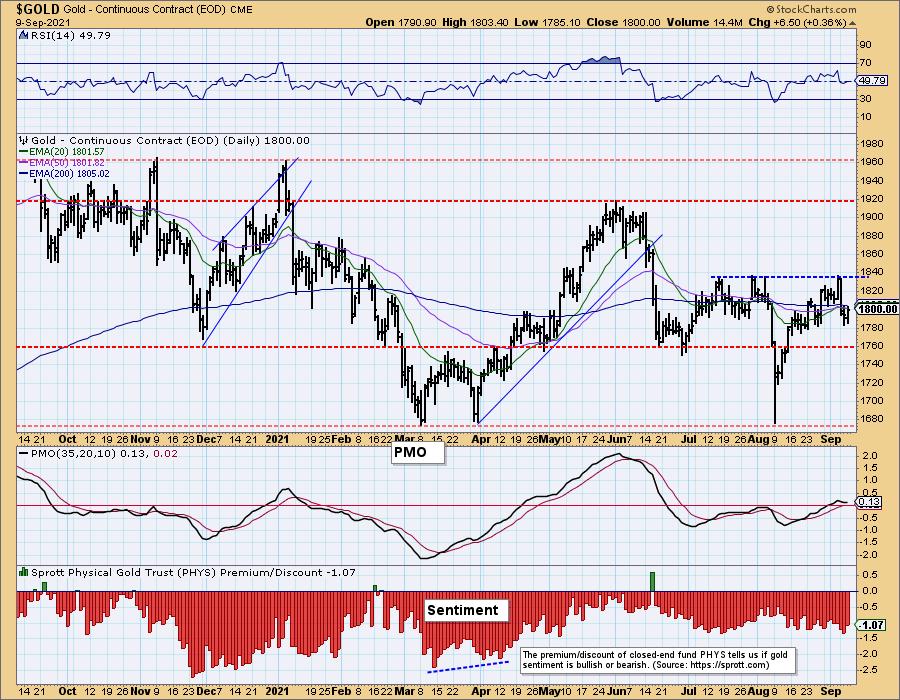
GOLD Daily Chart: $GOLD looks ready to test support at $1760. I don't like its inability to get above those key moving averages, but a failure in the Dollar could get it going.
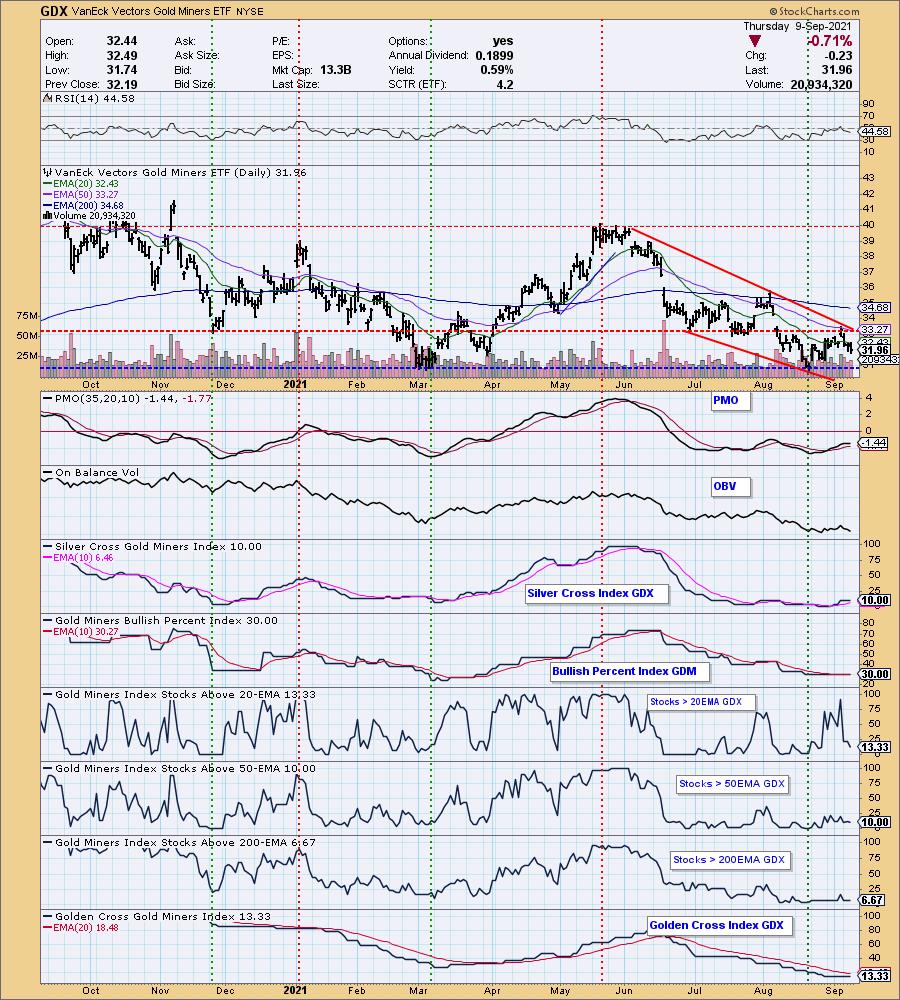
GOLD MINERS Golden and Silver Cross Indexes: Yesterday's comments still apply:
"Gold Miners were down today. Price is now testing the very short-term rising bottoms trendline. The SCI is flat and participation is still lacking. Be prepared for a likely test of the March/August lows."
CRUDE OIL (USO)
IT Trend Model: BUY as of 9/7/2021
LT Trend Model: BUY as of 3/9/2021
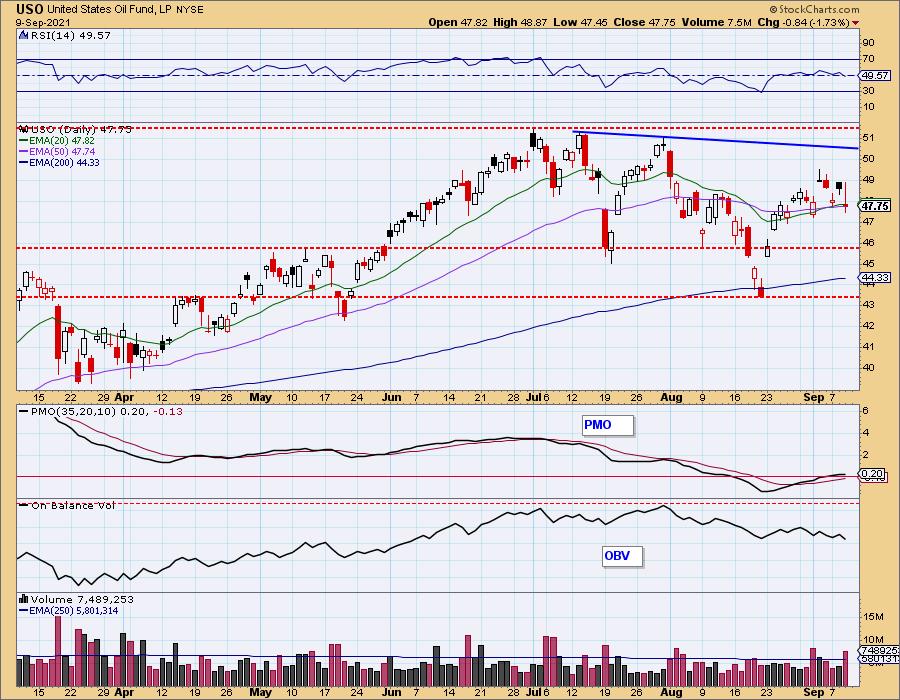
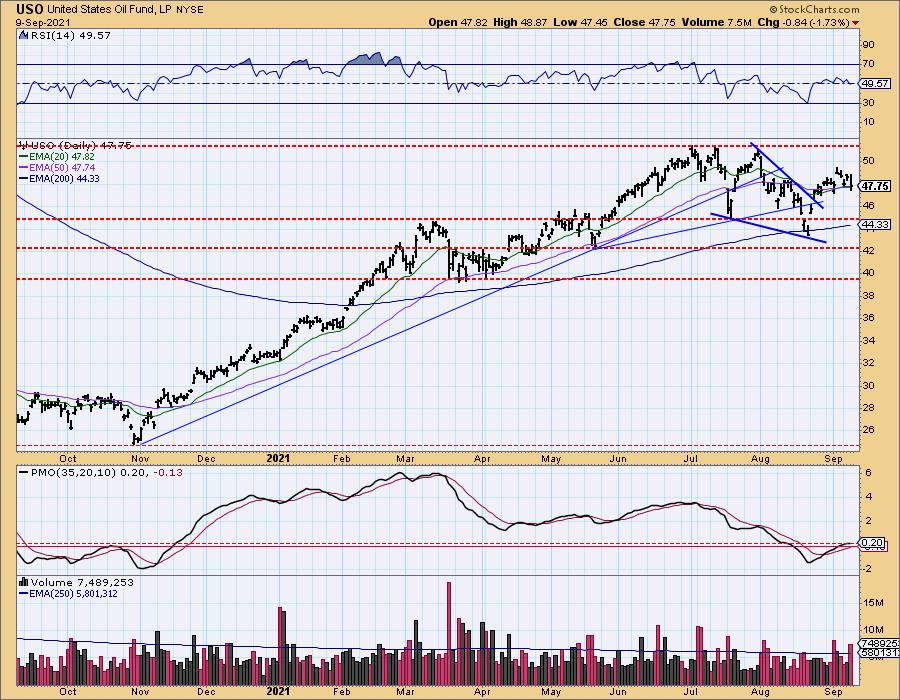
USO Daily Chart: Crude Oil dropped heavily. While it remains above the 50-EMA, it closed beneath the 20-EMA. This pulled the RSI out of positive territory. The PMO doesn't look that bad and these EMAs have previously held as support.
BONDS (TLT)
IT Trend Model: BUY as of 6/10/2021
LT Trend Model: BUY as of 8/10/2021
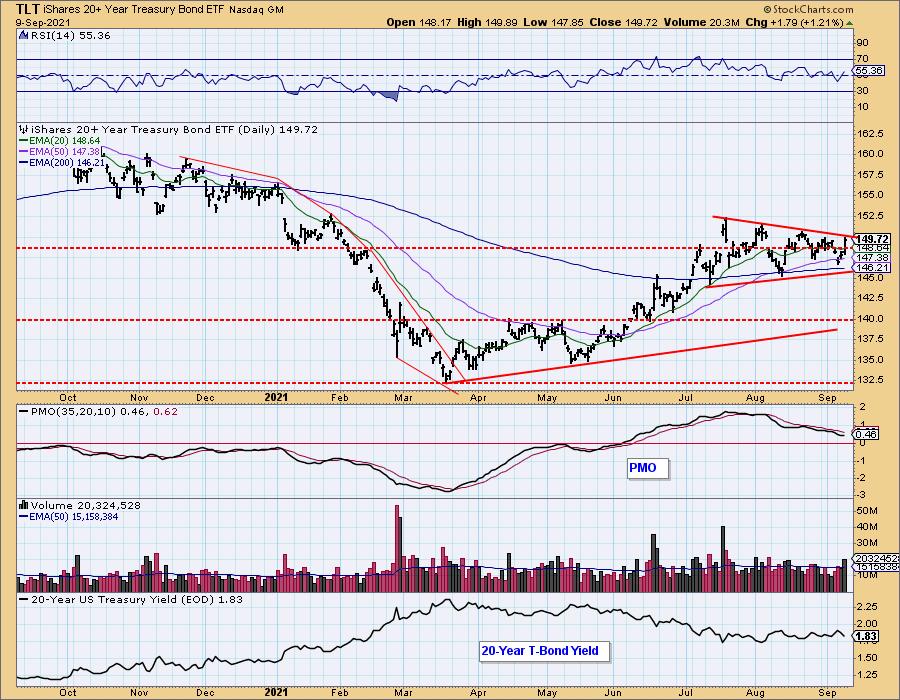
TLT Daily Chart: TLT nearly broke out from the symmetrical triangle. It is supposed to give us an upside breakout given symmetrical triangles are continuation patterns.
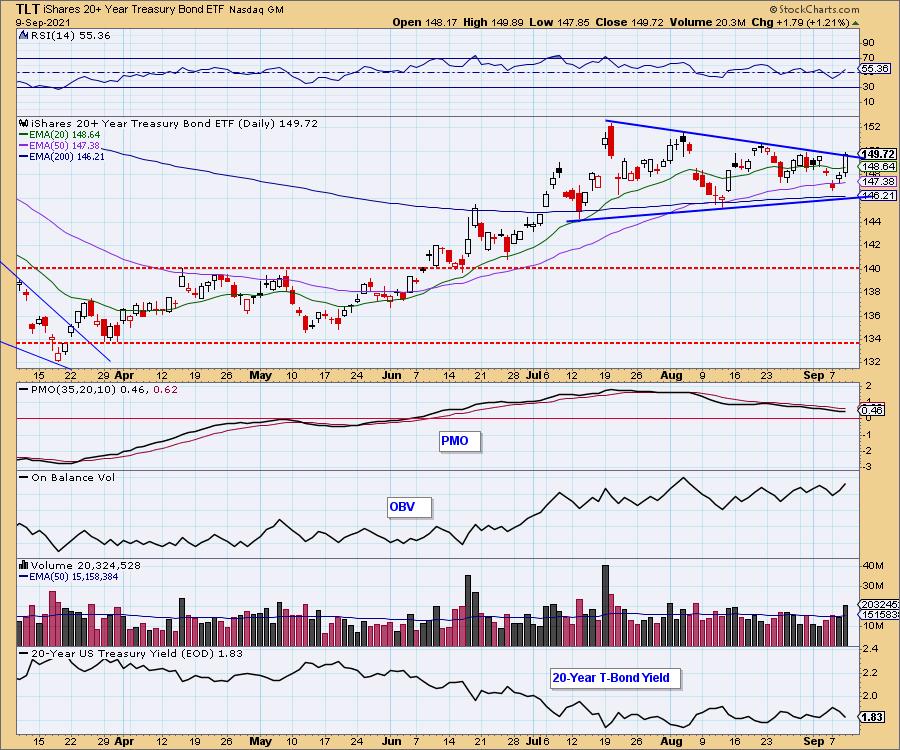
The PMO looks it could be turning up and the RSI is positive. It is likely we will see the breakout.
Technical Analysis is a windsock, not a crystal ball.
--Erin Swenlin
(c) Copyright 2021 DecisionPoint.com
Disclaimer: This blog is for educational purposes only and should not be construed as financial advice. The ideas and strategies should never be used without first assessing your own personal and financial situation, or without consulting a financial professional. Any opinions expressed herein are solely those of the author, and do not in any way represent the views or opinions of any other person or entity.
NOTE: The signal status reported herein is based upon mechanical trading model signals, specifically, the DecisionPoint Trend Model. They define the implied bias of the price index based upon moving average relationships, but they do not necessarily call for a specific action. They are information flags that should prompt chart review. Further, they do not call for continuous buying or selling during the life of the signal. For example, a BUY signal will probably (but not necessarily) return the best results if action is taken soon after the signal is generated. Additional opportunities for buying may be found as price zigzags higher, but the trader must look for optimum entry points. Conversely, exit points to preserve gains (or minimize losses) may be evident before the model mechanically closes the signal.
Helpful DecisionPoint Links:
DecisionPoint Alert Chart List
DecisionPoint Golden Cross/Silver Cross Index Chart List
DecisionPoint Sector Chart List
Price Momentum Oscillator (PMO)
Swenlin Trading Oscillators (STO-B and STO-V)
DecisionPoint is not a registered investment advisor. Investment and trading decisions are solely your responsibility. DecisionPoint newsletters, blogs or website materials should NOT be interpreted as a recommendation or solicitation to buy or sell any security or to take any specific action.