
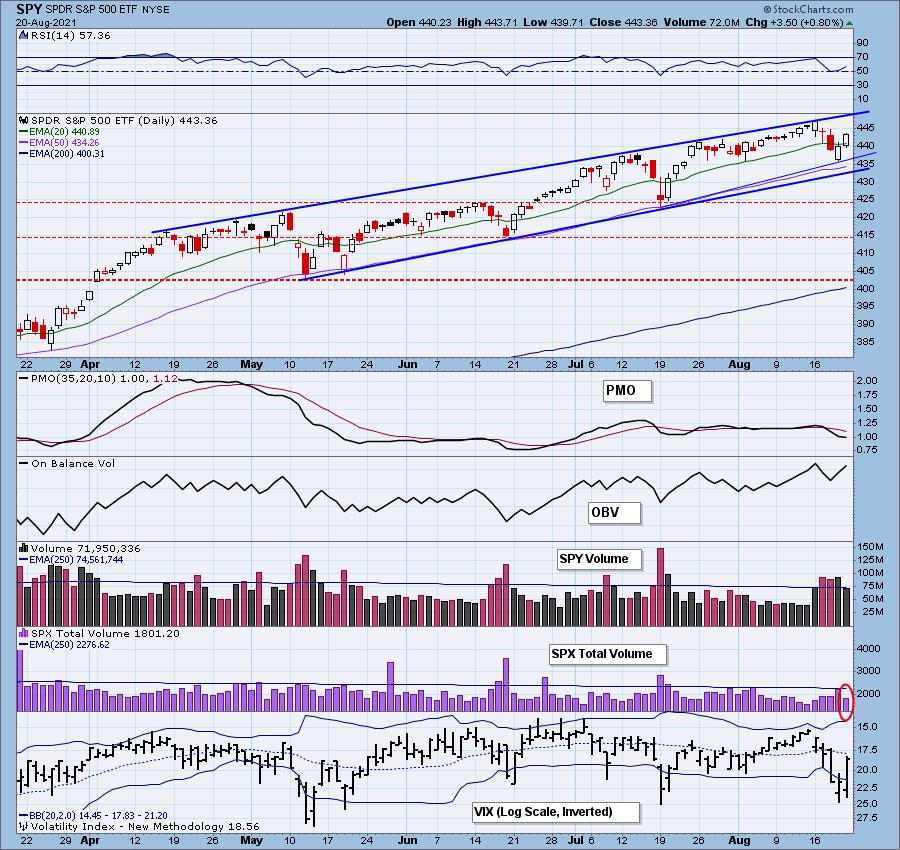
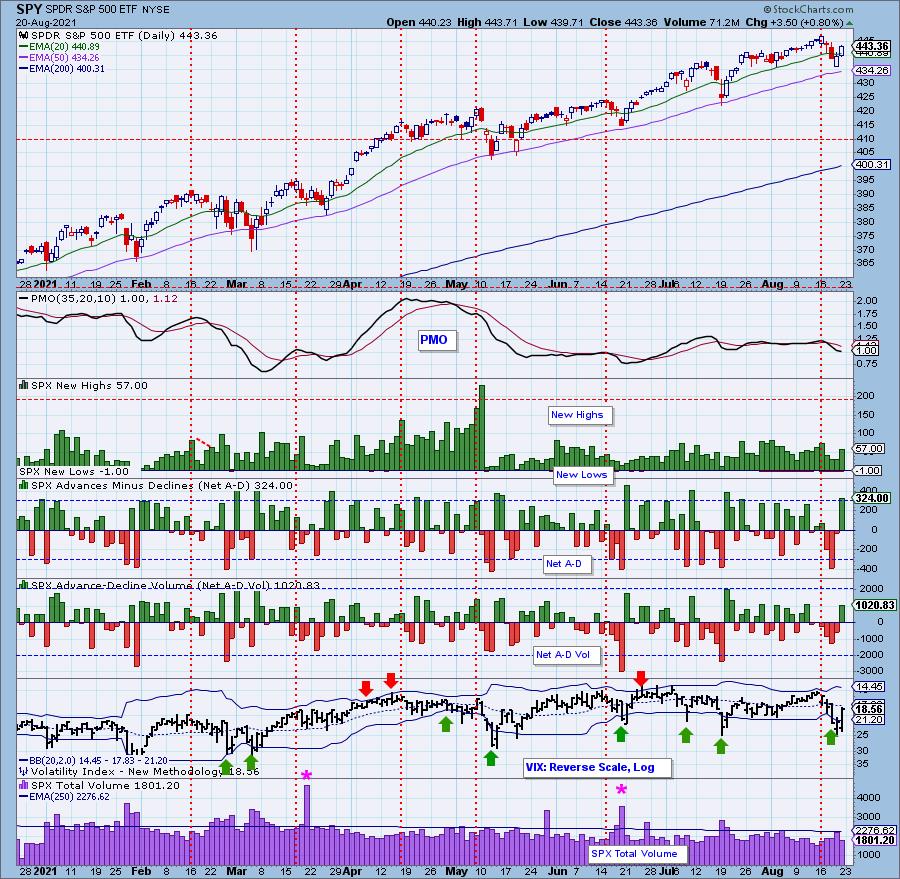
Today we have a possible upside exhaustion climax. We didn't get confirmation of the climax because Total Volume was so low today. This is a problem. Today was options expiration--we should have seen more volume. Additionally, it was a strong rally day and Total Volume wasn't behind it either.
Yes, the VIX did spike higher on our inverted scale after puncturing the lower Bollinger Band and that generally leads to an upside reversal. The last two days we got that reversal. The VIX remains below its EMA. The market typically shows weakness when the VIX is below its EMA. We're not out of the woods yet.
Some of you may ask, "What happened to Wednesday's Downside Initiation Climax?"
Two thoughts:
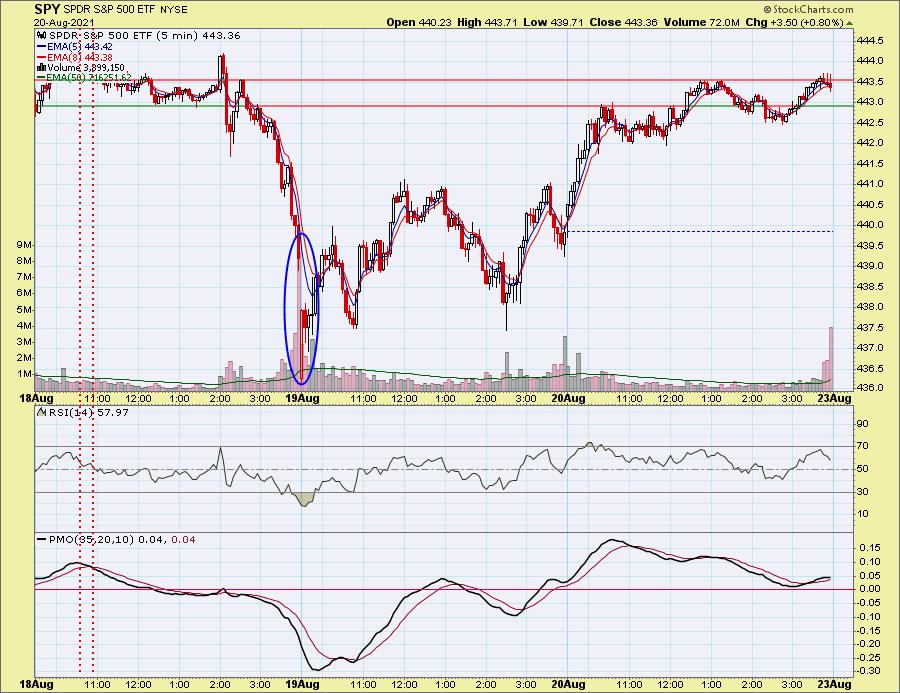
1) We saw a gap down on the open Thursday that could be assigned to the downside climax,
2) Wednesday's climax hasn't completely played out.
Below is the 5-minute candlestick showing the gap down that capped off the waterfall decline on Wednesday. Now price is chopping around.
Today's elevated Net A-D and New Highs combined with threshold breaks on the Volume Ratios are simply confirming Wednesday's downside initiation climax and are not necessarily an upside exhaustion. In either case, the result is the same...lower prices next week.
The DecisionPoint Alert Weekly Wrap presents an end-of-week assessment of the trend and condition of the Stock Market, the U.S. Dollar, Gold, Crude Oil, and Bonds. The DecisionPoint Alert daily report (Monday through Thursday) is abbreviated and gives updates on the Weekly Wrap assessments.
Watch the latest episode of DecisionPoint on StockCharts TV's YouTube channel here!
MAJOR MARKET INDEXES
For Friday: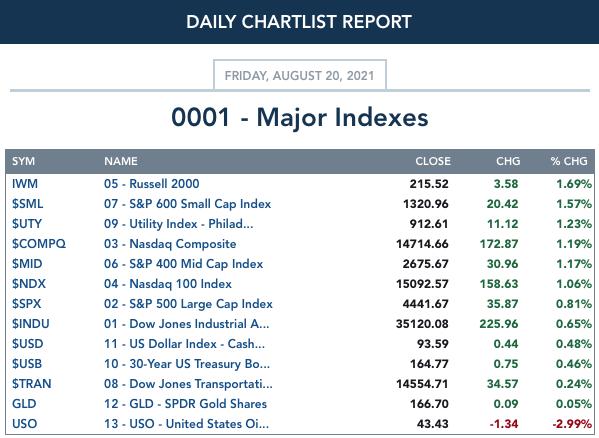
For the week: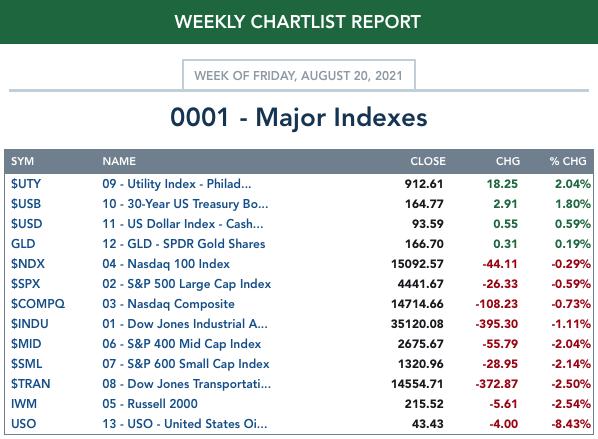
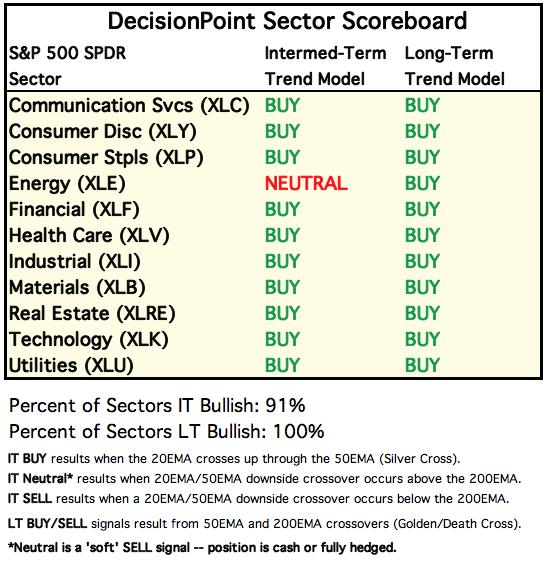
SECTORS
Each S&P 500 Index component stock is assigned to one, and only one, of 11 major sectors. This is a snapshot of the Intermediate-Term (Silver Cross) and Long-Term (Golden Cross) Trend Model signal status for those sectors.
For Today: 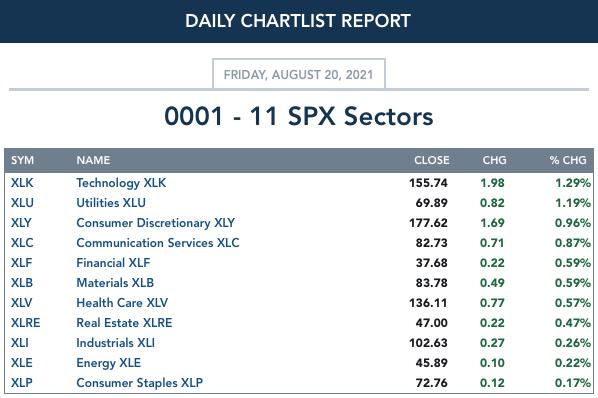
For the Week: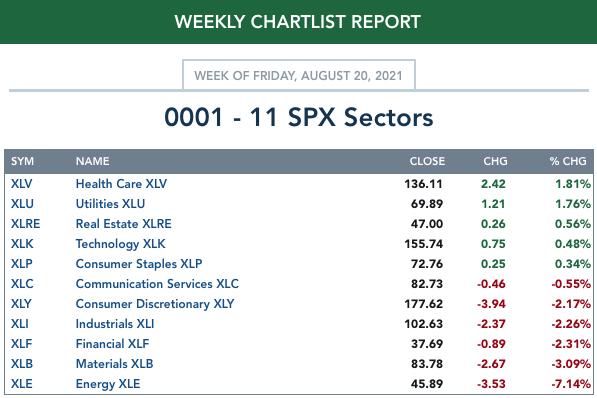
RRG® Chart: [[comments]]
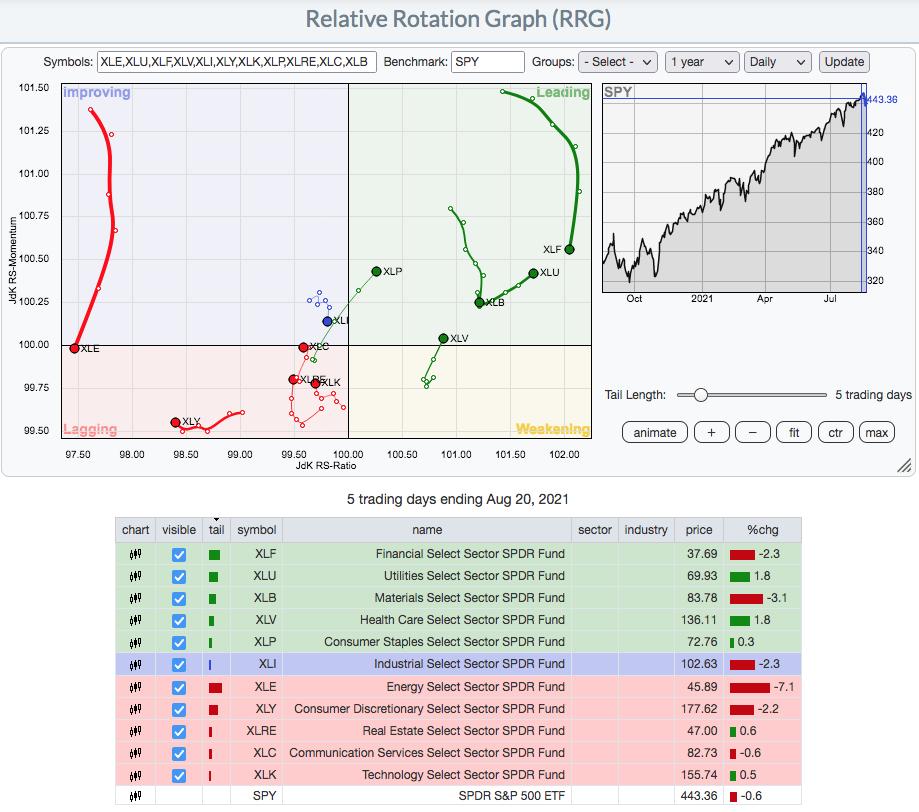
CLICK HERE for an animated version of the RRG chart.
CLICK HERE for Carl's annotated Sector charts.
THE MARKET (S&P 500)
IT Trend Model: BUY as of 5/8/2020
LT Trend Model: BUY as of 6/8/2020
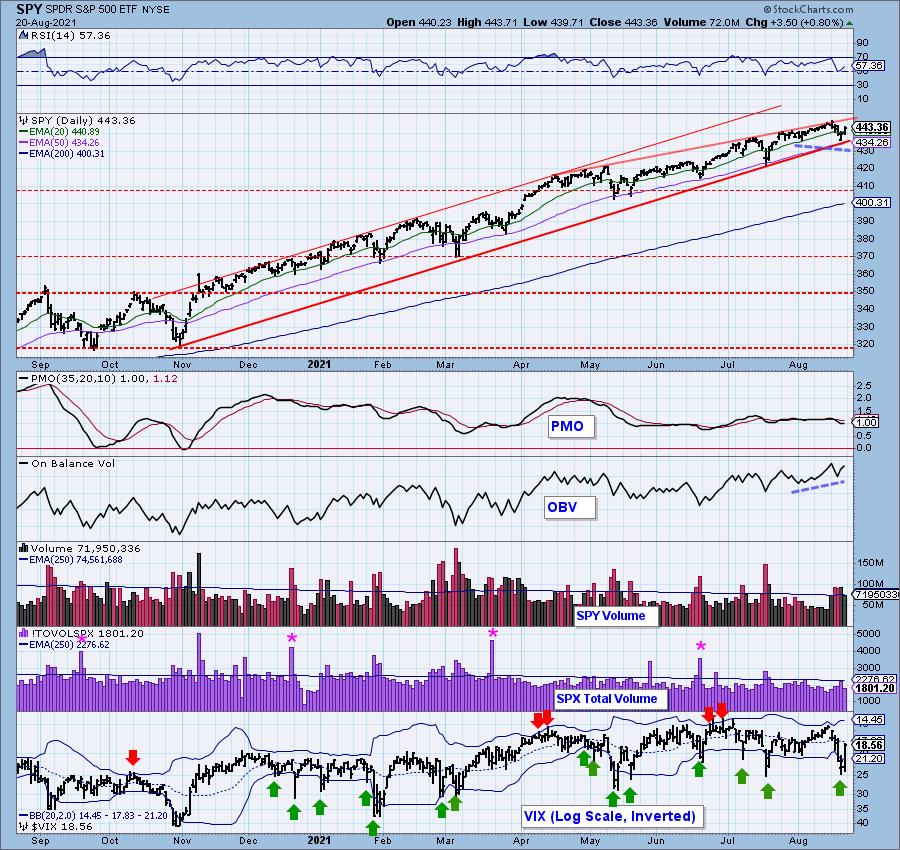
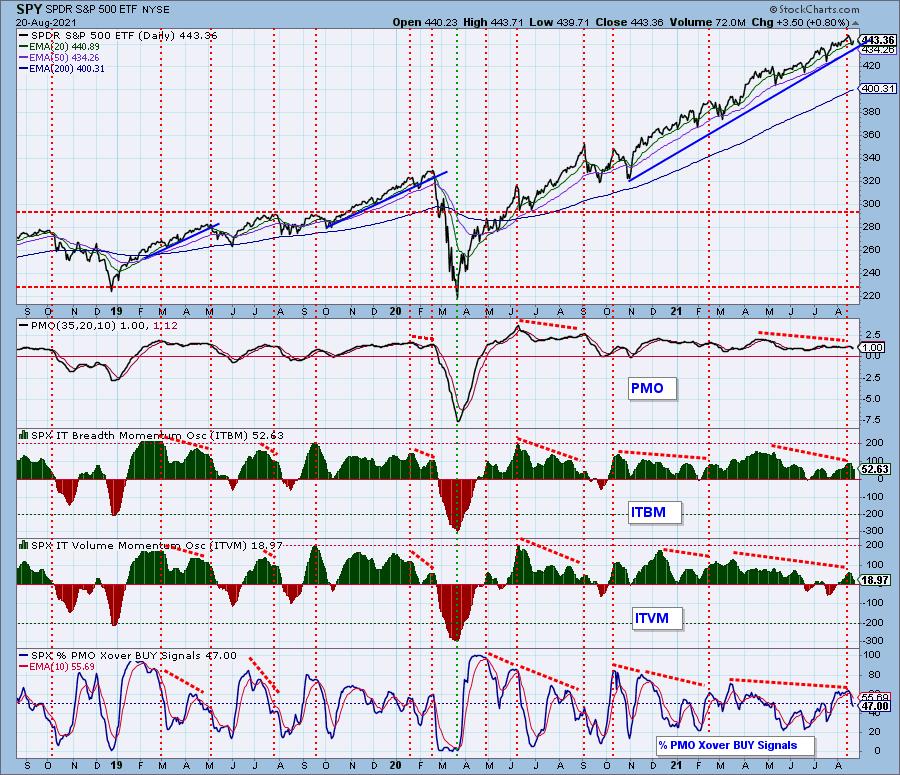
SPY Daily Chart: Price remains in the bearish rising wedge. The PMO triggered a crossover SELL signal this week and it has lasted a few days unlike the previous crossovers. The RSI is positive and avoided negative territory which is somewhat bullish. We also have a positive divergence on the OBV.

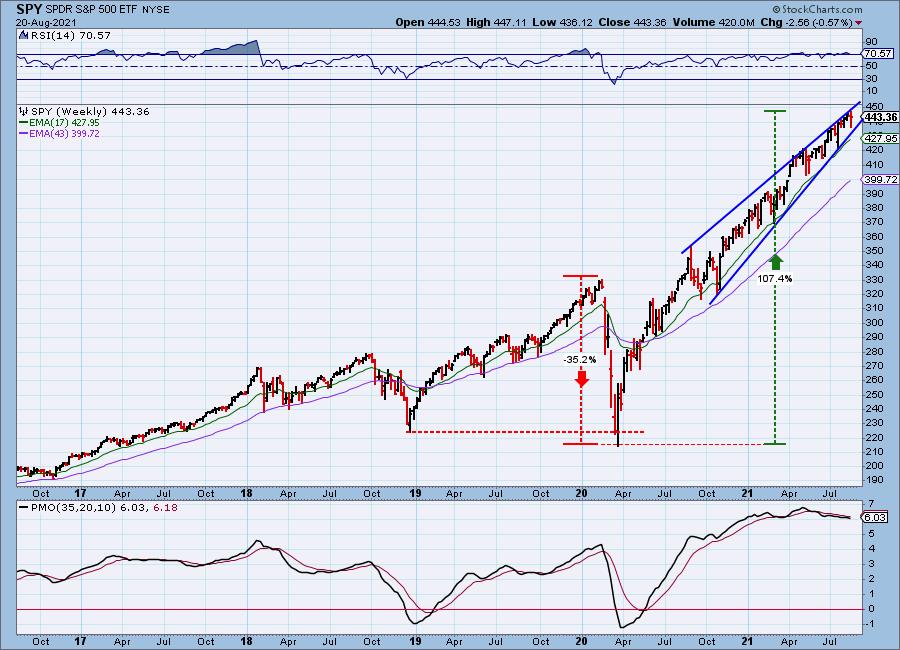
SPY Weekly Chart: The large bearish rising wedge dominates the weekly chart. The weekly PMO is continuing lower even as price continues to tap the top of the wedge. That's a negative divergence.
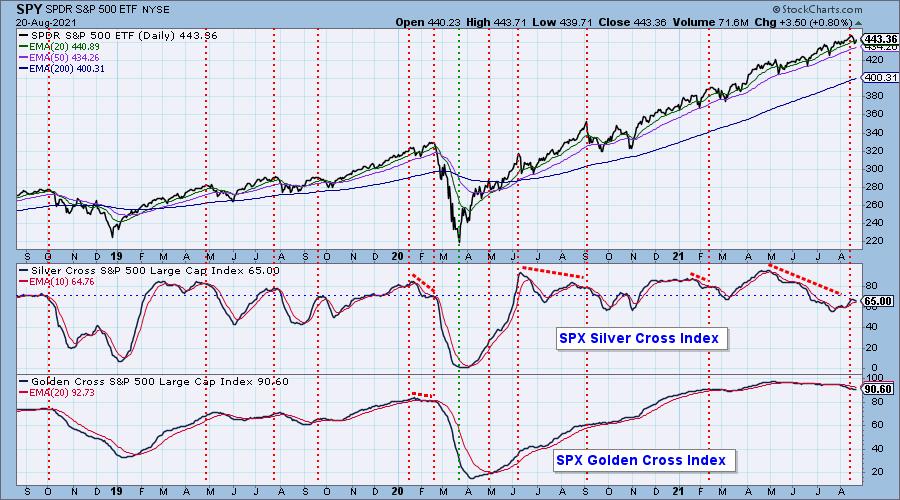
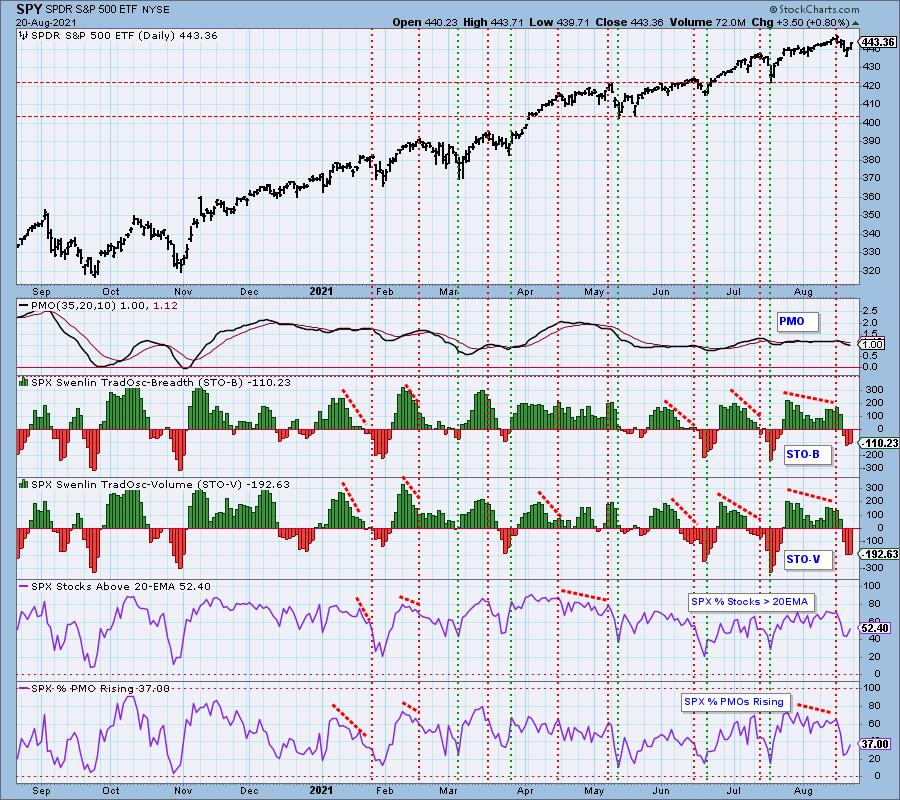
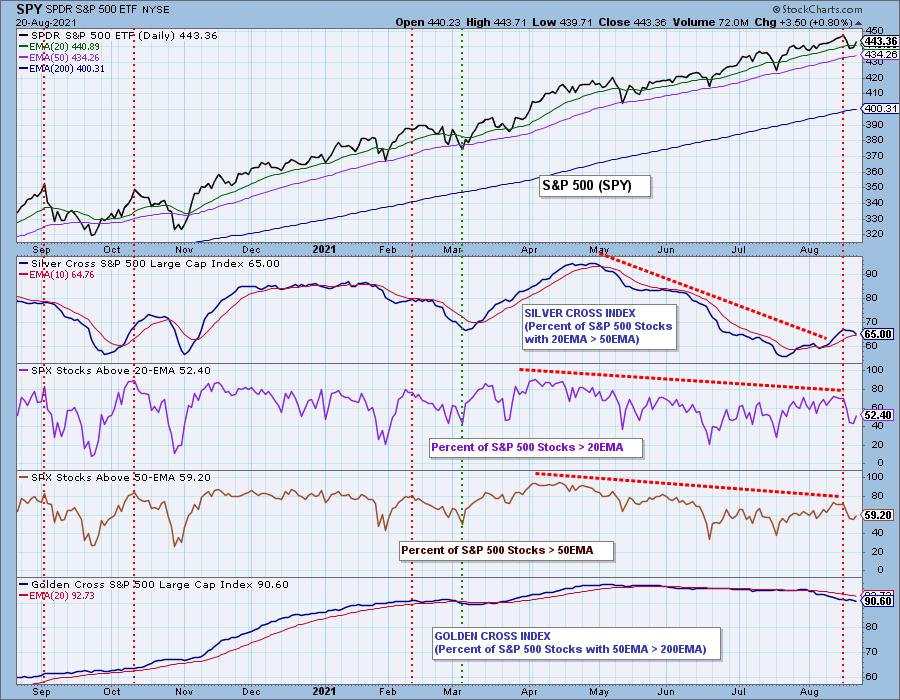
PARTICIPATION: The following chart uses different methodologies for objectively showing the depth and trend of participation for intermediate- and long-term time frames.
- The Silver Cross Index (SCI) shows the percentage of SPX stocks on IT Trend Model BUY signals (20-EMA > 50-EMA).
- The Golden Cross Index (GCI) shows the percentage of SPX stocks on LT Trend Model BUY signals (50-EMA > 200-EMA).
The SCI topped this week but does remain above its signal line. It is still looking bearish given the clear negative divergence that was 'sealed' when the SCI topped this week. The GCI continues to lose ground, albeit very slowly.
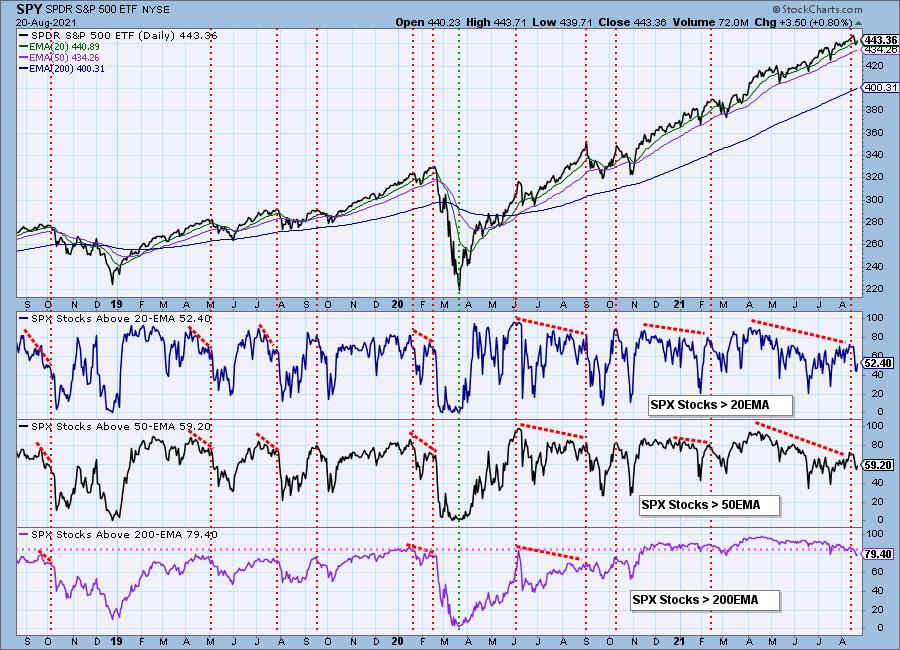
The negative divergences were also sealed on participation. Note the big drop in participation on this week's retreat from all-time highs. Participation did edge higher today, but there was major damage that wasn't repaired on yesterday and today's rallies.
Climax Analysis: Notice we did have climactic activity on Net A-D and there was an expansion in New Highs. As noted earlier, Total Volume isn't confirming a climax day.
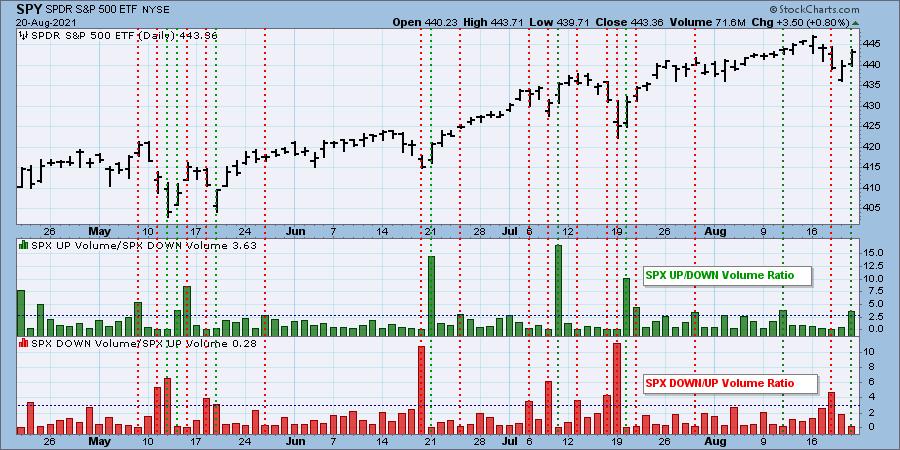
NYSE Up/Down and Down/Up volume ratios are also climax detectors. The 9:1 ratio suggested by the late Dr. Martin Zweig in his book, Winning on Wall Street, is especially significant, but we primarily look for spikes outside the normal range to clarify a particular event. We have an NYSE and S&P 500 version of the ratios, and normally they will only be published when there is a notable reading.
However, Volume Ratios are hinting at an upside exhaustion climax.
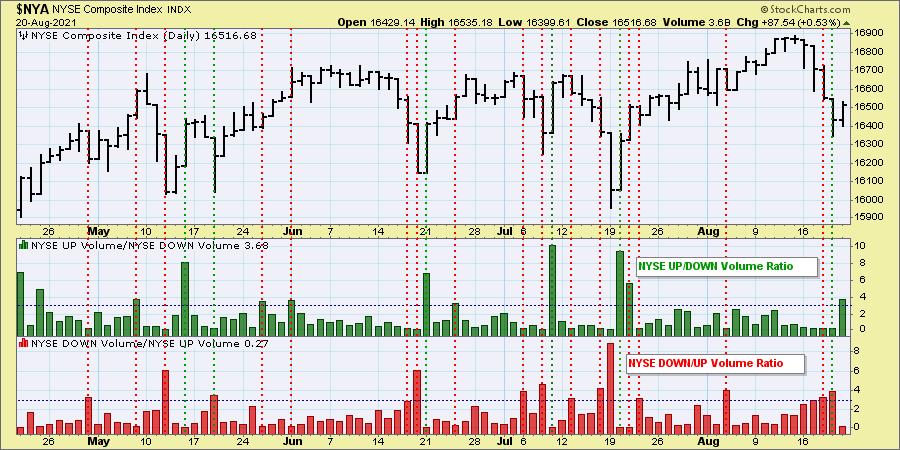
The S&P 500 version can get different results than the NYSE version because: (a) there are only 500 stocks versus a few thousand; and (b) those 500 stocks are all large-cap stocks that tend to move with more uniformity.
Short-Term Market Indicators: The short-term market trend is DOWN and the condition is SOMEWHAT OVERSOLD.
The STOs didn't really move much. While the readings are somewhat oversold, they can definitely accommodate more downside. There was some improvement in stocks with rising momentum, but the reading is still sickly at 37%. It is the rising momentum stocks that fuel rallies and there aren't many out there.
Intermediate-Term Market Indicators: The intermediate-term market trend is UP and the condition is NEUTRAL.
The decline of IT indicators was troubling this week as their decline suggests the intermediate-term rising trend will be broken. Less than half of the stocks in the SPX are on PMO BUY signals, so rally fuel is scarce.
Bias Assessment: The bullish bias that we had at the beginning of this week dissolved. We have far fewer stocks above their 20/50-EMAs in comparison to the SCI reading. When those percentages are below the SCI, that gives us a bearish bias.
CONCLUSION: Total volume contracting on options expiration and a strong rally day is troubling. It didn't confirm a climax today, but by shrinking it uncovered underlying market weakness. You can call today an upside exhaustion climax or you can just look at Wednesday's downside initiation climax and consider it still in force. Either way lower prices are likely. The IT indicators also suggest the intermediate-term rising trend is in jeopardy. Prepare for lower prices next week or consider trailing stops on profitable positions so you can eke out what upside may come out of the bounce of the last two days. Erin has pared back her exposure to 35% and is considering short positions and/or inverse ETFs depending on how the market opens on Monday.
Have you subscribed the DecisionPoint Diamonds yet? DP does the work for you by providing handpicked stocks/ETFs from exclusive DP scans! Add it with a discount! Contact support@decisionpoint.com for more information!
BITCOIN
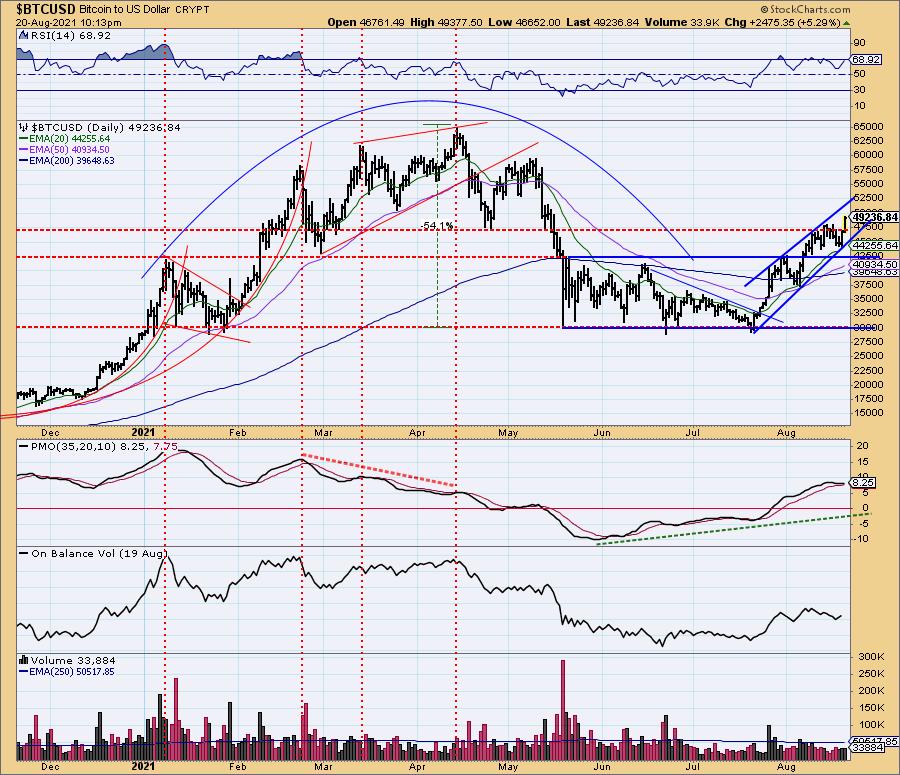
After hitting the bottom of the bearish rising wedge, Bitcoin rallied strongly this week. The breakout above $47,500 today is encouraging, but this bearish pattern should temper our excitement particularly given the nearly overbought RSI and possible PMO top. We would look for higher prices but a retreat when the top of the wedge is tested again.
INTEREST RATES
Interest rates were improving last week, but resumed the decline this week. The Fed's discussion of tapering didn't really jumpstart rates.
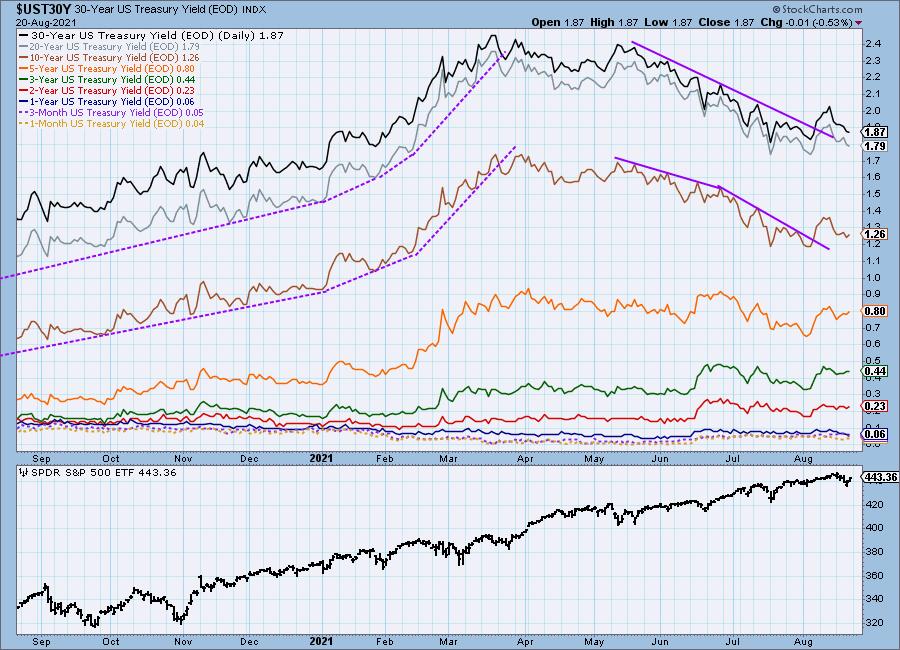
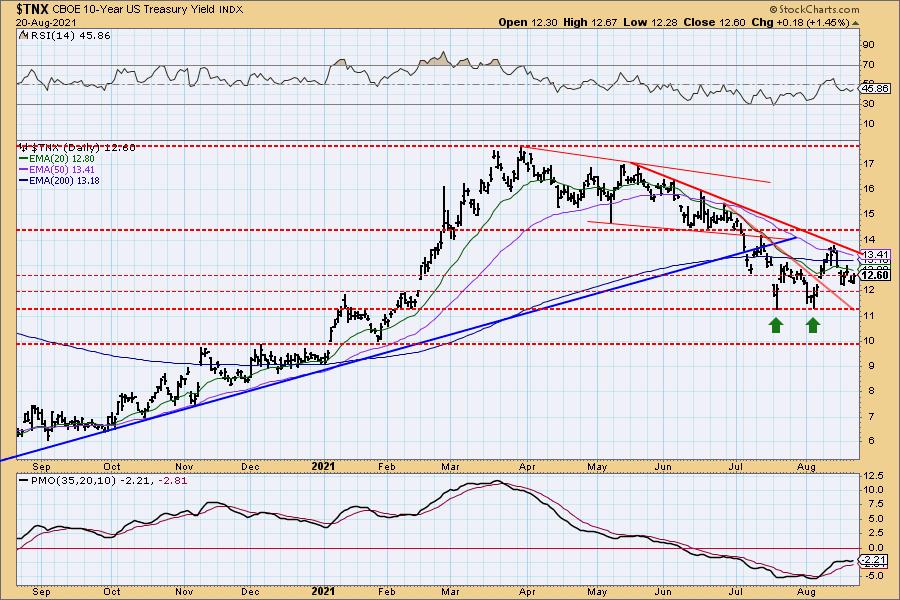
10-YEAR T-BOND YIELD
The bullish double-bottom failed this week as the 10-year yield made its way back to support at 1.2. The 20-EMA is still holding as overhead resistance and the declining trend is still in force. $TNX is setting up a "death cross" of the 50/200-EMAs. The RSI is negative and the PMO is trying to top well below the zero line. It may take actual Fed action on tapering to really change the bearish bias on this chart.
DOLLAR (UUP)
IT Trend Model: BUY as of 6/22/2021
LT Trend Model: BUY as of 8/19/2021
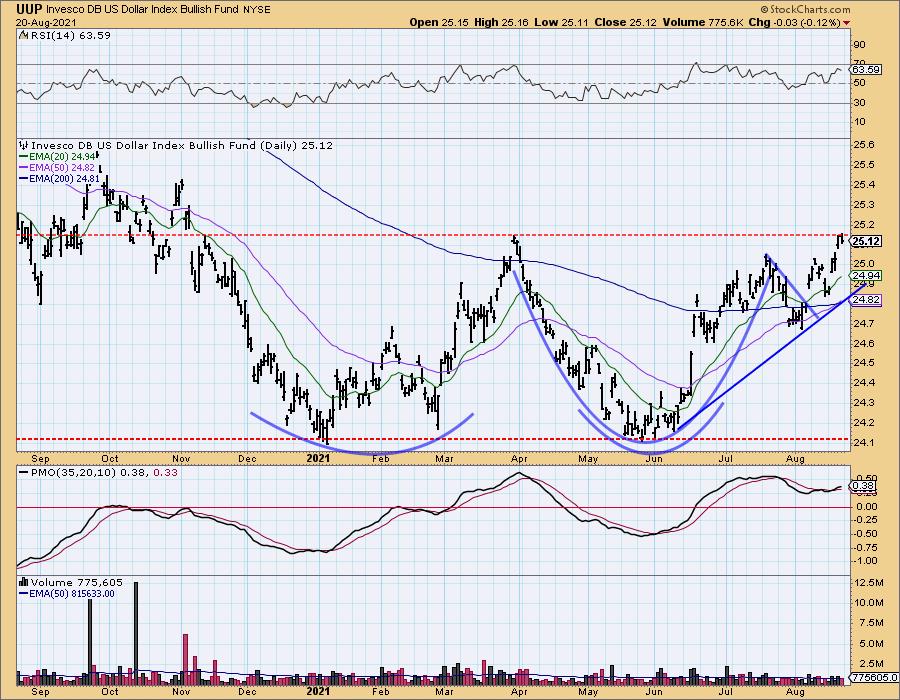
UUP Daily Chart: The Dollar is looking bullish this week. The RSI is positive and we had a PMO crossover BUY signal trigger. Additionally, we saw a LT Trend Model "Golden Cross" BUY signal yesterday. However, today it stalled at resistance.
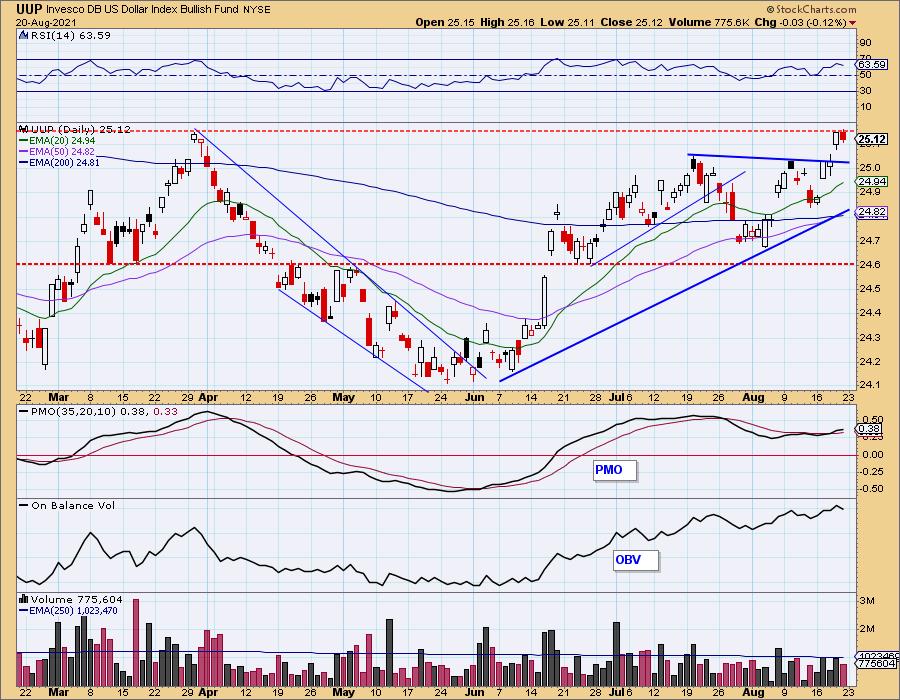
We have a messy double-bottom or a cup and handle pattern. Either way the expectation of both patterns would be a breakout to higher prices.
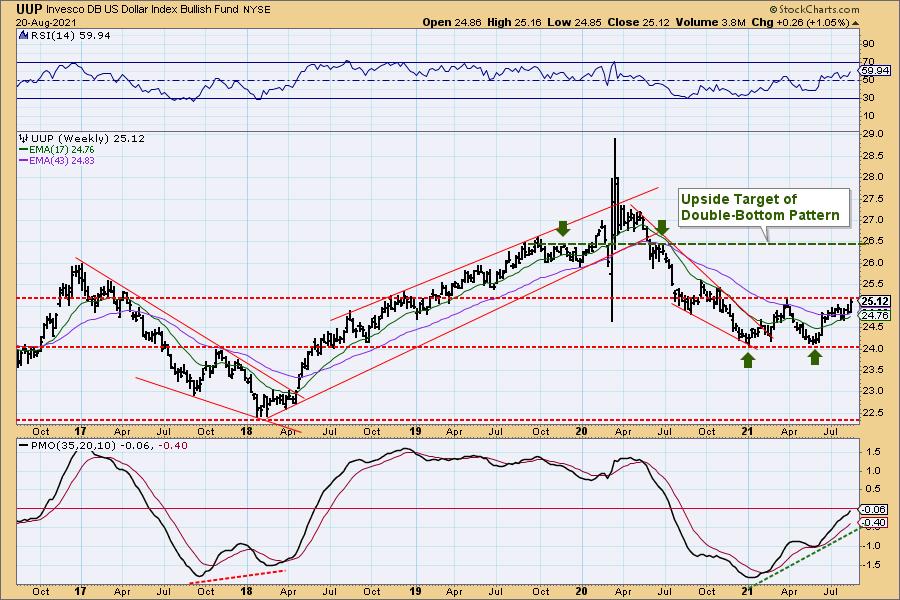
UUP Weekly Chart: The weekly chart is very favorable with a rising PMO that has nearly reached positive territory and a positive RSI. The bullish double-bottom is prominent. The upside target is near $26.50, aligning with the November and June tops.
GOLD
IT Trend Model: NEUTRAL as of 6/24/2021
LT Trend Model: SELL as of 8/9/2021
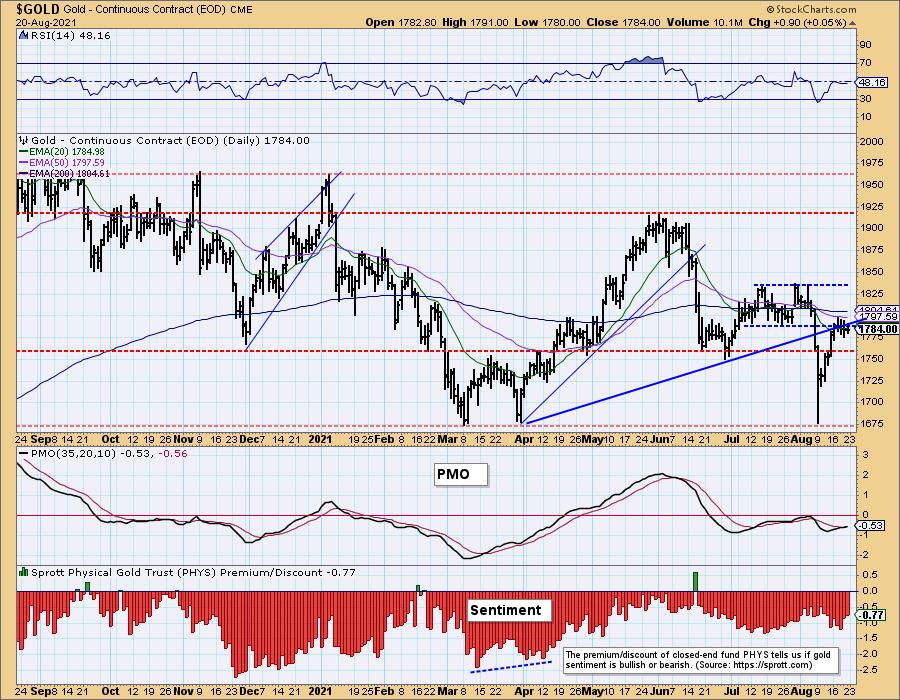
GOLD Daily Chart: Gold struggled all week against overhead resistance and was not successful in closing back above the original rising trend and July trading range. If you want to be a bull, you could point to the bull flag and PMO crossover BUY signal today. However, if the Dollar is going to see a breakout, that will make it especially difficult for Gold to move higher.
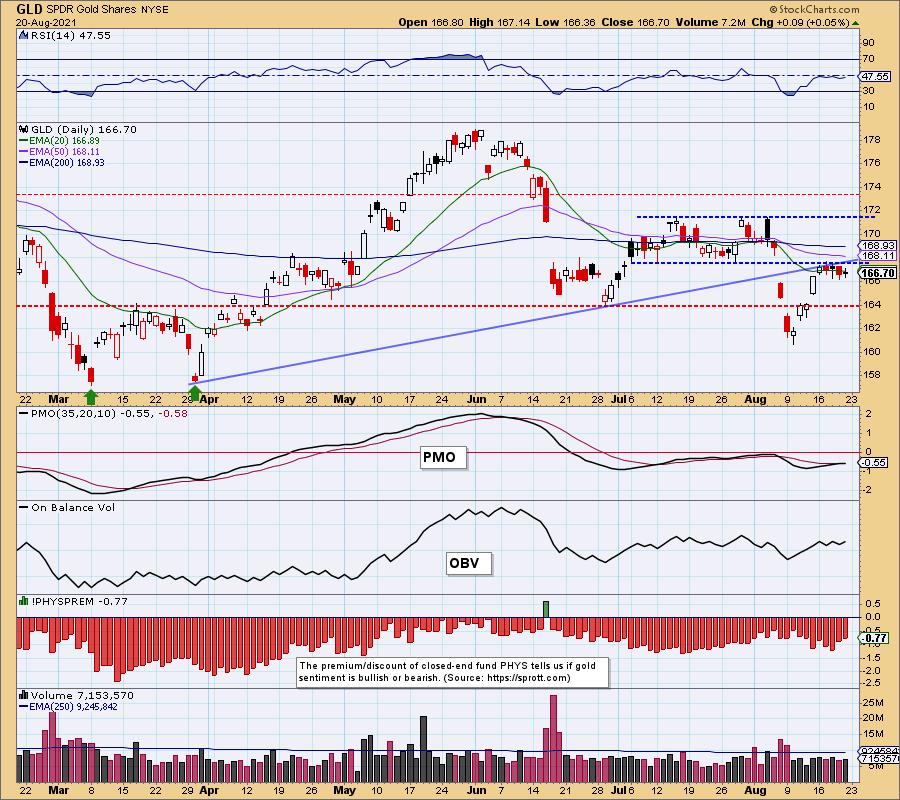
Intraday highs on $GOLD did foray into the July trading range this week, but as noted above, it failed to stay there. Discounts are paring back meaning participants are feeling less bearish. We'd prefer that they get very bearish as sentiment is contrarian and that would bolster the idea of a bull flag breakout ahead.
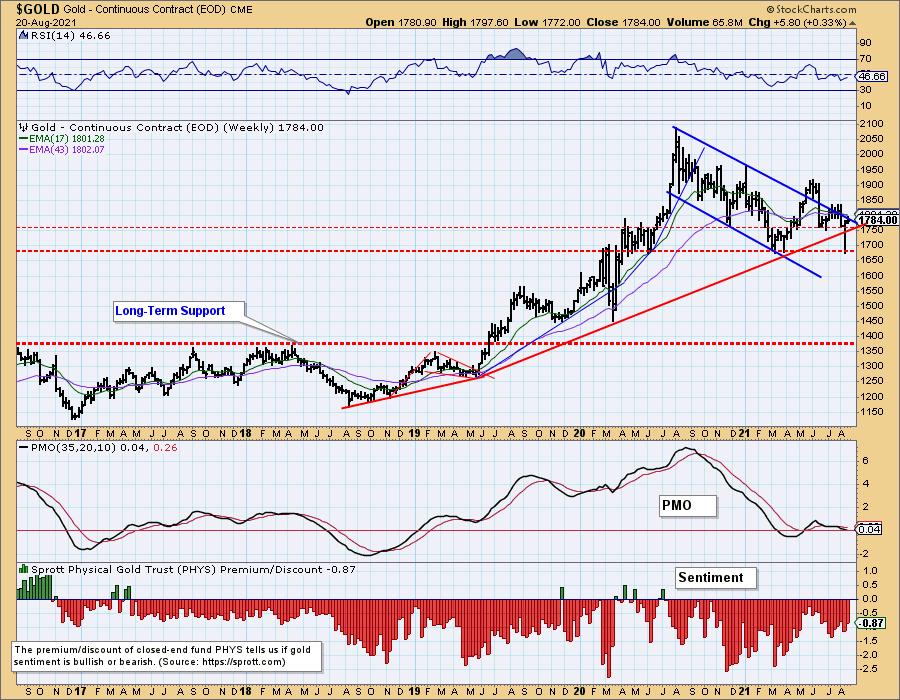
GOLD Weekly Chart: The weekly chart for Gold shows that overall price is in a declining trend. Maybe we're looking at a bounce that will turn into a sustained rally, but the weekly RSI and PMO are negative.
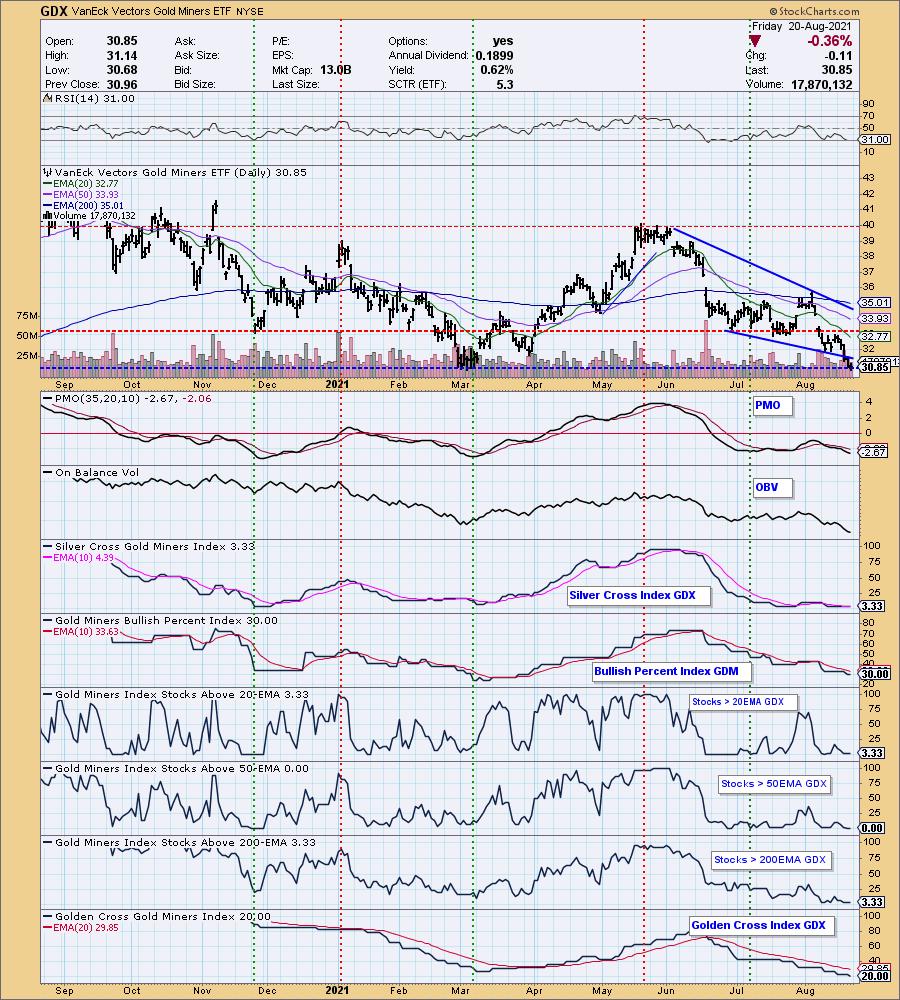
GOLD MINERS Golden and Silver Cross Indexes: Gold Miners were already suffering and this week they hit the skids testing lows not seen for over a year. The breakdown from the bullish falling wedge is very bearish. While this could be a pivot point for GDX, participation is showing zero improvement. When these guys turn around there will some great opportunities out there, but we wouldn't bank on this being a reversal especially given the strong Dollar and weak outlook for Gold.
CRUDE OIL (USO)
IT Trend Model: NEUTRAL as of 8/18/2021
LT Trend Model: BUY as of 3/9/2021
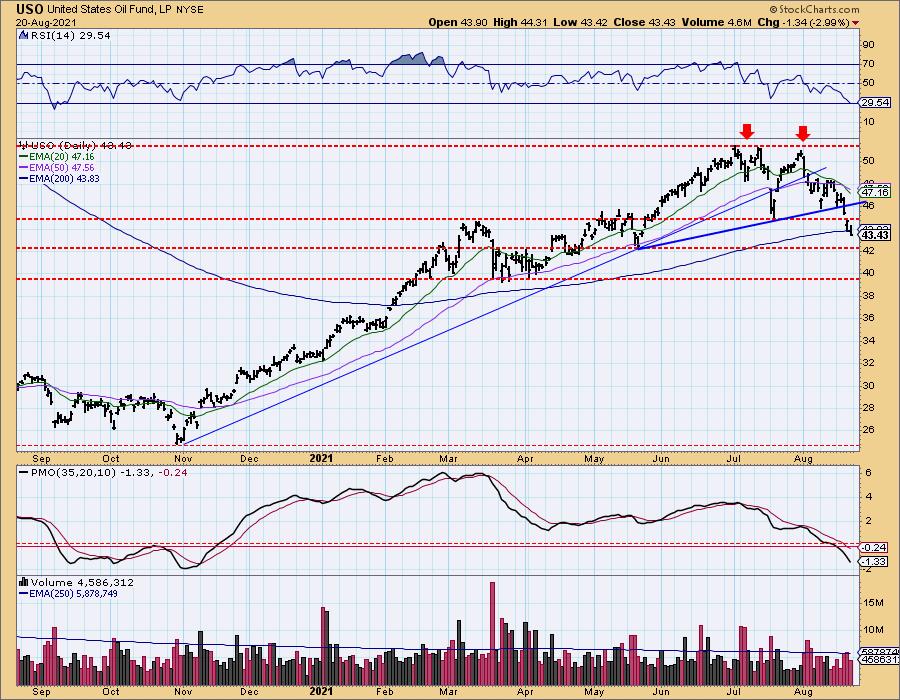
USO Daily Chart: USO had already started to fall apart last week and this week it shattered. The rising bottoms trendline was broken and today price closed beneath the 200-EMA. An IT Trend Model Neutral signal was generated as the 20-EMA crossed below the 50-EMA. Had this crossover occurred below the 200-EMA it would have been a SELL signal, instead it is positioned well above the 200-EMA so it is Neutral.
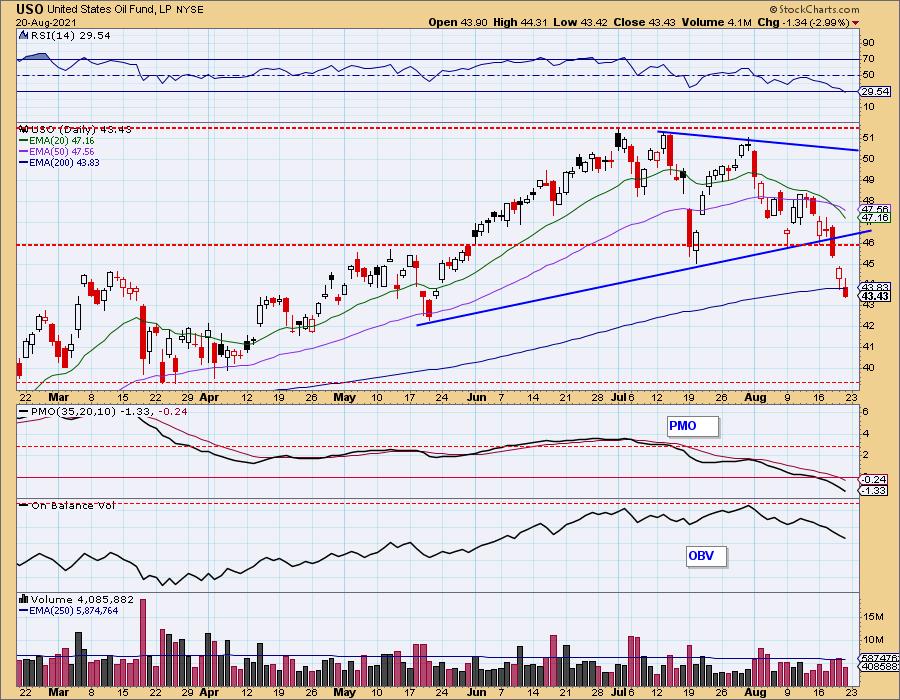
The next level of support arrives at the May low. The RSI has entered oversold territory but the ugly PMO and large bearish double-top suggest price could test the lows from March.
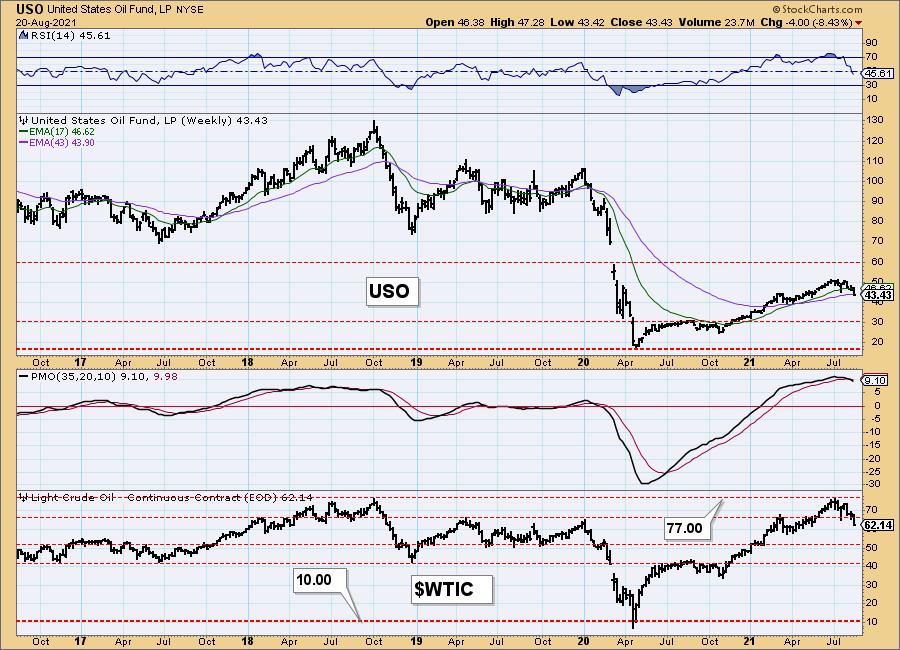
USO/$WTIC Weekly Chart: $WTIC shows us support was broken this week. The weekly RSI is now in negative territory and the PMO triggered an IT PMO SELL signal on its crossover. As the Magic 8-Ball would say, "Outlook Not So Good" for Crude Oil.
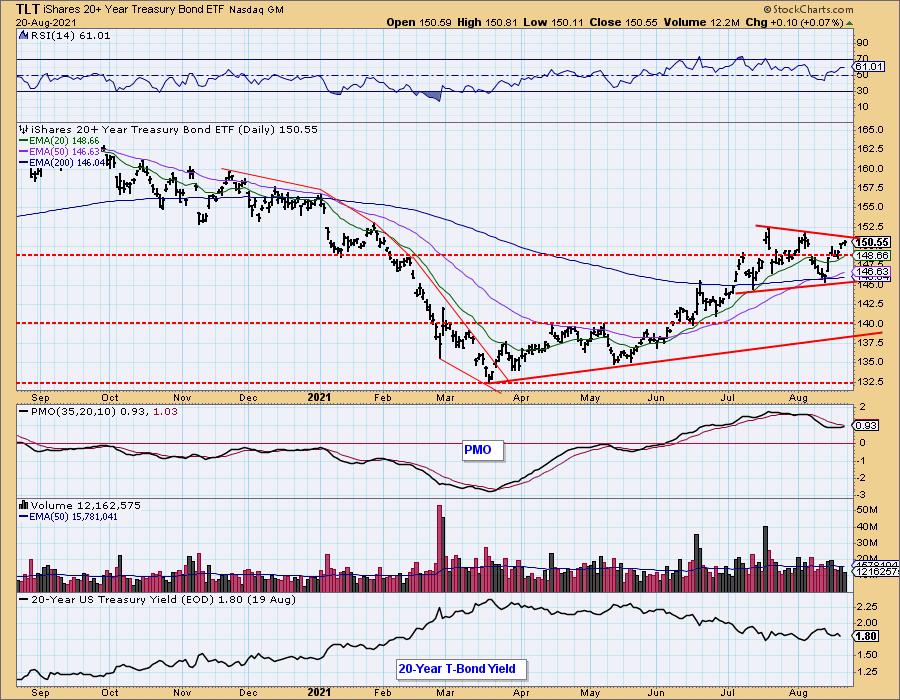
BONDS (TLT)
IT Trend Model: BUY as of 6/10/2021
LT Trend Model: SELL as of 1/8/2021
TLT Daily Chart: TLT has formed a symmetrical triangle. These are continuation patterns so that implies a breakout. For the moment, yields are confirming the likelihood of a breakout given their declining trend.
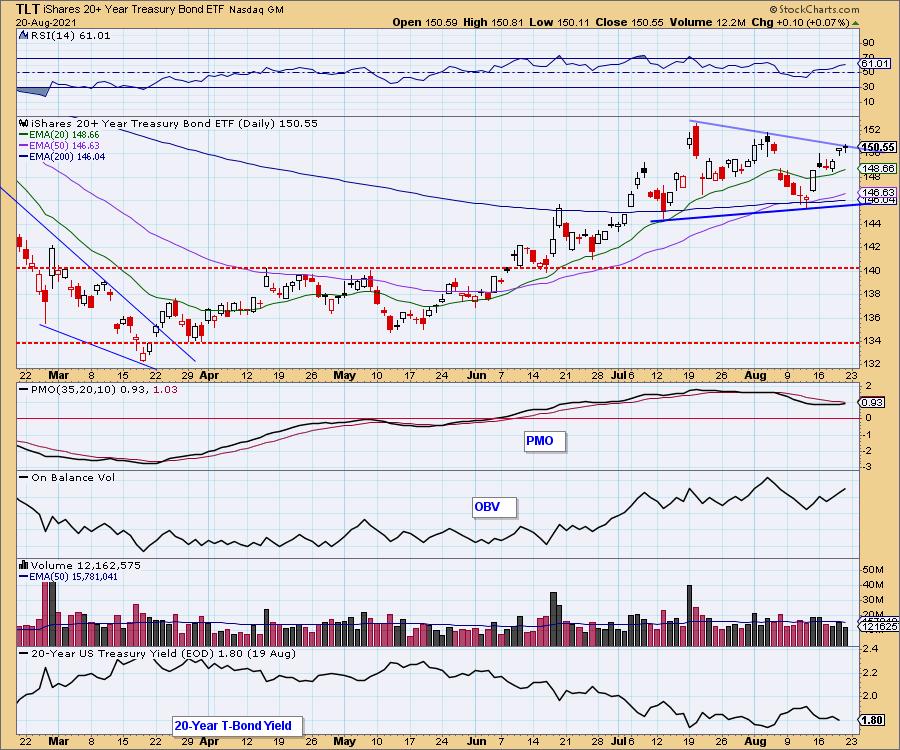
The RSI is positive and the PMO is reaching up toward a crossover BUY signal.
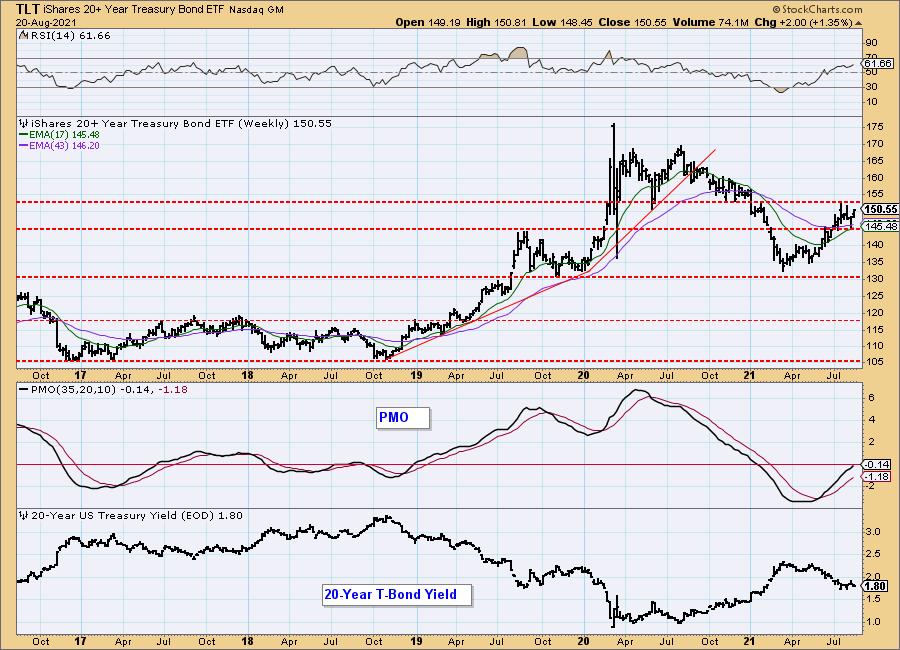
TLT Weekly Chart: The weekly chart is favorable with the weekly RSI in positive territory and not overbought. Additionally the weekly PMO is rising and is nearing positive territory. Overhead resistance has been sturdy, but the declining trend in yields and positive indicators on both the daily and weekly charts suggest a breakout ahead.
Technical Analysis is a windsock, not a crystal ball.
-- Carl & Erin Swenlin
(c) Copyright 2021 DecisionPoint.com
Disclaimer: This blog is for educational purposes only and should not be construed as financial advice. The ideas and strategies should never be used without first assessing your own personal and financial situation, or without consulting a financial professional. Any opinions expressed herein are solely those of the author, and do not in any way represent the views or opinions of any other person or entity.
NOTE: The signal status reported herein is based upon mechanical trading model signals, specifically, the DecisionPoint Trend Model. They define the implied bias of the price index based upon moving average relationships, but they do not necessarily call for a specific action. They are information flags that should prompt chart review. Further, they do not call for continuous buying or selling during the life of the signal. For example, a BUY signal will probably (but not necessarily) return the best results if action is taken soon after the signal is generated. Additional opportunities for buying may be found as price zigzags higher, but the trader must look for optimum entry points. Conversely, exit points to preserve gains (or minimize losses) may be evident before the model mechanically closes the signal.
Helpful DecisionPoint Links:
DecisionPoint Alert Chart List
DecisionPoint Golden Cross/Silver Cross Index Chart List
DecisionPoint Sector Chart List
Price Momentum Oscillator (PMO)
Swenlin Trading Oscillators (STO-B and STO-V)
DecisionPoint is not a registered investment advisor. Investment and trading decisions are solely your responsibility. DecisionPoint newsletters, blogs or website materials should NOT be interpreted as a recommendation or solicitation to buy or sell any security or to take any specific action. f