
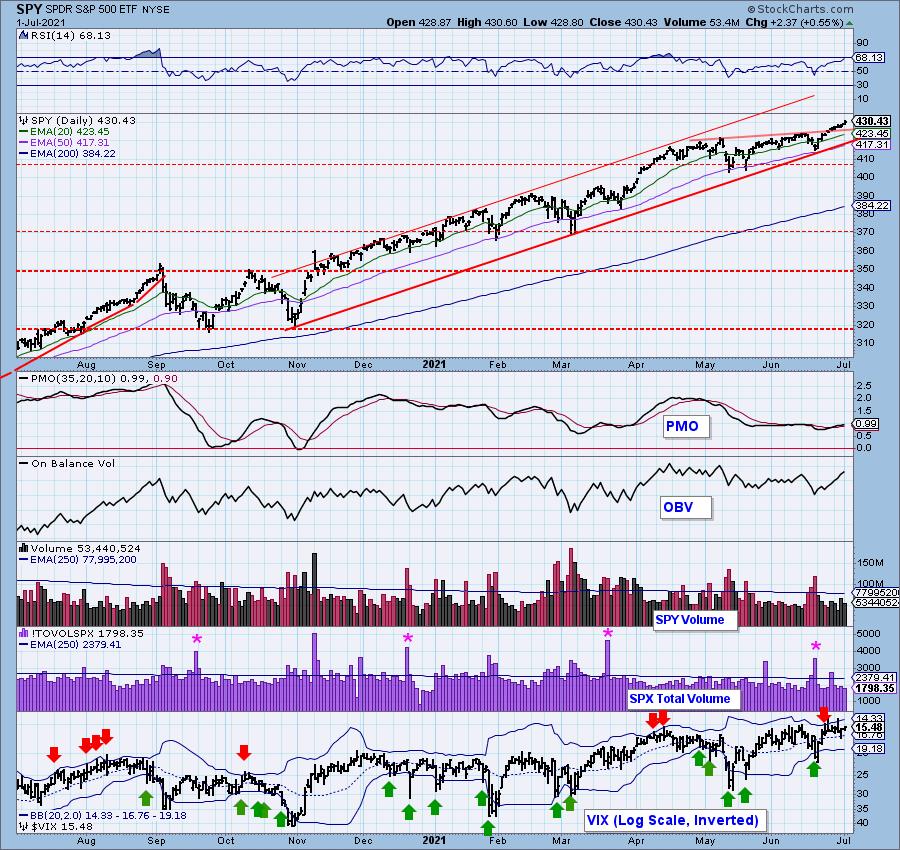
After over four miles of hiking on the Zion trails (pictures are at the end of the article), I know that "I" have hit an exhaustion climax. Now it appears we have one in the market. This has the earmarks. Net A-D was elevated past our threshold and Net A-D Volume was higher. The VIX didn't puncture the upper Bollinger Band yet, but those Bands have squeezed together indicating high volatility could be ahead. Total volume didn't really expand, but that is a problem on a big rally to new all-time highs.

** WORKING VACATION - June 28th to July 9th **
It's that time of year again! Last year it was a road trip to Alabama and back, this year it is a road trip to Utah and back! We finished Las Vegas and have reached our "glamping" camp site in Zion. After this onto Spanish Fork, Bryce Canyon, back to the Grand Canyon, Bull Head City and finally back home.
I plan on writing, but all trading rooms will be postponed until I return home. Blog articles may be delayed depending on WIFI service and/or our travel for the day.
DP Alert subscribers: The DP Alert will be published daily at varying times while I'm traveling. I will try to keep as close to our regular schedule as possible. Rest assured, you will ALWAYS have the report prior to market open the next day.
The DecisionPoint Alert Weekly Wrap presents an end-of-week assessment of the trend and condition of the Stock Market, the U.S. Dollar, Gold, Crude Oil, and Bonds. The DecisionPoint Alert daily report (Monday through Thursday) is abbreviated and gives updates on the Weekly Wrap assessments.
Watch the latest episode of DecisionPoint on StockChartsTV.com and YouTube here!
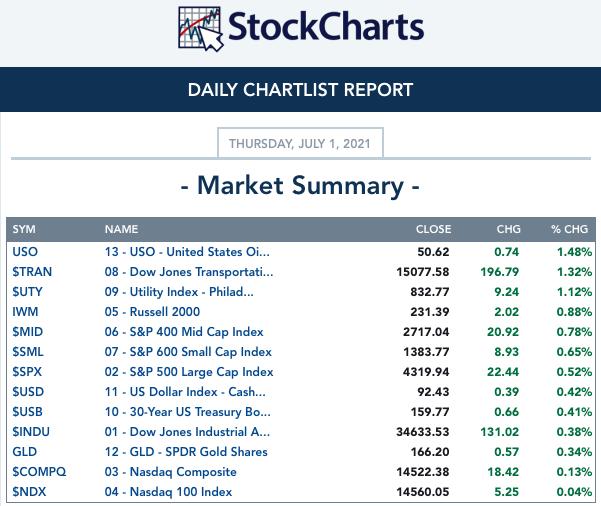
MAJOR MARKET INDEXES
SECTORS
Each S&P 500 Index component stock is assigned to one, and only one, of 11 major sectors. This is a snapshot of the Intermediate-Term (Silver Cross) and Long-Term (Golden Cross) Trend Model signal status for those sectors.
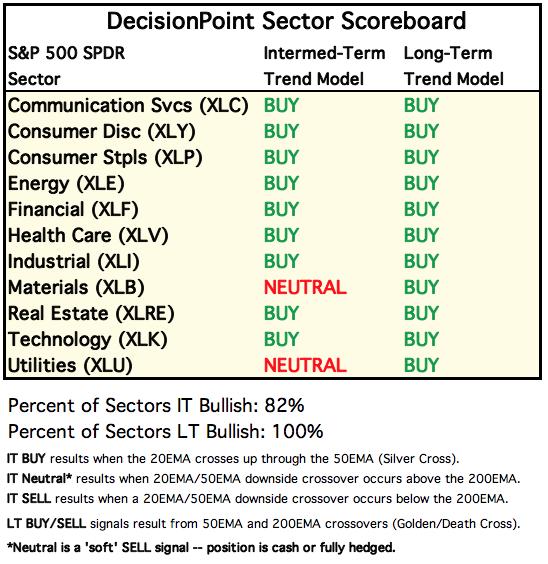
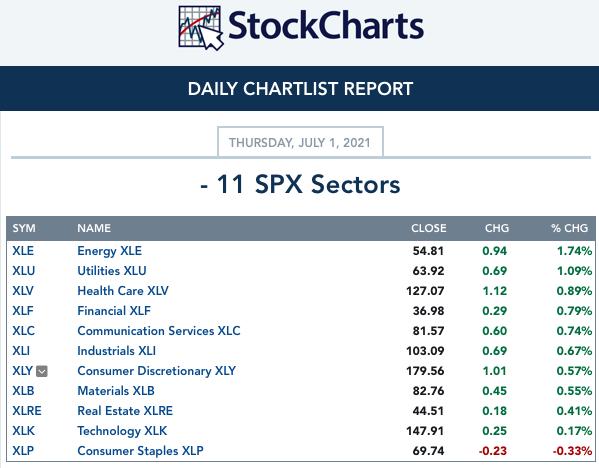
CLICK HERE for Carl's annotated Sector charts.
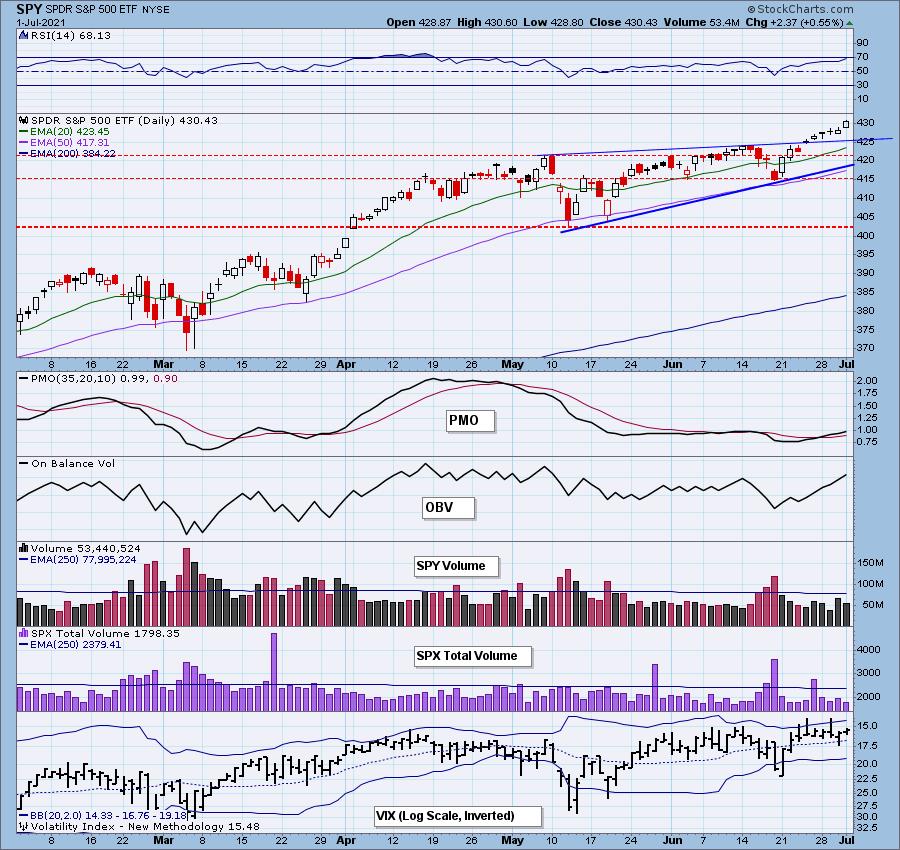
THE MARKET (S&P 500)
IT Trend Model: BUY as of 5/8/2020
LT Trend Model: BUY as of 6/8/2020
SPY Daily Chart: The RSI is getting close to overbought territory on this likely exhaustion climax. The OBV at least erased its short-term negative divergence and the PMO is continuing to rise from oversold territory.

Participation: The following chart uses different methodologies for objectively showing the depth and trend of participation for intermediate- and long-term time frames.
- The Silver Cross Index (SCI) shows the percentage of SPX stocks on IT Trend Model BUY signals (20-EMA > 50-EMA).
- The Golden Cross Index (GCI) shows the percentage of SPX stocks on LT Trend Model BUY signals (50-EMA > 200-EMA).
- The Bullish Percent Index (BPI) shows the percentage of SPX stocks on Point & Figure BUY signals.
The BPI is rising after crossing above its signal line and the SCI ticked higher; however, the GCI did lose a few tenths of a point.
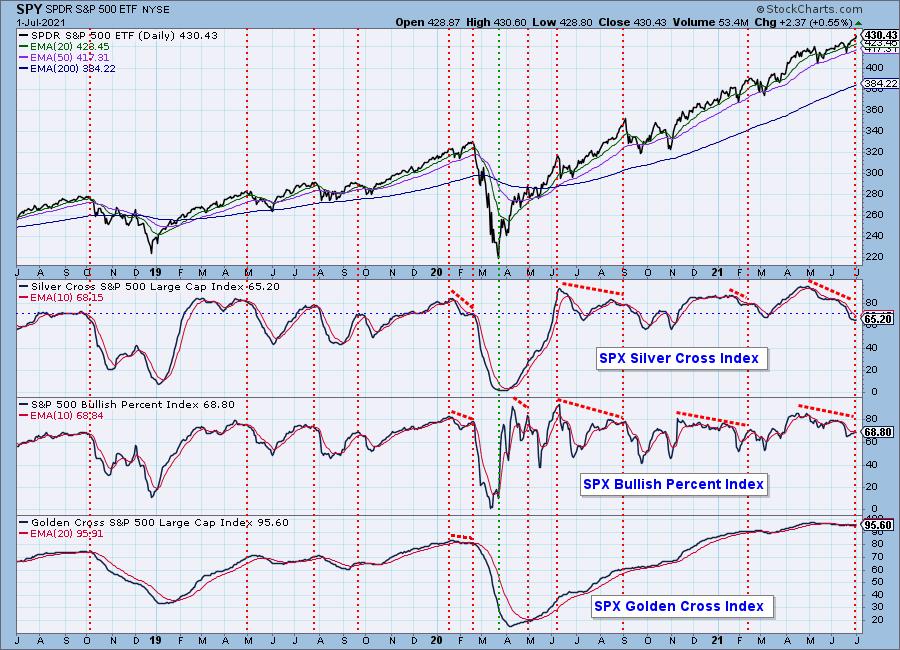
Participation improved greatly today which could mean higher prices after the exhaustion plays out.
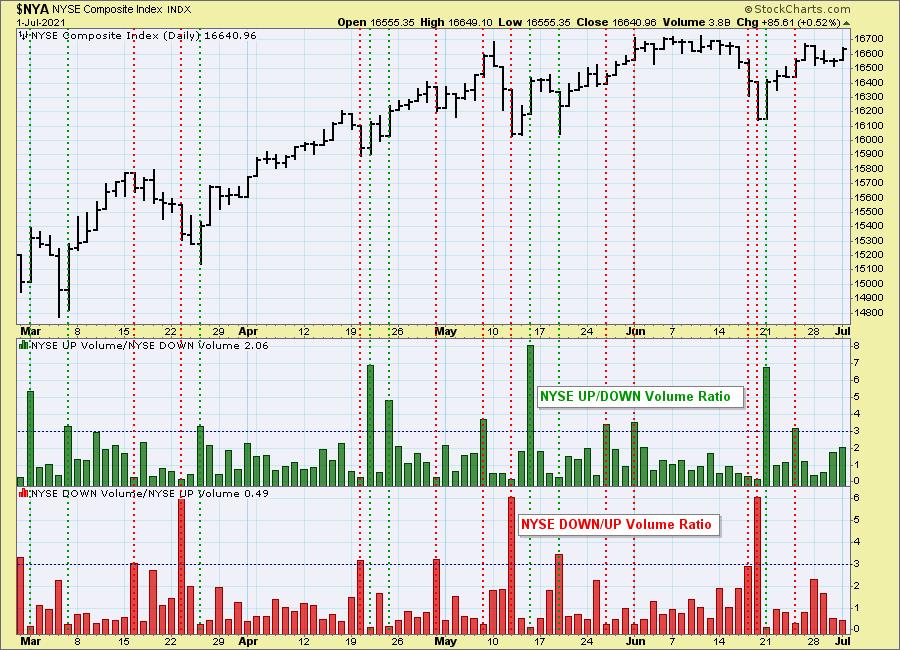
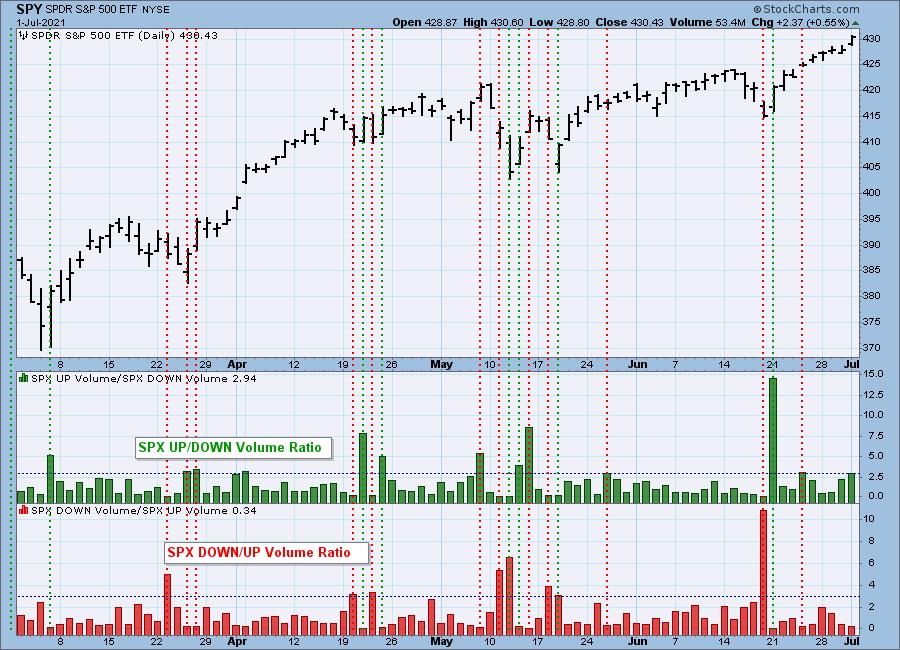
Climax Analysis: I discussed this chart in the opening, but to be consistent, here it is again.
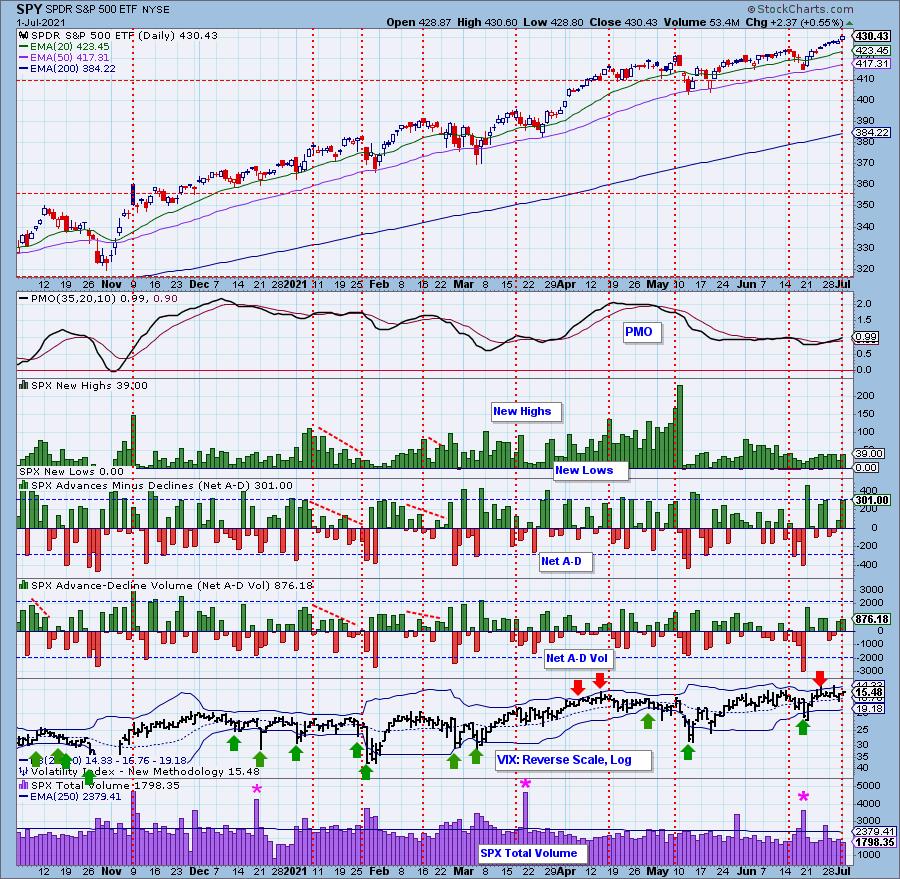
NYSE Up/Down and Down/Up volume ratios are also climax detectors. The 9:1 ratio suggested by the late Dr. Martin Zweig in his book, Winning on Wall Street, is especially significant, but we also look for spikes outside the normal range to clarify a particular event. We have an NYSE and S&P 500 version of the ratios, and normally they will only be published when there is a notable reading.
Given today's climactic readings on new all-time highs, we decided to check the volume ratios for some confirmation. The NYSE didn't register this climax, but the SPX up/down volume ratio did come close to hitting our threshold of 3.0 which in our minds confirms the climax on the SPX.
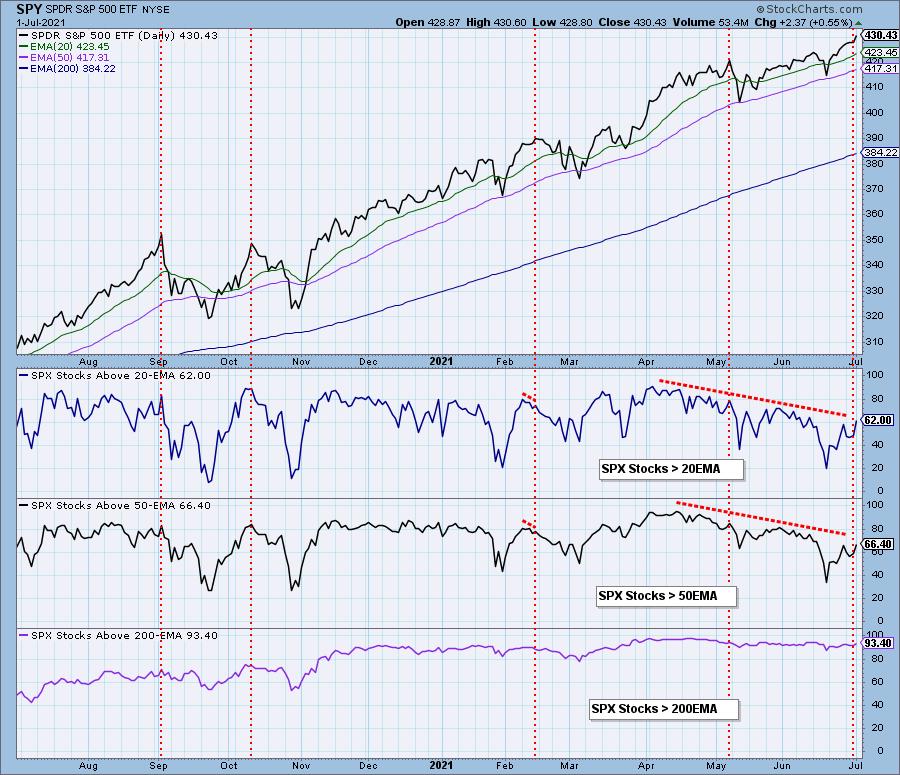
Short-Term Market Indicators: The short-term market trend is UP and the condition is OVERBOUGHT.
Not surprisingly, the STOs did rise today. However, they are very overbought which in my mind confirms the possible buying exhaustion. I do like seeing the increase in %Stocks with PMOs rising. 62% of the SPX have PMOs pointing higher. With a strong short-term rising trend, we really should see higher readings here. This is at least a step in the right direction.
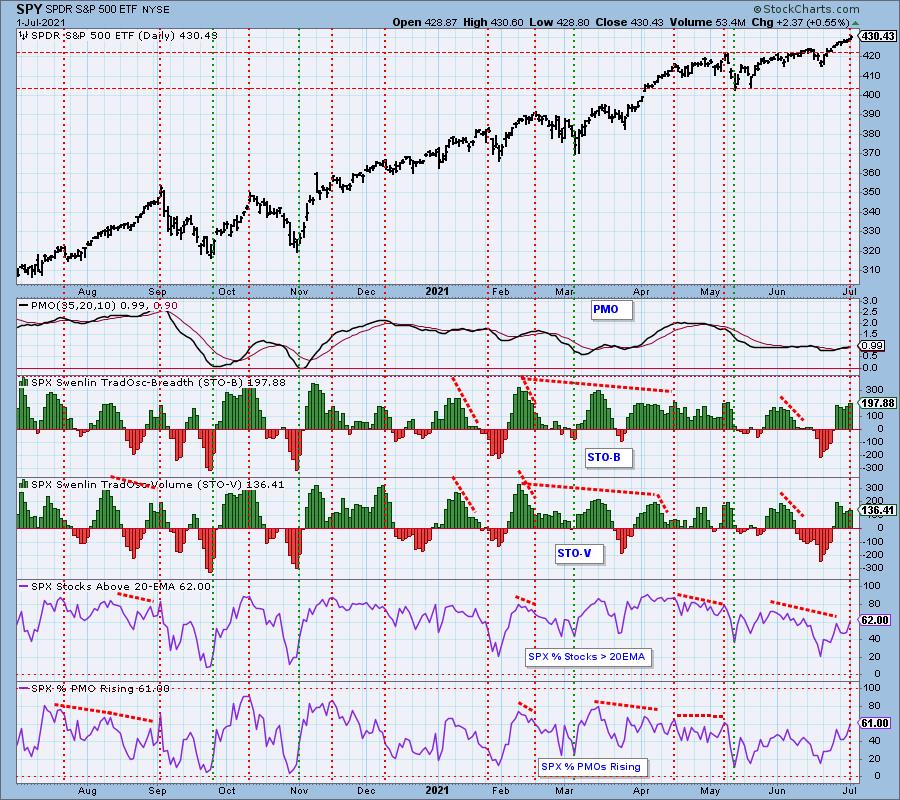
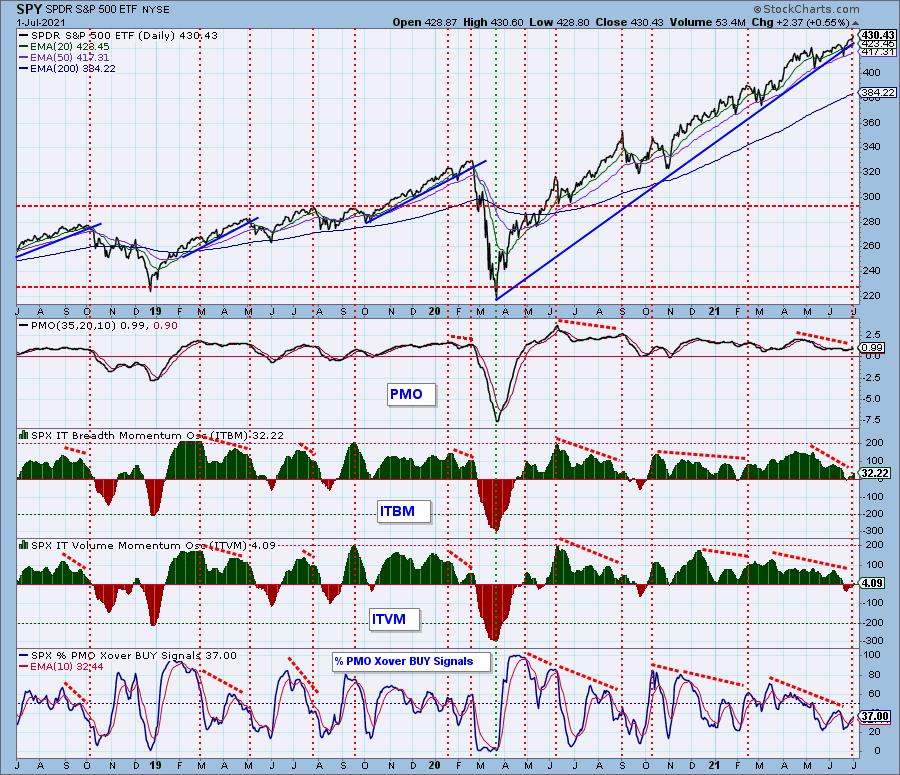
Intermediate-Term Market Indicators: The intermediate-term market trend is UP and the condition is NEUTRAL. The market bias is NEUTRAL.
The ITBM/ITVM rose today, but they remain in neutral territory. Only a paltry 37% of stocks are on PMO crossover BUY signals. That should also be much higher given new all-time highs.
CONCLUSION: The market popped higher to new all-time highs today, but this caused a likely upside exhaustion climax. This "buying exhaustion" tells us that in the very short term to expect the market to decline. We did see some improvement on participation indicators, but with only 37% of the SPX on PMO BUY signals and less than 2/3rds with rising momentum, this exhaustion could trigger the decline we are expecting. In any case, we expect lower prices during tomorrow's trading. We'll reassess the indicators tomorrow in the Weekly Wrap to determine what to expect next.
Have you subscribed the DecisionPoint Diamonds yet? DP does the work for you by providing handpicked stocks/ETFs from exclusive DP scans! Add it with a discount! Contact support@decisionpoint.com for more information!
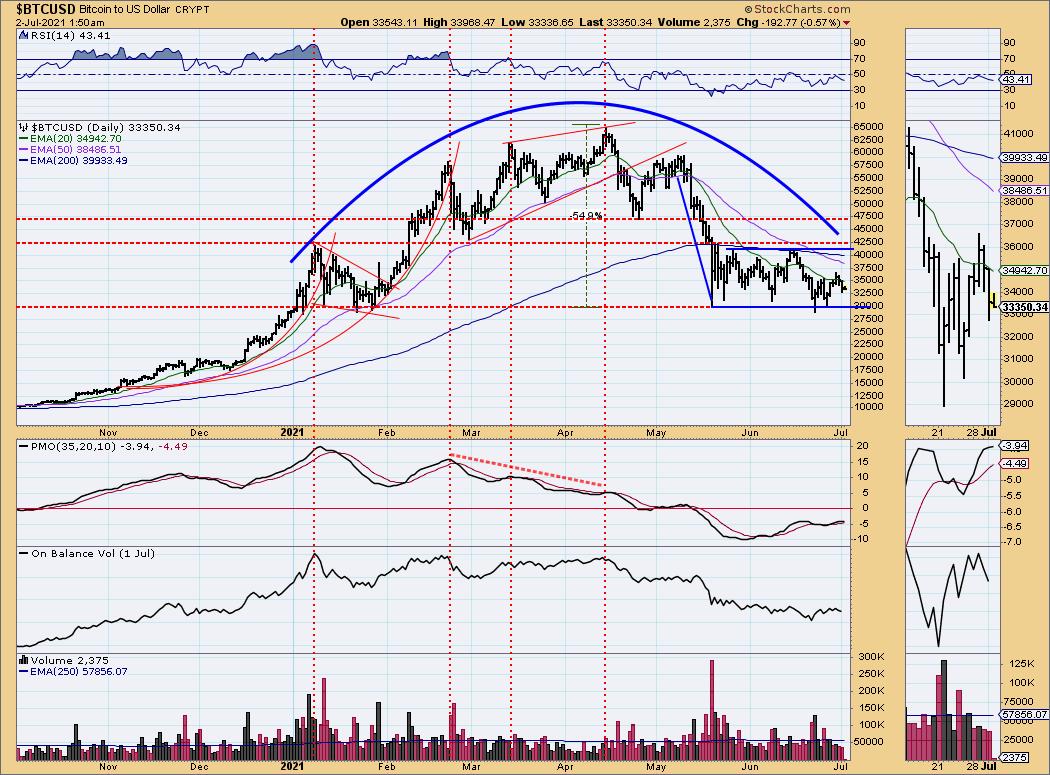
BITCOIN
Bitcoin dropped heavily today. In our "ETF Tracker" it was the worst performer, down over 4.5%. The RSI has turned down below net neutral (50) and the PMO is topping. Bitcoin has aborted the short-term bullish double-bottom. Since price turned down before testing overhead resistance at 40,000, this time around support may not hold at 30,000 so be careful.
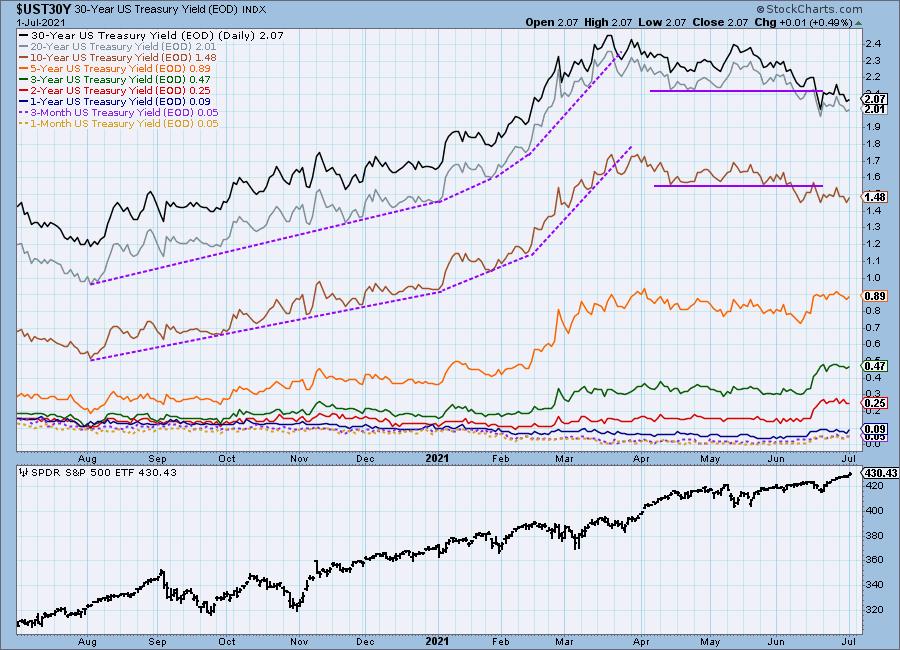
INTEREST RATES
Long-term yields ticked higher today.
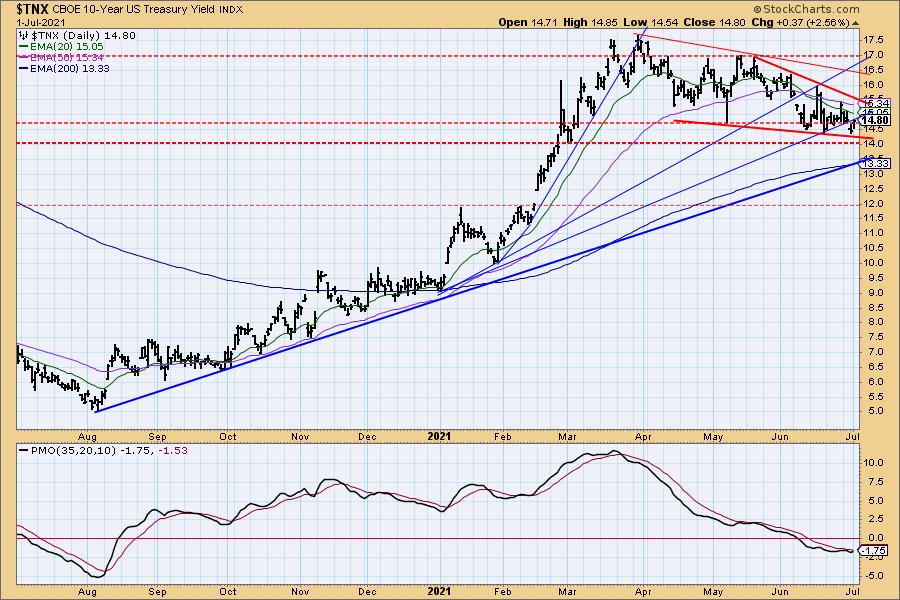
10-YEAR T-BOND YIELD
After testing the bottom of the bullish falling wedge, the 10-year yield bounced higher. The expectation is a breakout from the pattern at about 15.5.
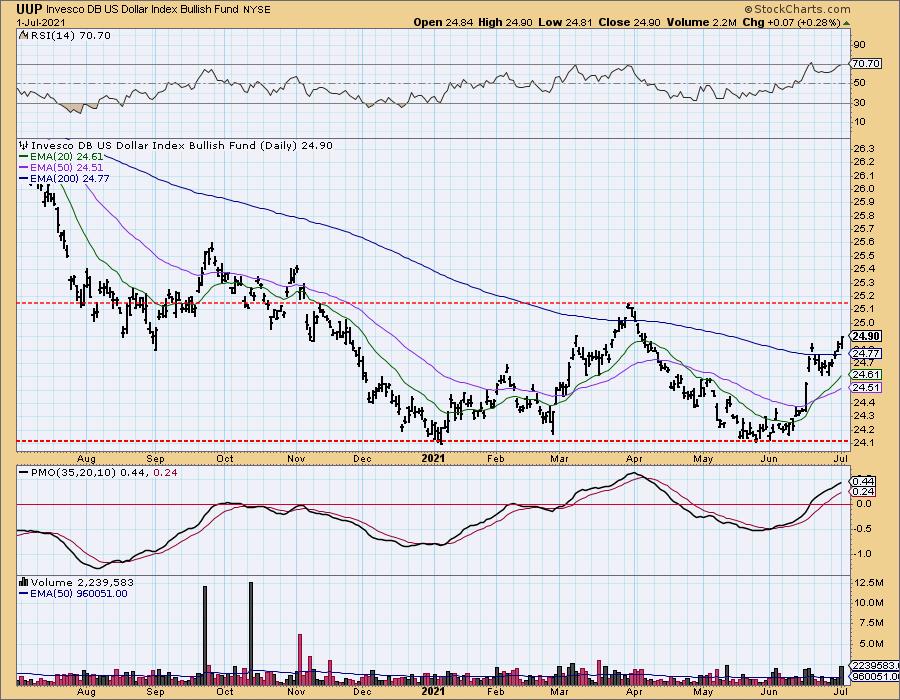
DOLLAR (UUP)
IT Trend Model: BUY as of 6/22/2021
LT Trend Model: SELL as of 7/10/2020
UUP Daily Chart: UUP is rallying strongly, but the RSI has now reached overbought territory. The PMO is following suit. Volume spiked on UUP so maybe the Dollar will have an exhaustion climax of its own.
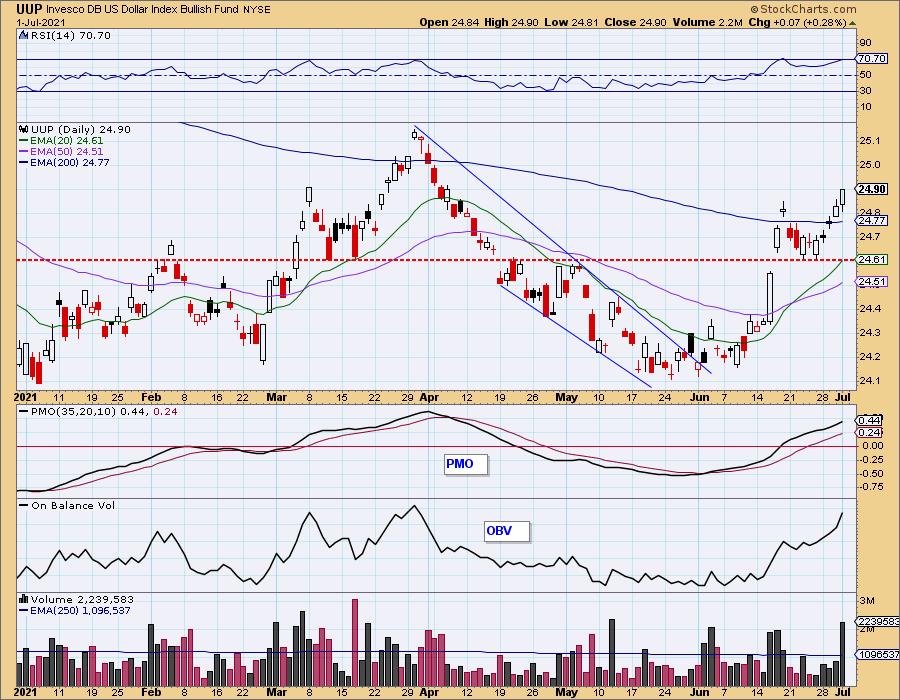
Yet, the one-year chart is very bullish as we see the breakout from the bullish cup and handle pattern. This rally may need a moment to catch its breath after this breakout, but the pattern suggests higher prices should continue. Next stop is the confirmation line (April top) of a very large double-bottom pattern.
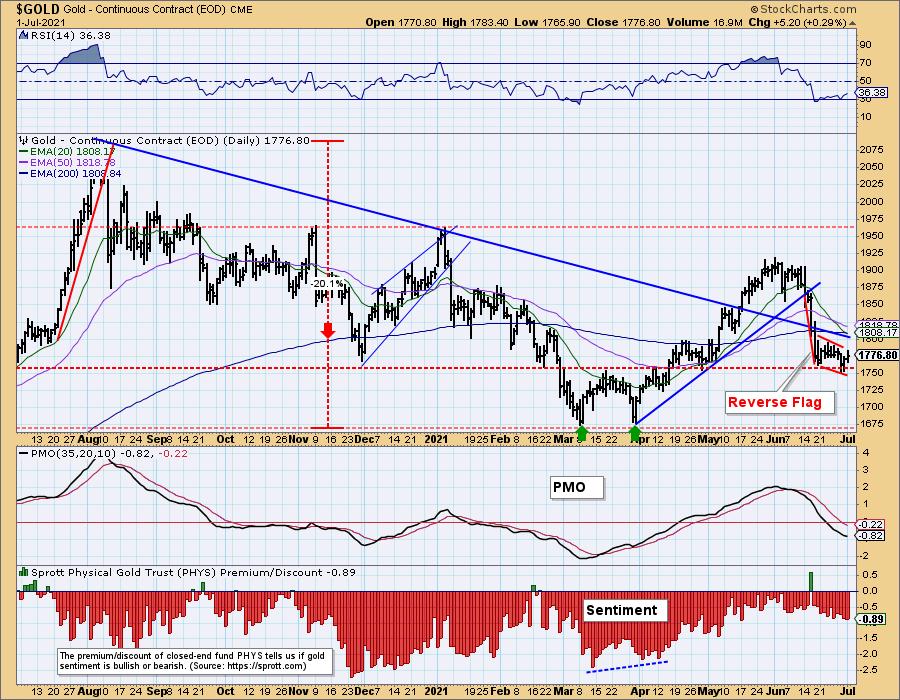
GOLD
IT Trend Model: NEUTRAL as of 6/25/2021
LT Trend Model: BUY as of 5/24/2021
GLD Daily Chart: A rising Dollar generally hurts Gold prices but it hasn't been a problem over the last two days. GLD has closed the gap that was formed on Tuesday suggesting it will continue to rise. Additionally, there is a bullish reverse island formation developing again.
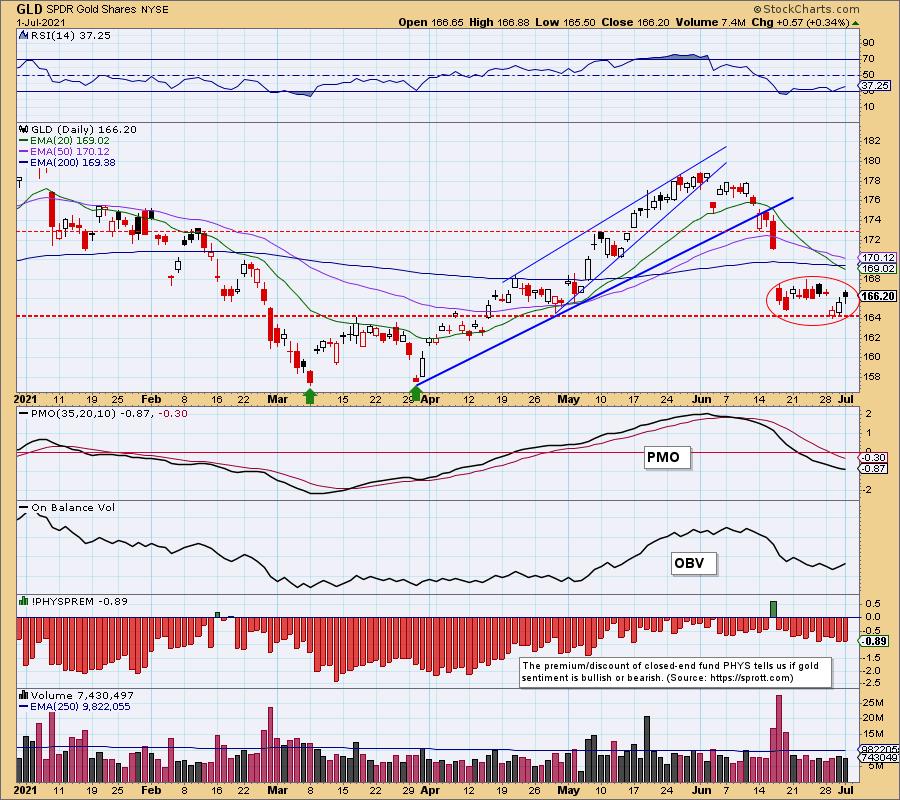
The rally did not erase the bearish reverse flag, but as I noted yesterday, the flag is in a declining trend channel rather than a rising one. Those reverse flag patterns have a tendency not to execute to the downside as expected. They many time will abort. With the rally of the past two days, we could be looking at a pivot point for Gold.
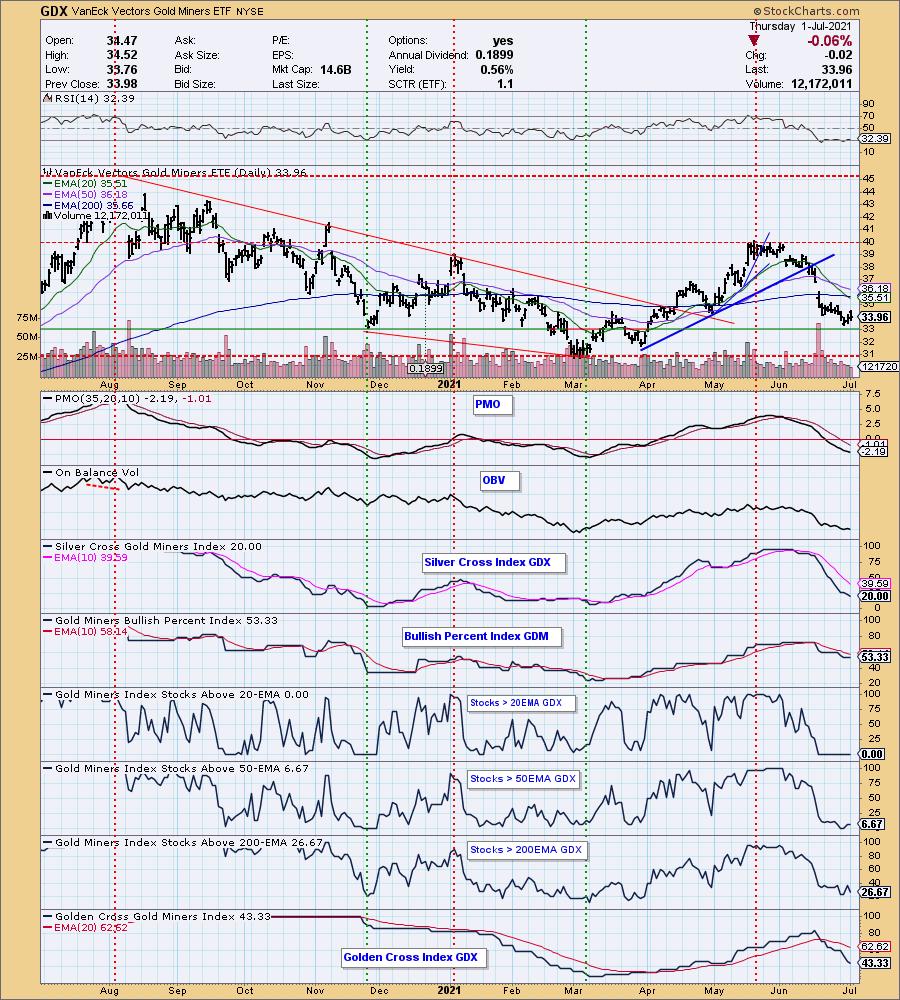
Gold Miners (GDX): With Gold rallying, we could also be at a pivot point for Gold Miners. The only problem is we aren't seeing much improvement in participation. The SCI is also pointed down.
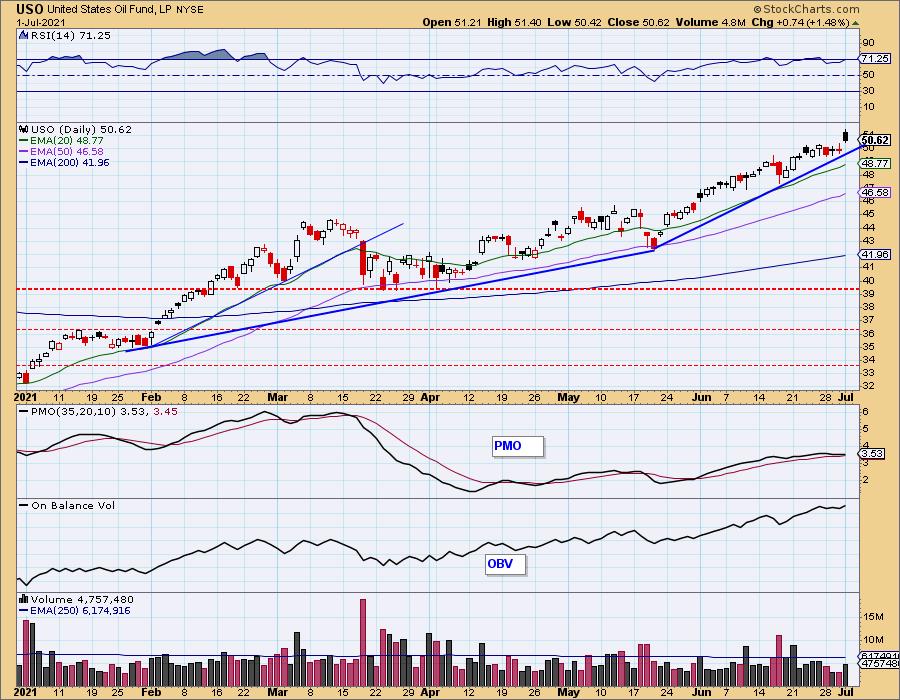
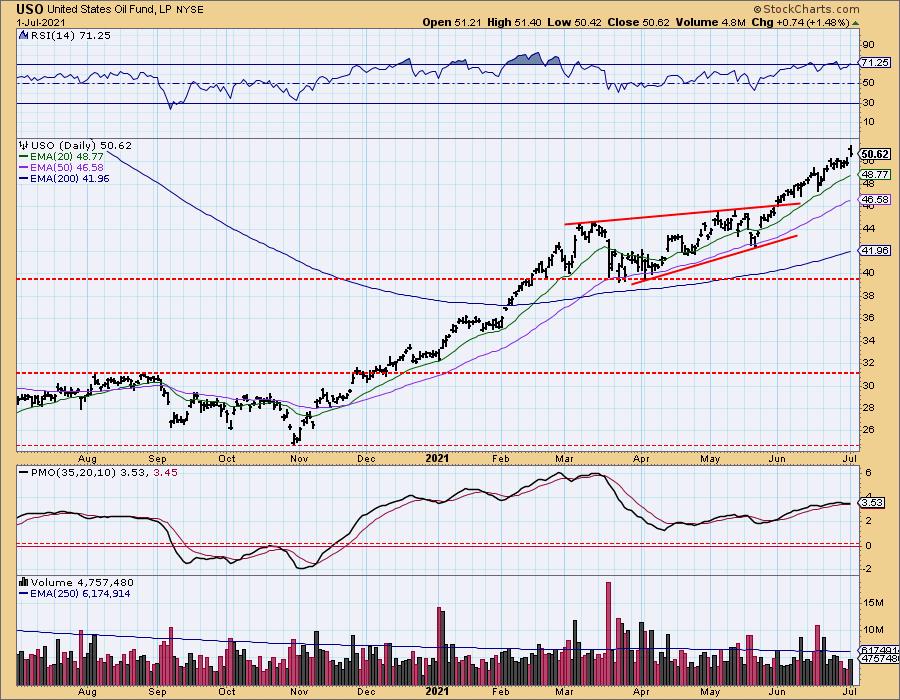
CRUDE OIL (USO)
IT Trend Model: BUY as of 11/23/2020
LT Trend Model: BUY as of 3/9/2021
USO Daily Chart: Crude Oil popped higher today and continues to maintain its rising trend. The RSI is now overbought, but looking back at February, that isn't necessarily a problem. The PMO is not overbought and is rising so I don't see any reason why this rising trend will be compromised.
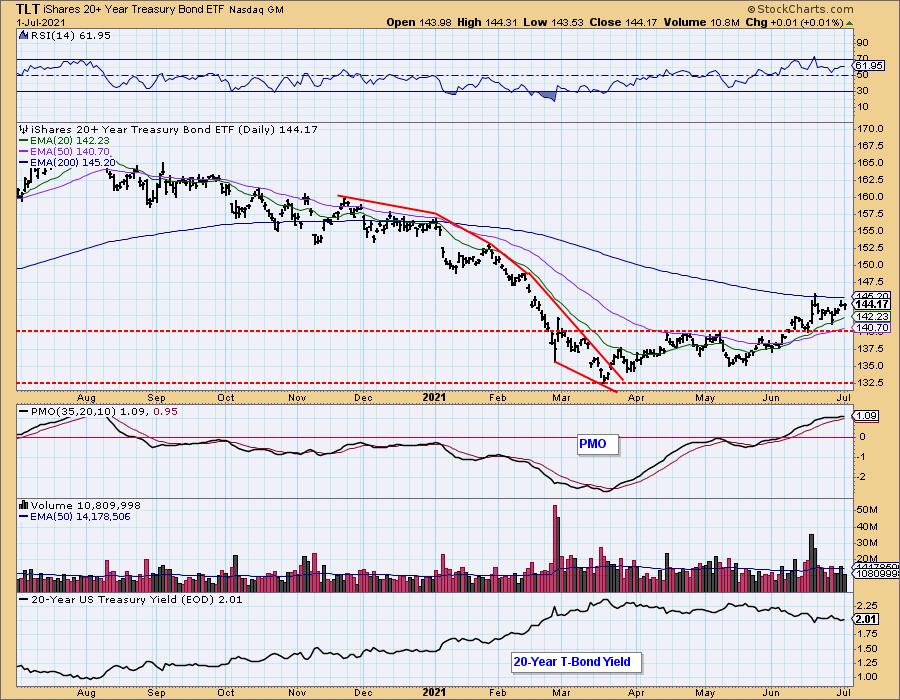
BONDS (TLT)
IT Trend Model: BUY as of 6/10/2021
LT Trend Model: SELL as of 1/8/2021
TLT Daily Chart: TLT was mostly unchanged today. The 200-EMA is still looming as overhead resistance.
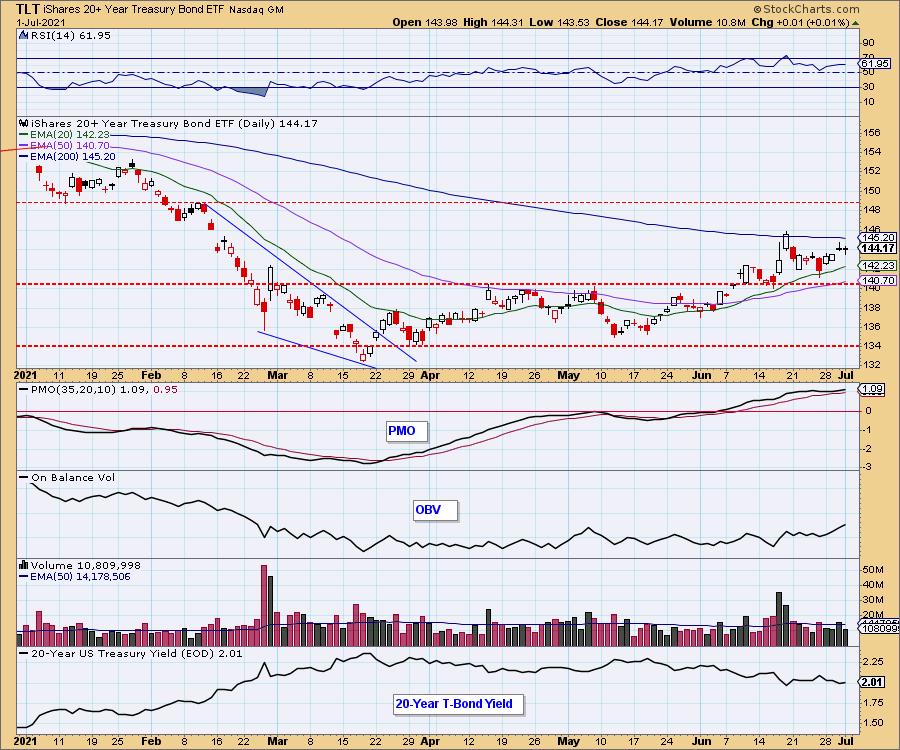
The PMO has begun to accelerate higher and the RSI is positive so we could see that breakout soon.
Happy Charting!
Erin Swenlin
Technical Analysis is a windsock, not a crystal ball.
Pictures from today's hikes:


Disclaimer: This blog is for educational purposes only and should not be construed as financial advice. The ideas and strategies should never be used without first assessing your own personal and financial situation, or without consulting a financial professional. Any opinions expressed herein are solely those of the author, and do not in any way represent the views or opinions of any other person or entity.
NOTE: The signal status reported herein is based upon mechanical trading model signals, specifically, the DecisionPoint Trend Model. They define the implied bias of the price index based upon moving average relationships, but they do not necessarily call for a specific action. They are information flags that should prompt chart review. Further, they do not call for continuous buying or selling during the life of the signal. For example, a BUY signal will probably (but not necessarily) return the best results if action is taken soon after the signal is generated. Additional opportunities for buying may be found as price zigzags higher, but the trader must look for optimum entry points. Conversely, exit points to preserve gains (or minimize losses) may be evident before the model mechanically closes the signal.
Helpful DecisionPoint Links:
DecisionPoint Alert Chart List
DecisionPoint Golden Cross/Silver Cross Index Chart List
DecisionPoint Sector Chart List
Price Momentum Oscillator (PMO)
Swenlin Trading Oscillators (STO-B and STO-V)
DecisionPoint is not a registered investment advisor. Investment and trading decisions are solely your responsibility. DecisionPoint newsletters, blogs or website materials should NOT be interpreted as a recommendation or solicitation to buy or sell any security or to take any specific action.
(c) Copyright 2021 DecisionPoint.com