
During our weekly staff meeting, Carl suggested we add the Relative Rotation Graph (RRG) for the SPX sectors to the DP Alert. The DP staff was in agreement, all two of us!
I want to cover in simple terms what an RRG shows us and what we should look for.
Below is today's RRG. There are two versions, a daily and a weekly. We will be using the "daily" version as it hones in on short-term strength and rotation which is most important for our readers.
The four quadrants are clearly marked. Best being the "Leading" category and worst being the "Lagging" category. Typically you'll see stocks circle around the center point which is the SPX. We are not measuring individual performance, but relative performance against the SPX.
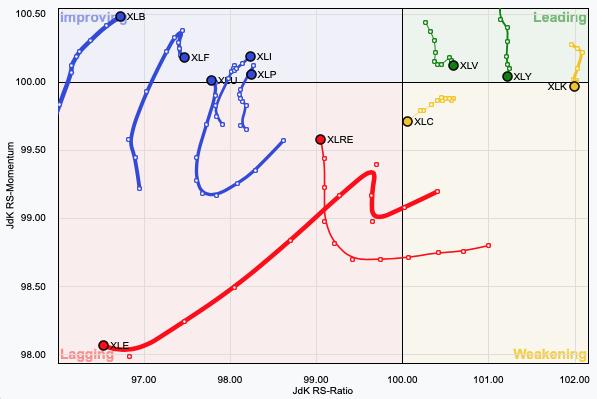
The best "heading" is northeast, the worst is southwest. Leading is in the upper right so a heading in that direction is bullish. Lagging is in the bottom left so a heading in that direction is bearish. I'll analyze the chart in the "Sector" section.
There are certainly more intricacies to these charts so for an in-depth understanding, here is a link to the ChartSchool article about RRG. I also know that the creator, Julius de Kempenaer will take emails at juliusdk@stockcharts.com if you have further questions.
The DecisionPoint Alert Weekly Wrap presents an end-of-week assessment of the trend and condition of the Stock Market, the U.S. Dollar, Gold, Crude Oil, and Bonds. The DecisionPoint Alert daily report (Monday through Thursday) is abbreviated and gives updates on the Weekly Wrap assessments.
Watch the latest episode of DecisionPoint on StockCharts TV's YouTube channel here!
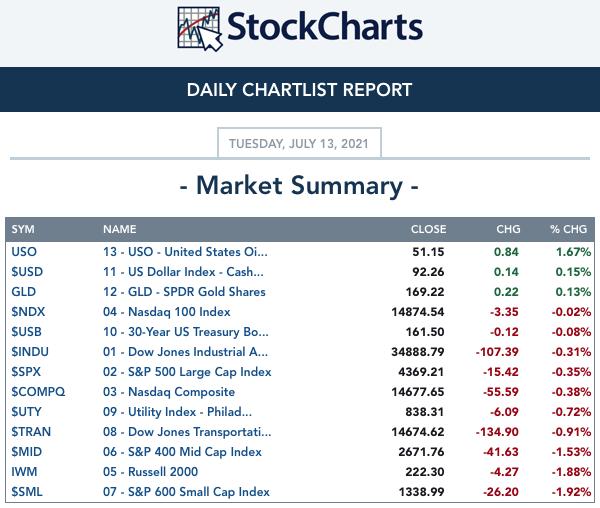
MAJOR MARKET INDEXES
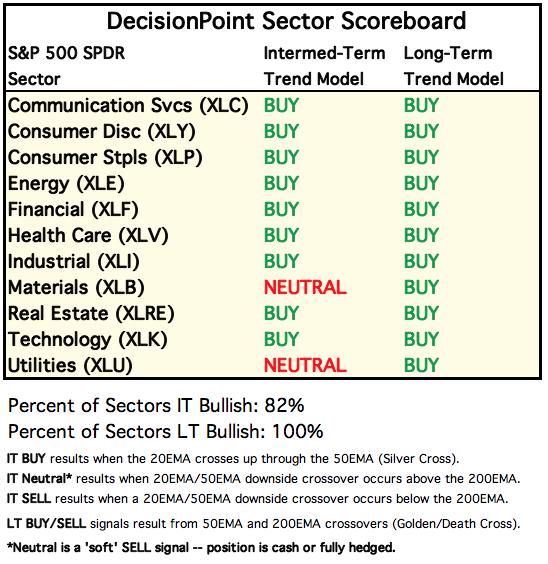
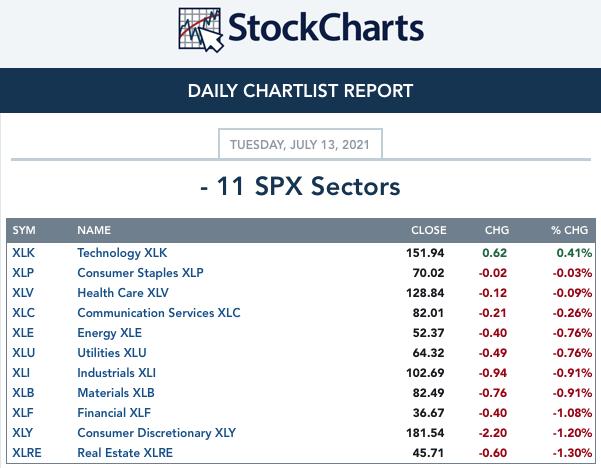
SECTORS
Each S&P 500 Index component stock is assigned to one, and only one, of 11 major sectors. This is a snapshot of the Intermediate-Term (Silver Cross) and Long-Term (Golden Cross) Trend Model signal status for those sectors.
RRG Chart: I normally will not write comments about the RRG unless there is something particularly noteworthy, but since it is 'new' to the DPA, I'll talk about it. Although Healthcare and Discretionary are in the Leading quadrant, they are beginning to lose strength. Technology is now in the Weakening category with Communications heading toward Lagging. If the Tech sector begins to fail, the market could likely follow suit. I wasn't completely surprised to see Materials beginning to improve as I've gotten quite a few of those stocks from my "Diamond" scans. XLRE has been heating up and is headed toward Improving. It should be no surprise that Energy is Lagging in a big way.

CLICK HERE for an animated version of the RRG chart.
CLICK HERE for Carl's annotated Sector charts.
THE MARKET (S&P 500)
IT Trend Model: BUY as of 5/8/2020
LT Trend Model: BUY as of 6/8/2020
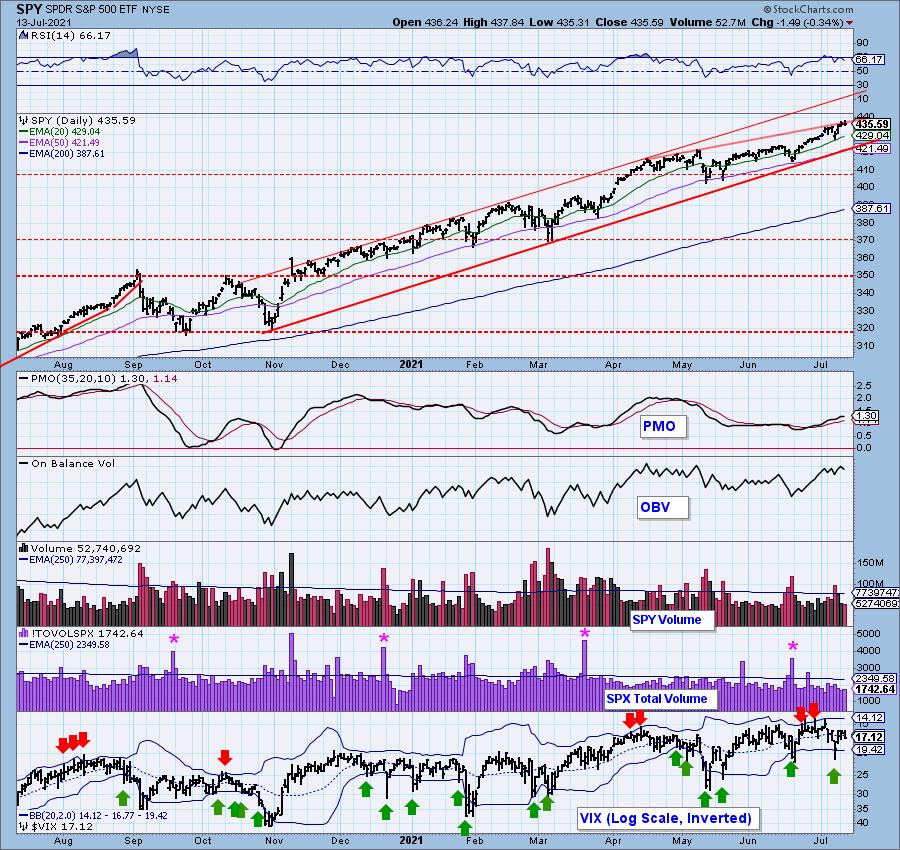
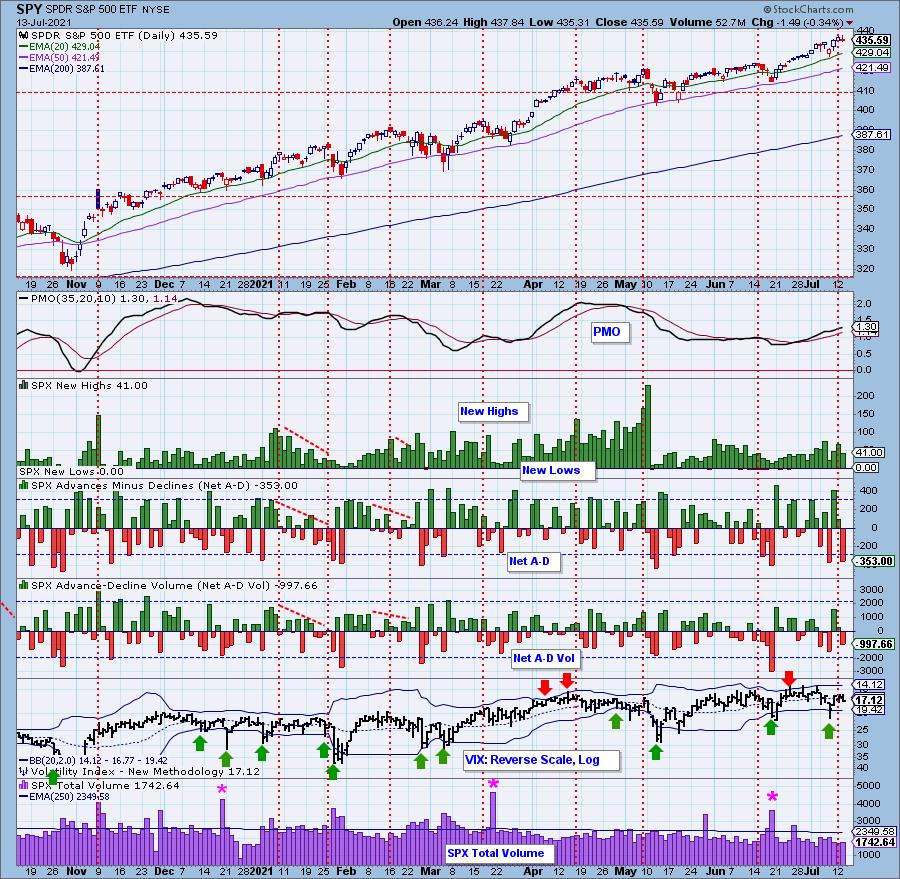
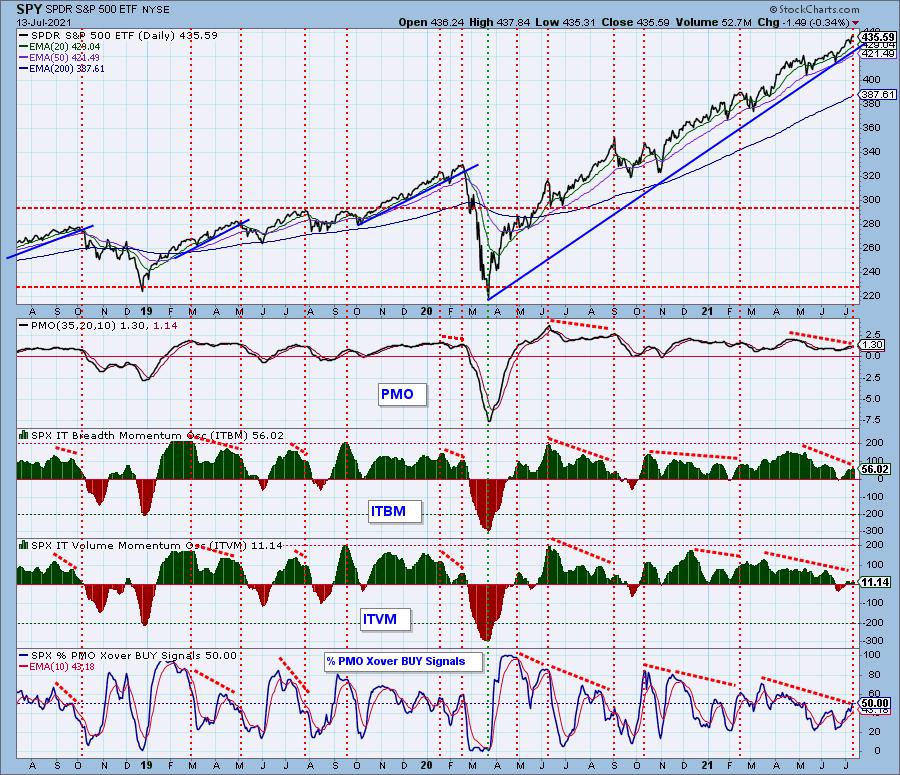
SPY Daily Chart: The market closed lower today leaving a long wick on the candlestick. This is very close to being a bearish "shooting star" candle. Total volume was below the annual average, but in line with the last three days of trading.
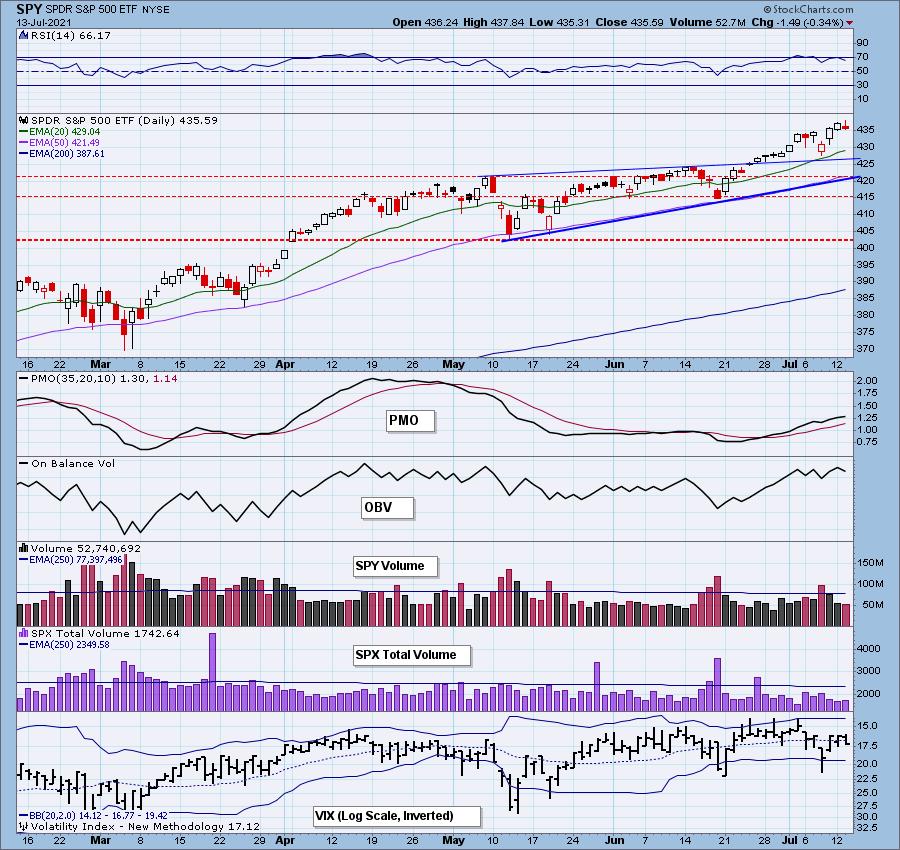
The RSI moved out of overbought territory, but the PMO is beginning to flatten even before reaching overbought territory. We have a new bearish rising wedge within the longer-term rising trend channel.

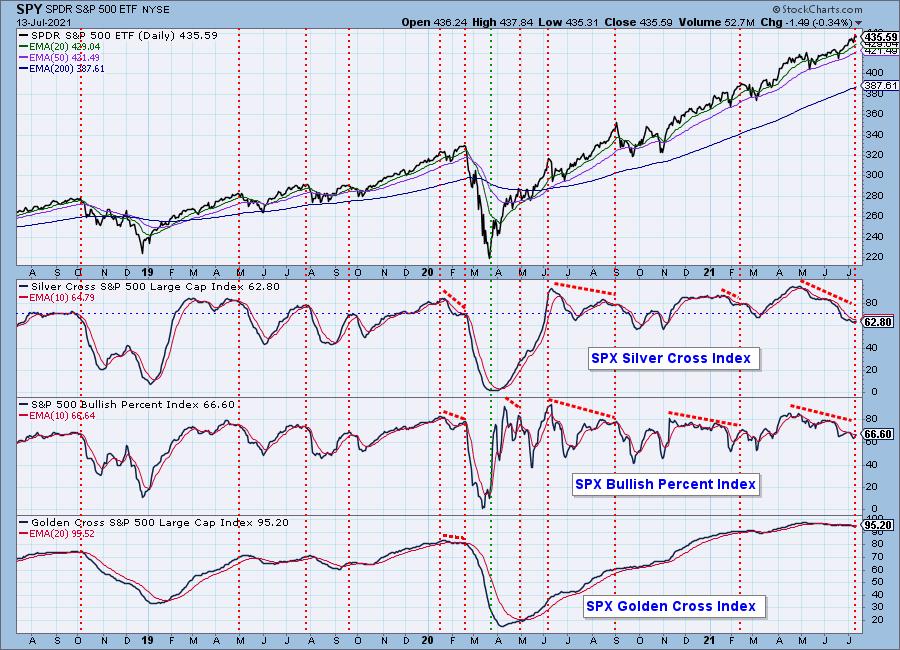
Participation: The following chart uses different methodologies for objectively showing the depth and trend of participation for intermediate- and long-term time frames.
- The Silver Cross Index (SCI) shows the percentage of SPX stocks on IT Trend Model BUY signals (20-EMA > 50-EMA).
- The Golden Cross Index (GCI) shows the percentage of SPX stocks on LT Trend Model BUY signals (50-EMA > 200-EMA).
- The Bullish Percent Index (BPI) shows the percentage of SPX stocks on Point & Figure BUY signals.
The BPI nearly had a positive crossover today, but the SCI is falling. The GCI rose slightly by 0.20%.
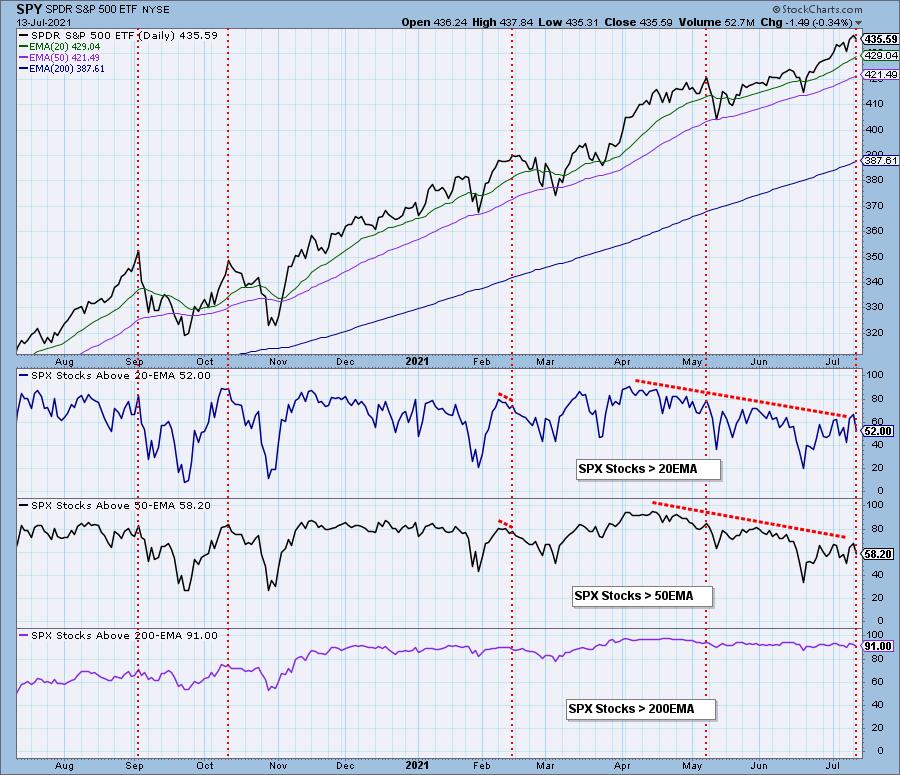
Yesterday we had finally begun to see more stocks above their 20/50-EMAs than stocks with "Silver Crosses". Today the tables turned and we are seeing quite a bit of damage. Of the 63% of stocks with silver crosses, 11% have price below their 20-EMA and about 5% have price below their 50-EMAs. This puts the SCI in jeopardy of losing more ground.
Climax Analysis: Today we had a downside initiation climax. Net A-D readings were negative and outside the climax range. Net A-D Volume wasn't that climactic but was elevated. New Highs contracted. The VIX is now below its EMA on the inverted scale suggesting some nervousness among investors.
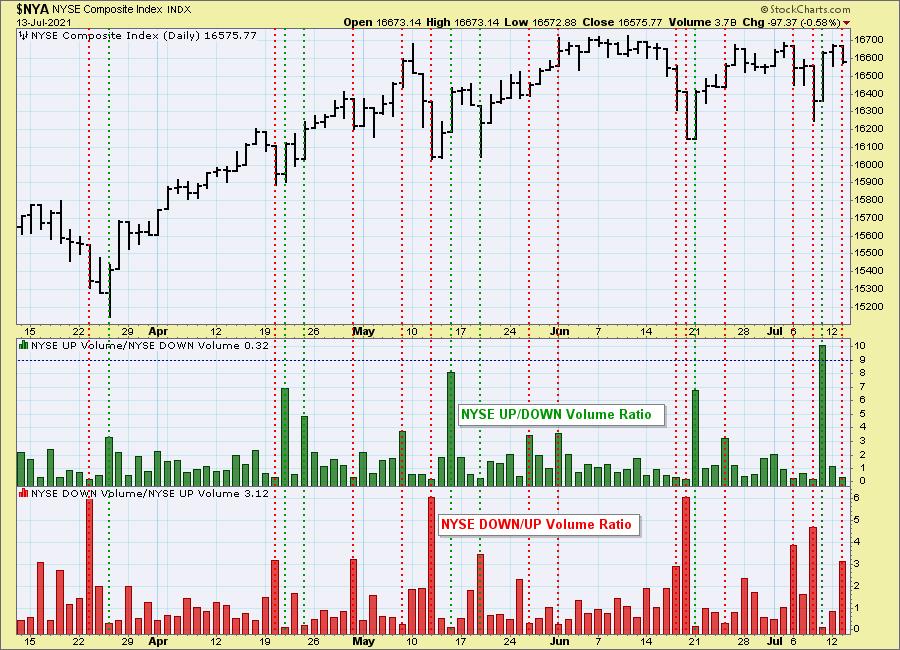
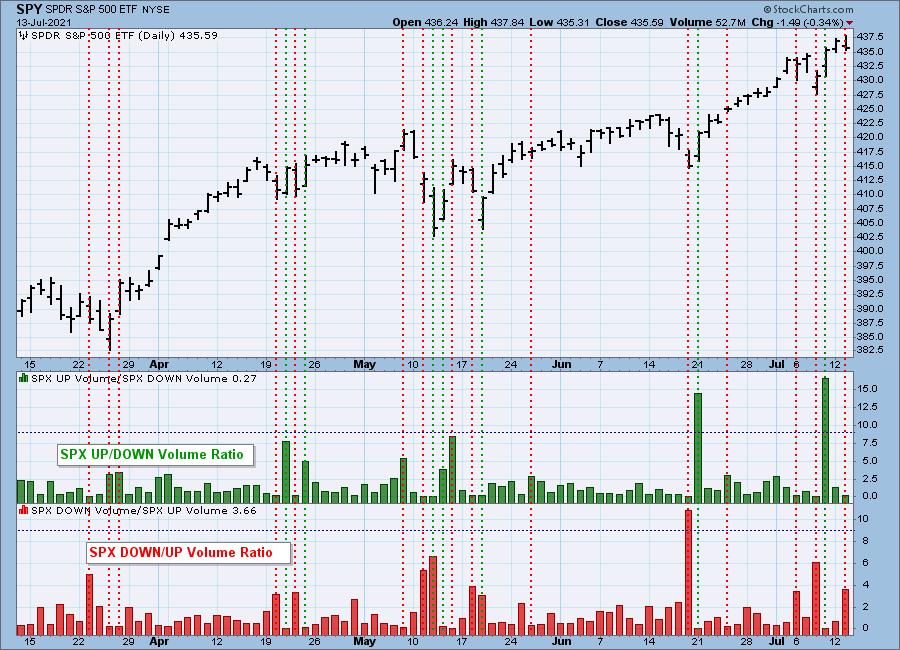
NYSE Up/Down and Down/Up volume ratios are also climax detectors. The 9:1 ratio suggested by the late Dr. Martin Zweig in his book, Winning on Wall Street, is especially significant, but we also look for spikes outside the normal range to clarify a particular event. We have an NYSE and S&P 500 version of the ratios, and normally they will only be published when there is a notable reading.
I found that the Volume Ratios both confirmed today's downside initiation climax with elevated Down/Up Volume Ratio readings. We use 3:1 ratio for our climax analysis confirmations. We consider it an initiation climax given today is the first down day of a possible trend reversal.
Short-Term Market Indicators: The short-term market trend is UP and the condition is NEUTRAL.
I had a feeling the buying initiation wouldn't last long given the STOs have continued to decline in a negative divergence with price. They are still dropping and are not oversold yet. Notice the damage done to %PMOs Rising. Less than half of the index has rising momentum.
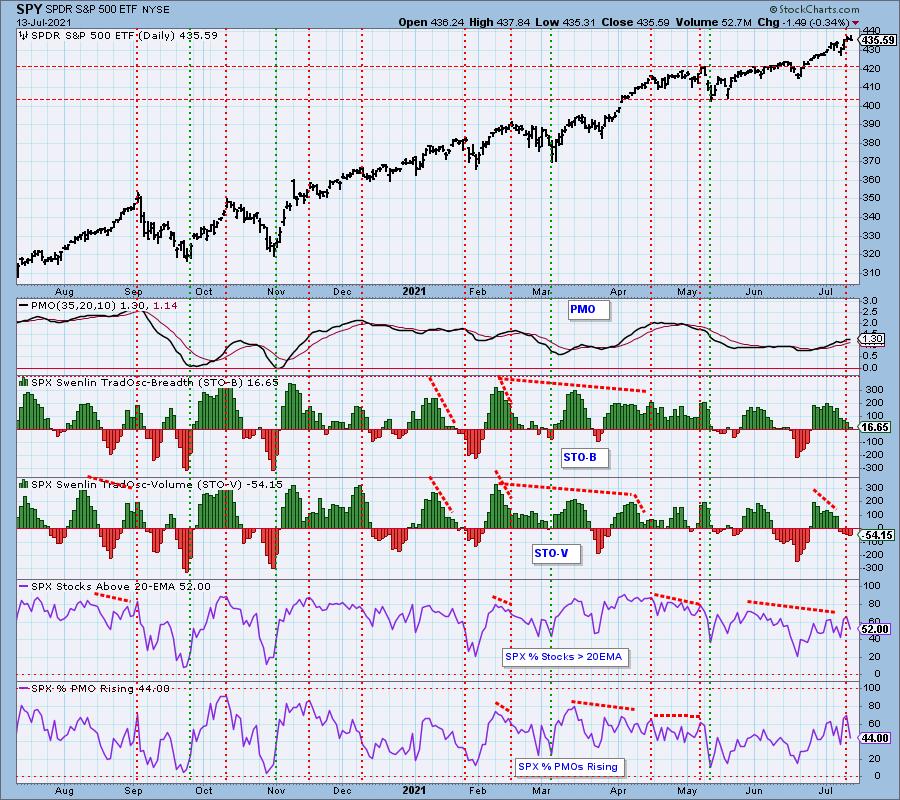
Intermediate-Term Market Indicators: The intermediate-term market trend is UP and the condition is NEUTRAL. The market bias is NEUTRAL.
With only 44% of stocks with rising PMOs (above chart), the 50% of stocks with crossover BUY signals (this chart) will begin to fall soon. All of these indicator readings are neutral for the intermediate term and falling.
CONCLUSION: Yesterday we finally began to see improvement in participation, but today that was erased. Carl pointed out during yesterday's DecisionPoint Show that some of these participation indicators were sitting at somewhat oversold readings, but we both agreed that oversold readings should accompany price lows, not all-time highs. Given the downside initiation climax, we would expect to see the selling resume tomorrow with participation taking another hit. Sector rotation suggests aggressive sectors like Discretionary, Communication Services and Technology are losing relative strength. When these sectors begin to weaken or lag, it typically arrives at the beginning of a pullback or correction. Stay alert and get those stops set.
Have you subscribed the DecisionPoint Diamonds yet? DP does the work for you by providing handpicked stocks/ETFs from exclusive DP scans! Add it with a discount! Contact support@decisionpoint.com for more information!
BITCOIN
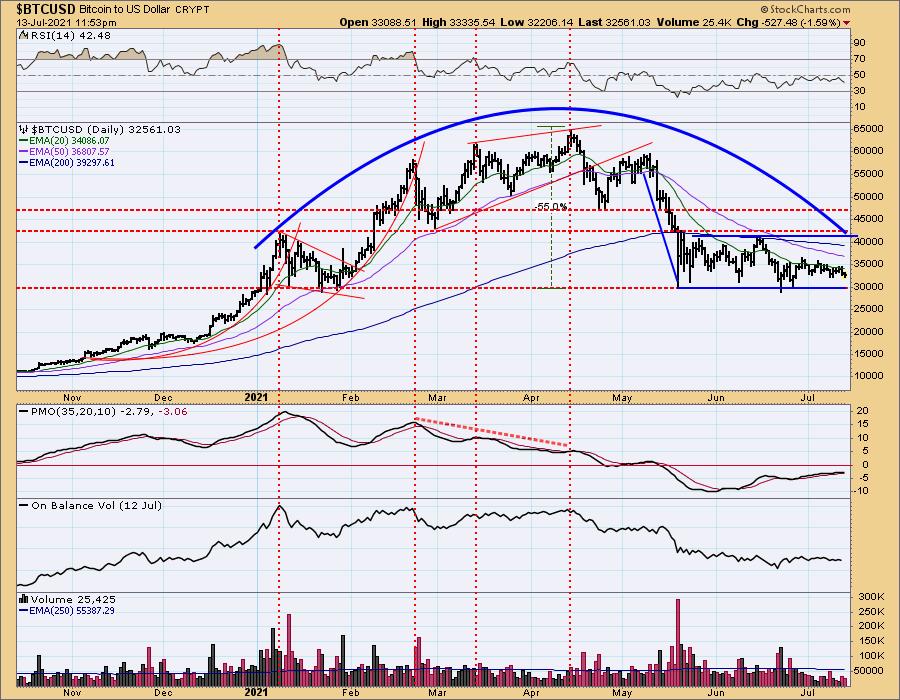
Bitcoin continues to flounder in the bottom half of its price range as represented by the negative RSI. The 20-EMA continues to pressure price lower. It won't be long before we see 30,000 tested.
INTEREST RATES
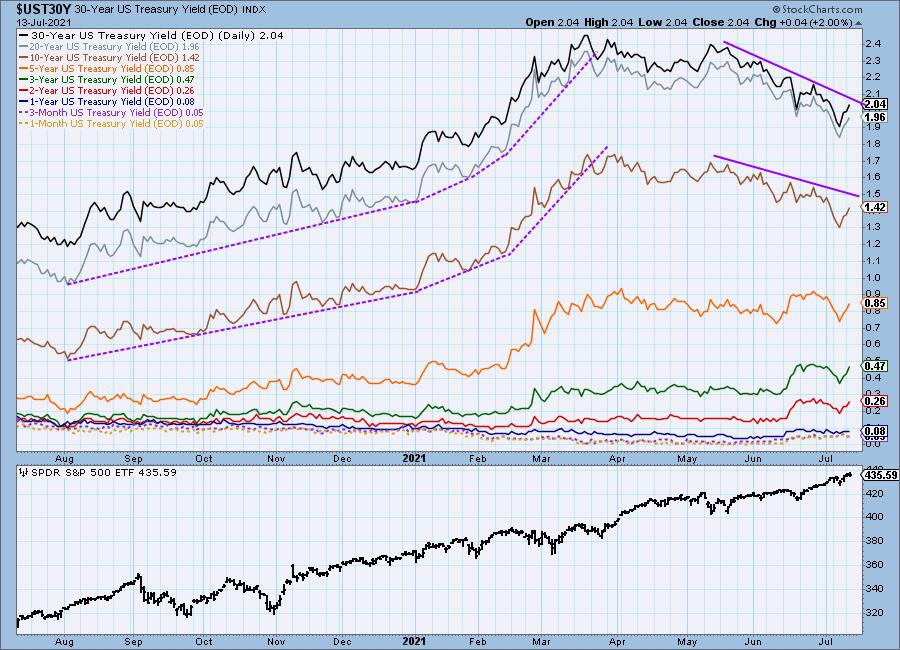
Yields are rising again, but they haven't broken out of their declining trends.
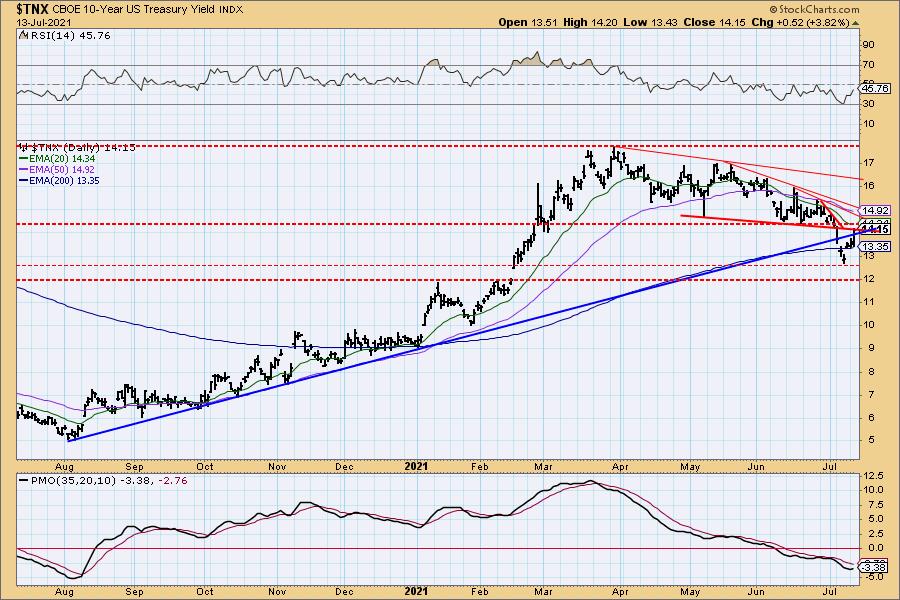
10-YEAR T-BOND YIELD
We can see on the $TNX chart that there is lots of congestion and resistance. The yield closed on the rising bottoms trendline, but it has more work to do. The RSI is now rising and the PMO has turned up again suggesting we will see resistance overcome.
DOLLAR (UUP)
IT Trend Model: BUY as of 6/22/2021
LT Trend Model: SELL as of 7/10/2020
UUP Daily Chart: The Dollar pulled back last week and is making a strong comeback this week. The steep rising trend hasn't been recaptured, but the positive and not overbought RSI, as well as the PMO bottom above the signal line suggest it will recapture the rising trend.
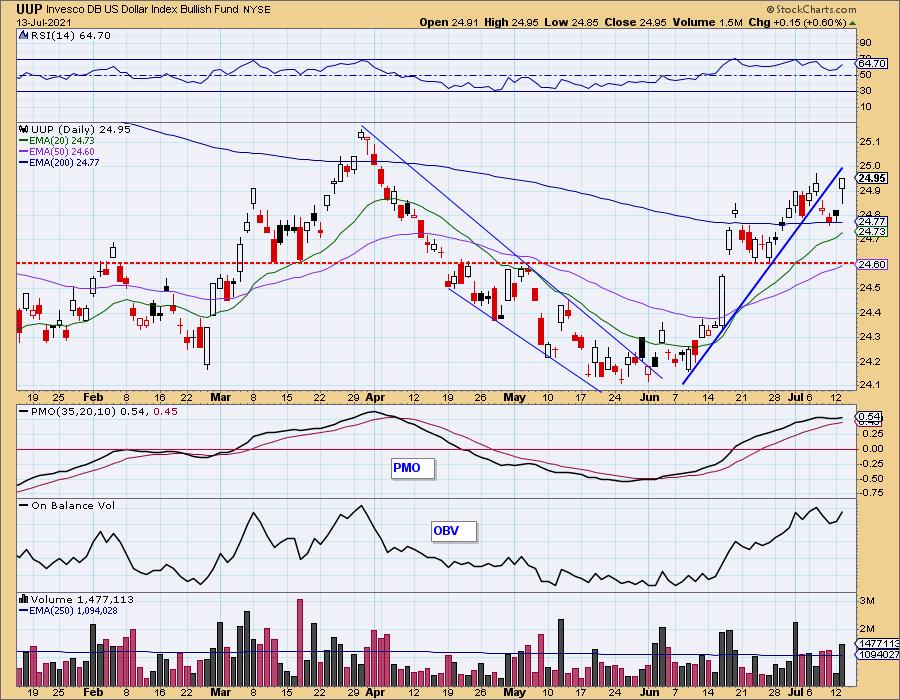
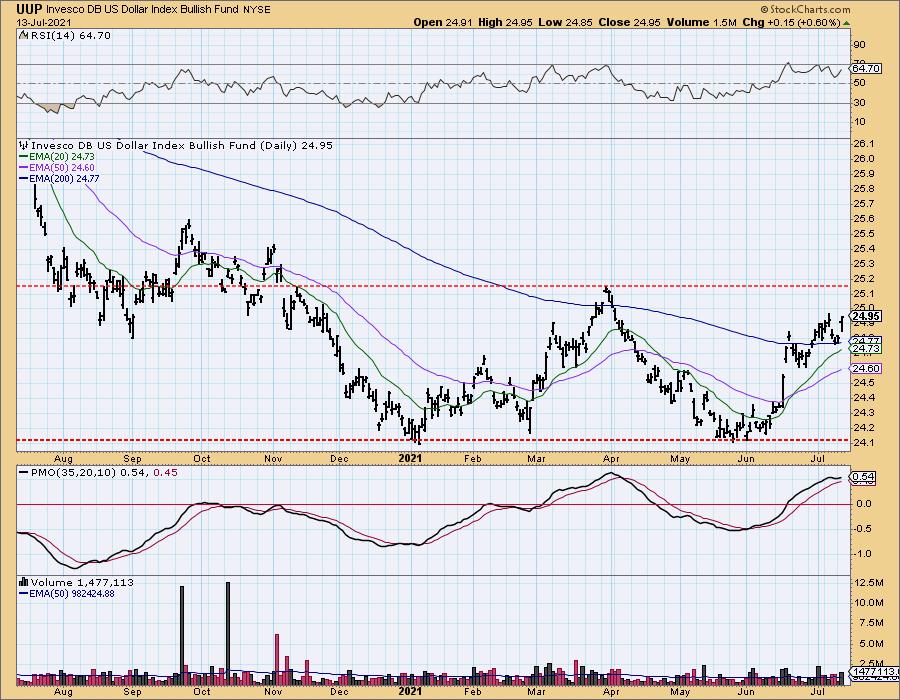
The large double-bottom pattern still looks good on the one-year daily chart, but price will need to test that confirmation line soon or the pattern will be scuttled.
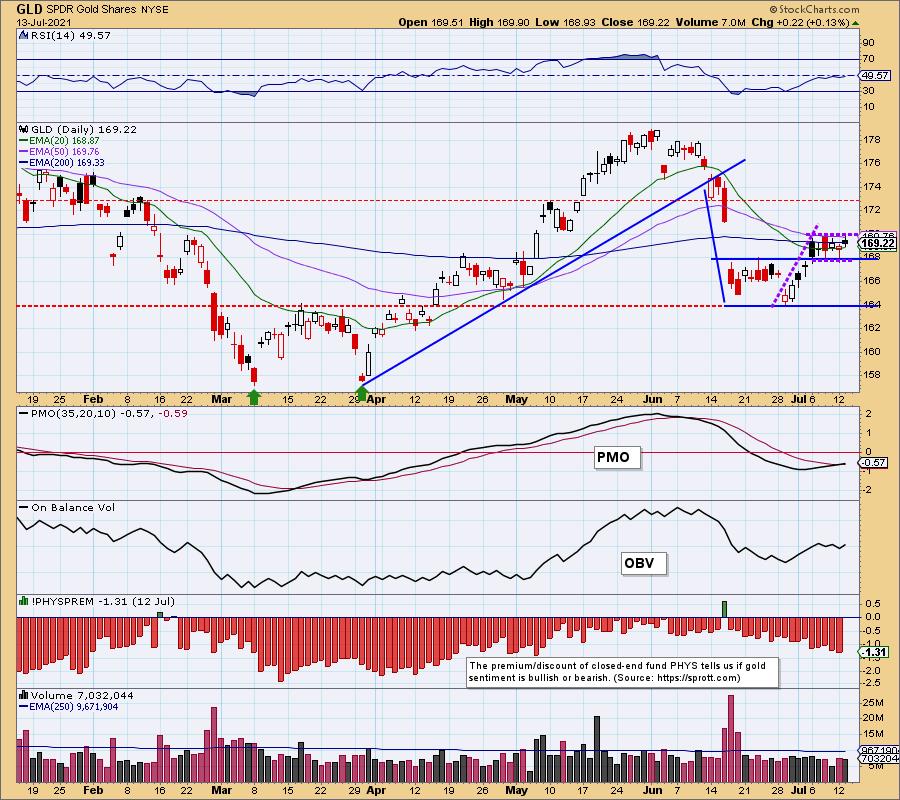
GOLD
IT Trend Model: NEUTRAL as of 6/24/2021
LT Trend Model: BUY as of 5/21/2021
GLD Daily Chart: Gold prices rose despite a strong rally for the Dollar. Price is still bounded by support at the top of the prior trading range and the 50-EMA. I spot a short-term bull flag. Given the PMO crossover BUY signal and nearly positive RSI, I expect a breakout.
GOLD Daily Chart: Discounts are also rising on PHYS. It is good for Gold when sentiment gets bearish.
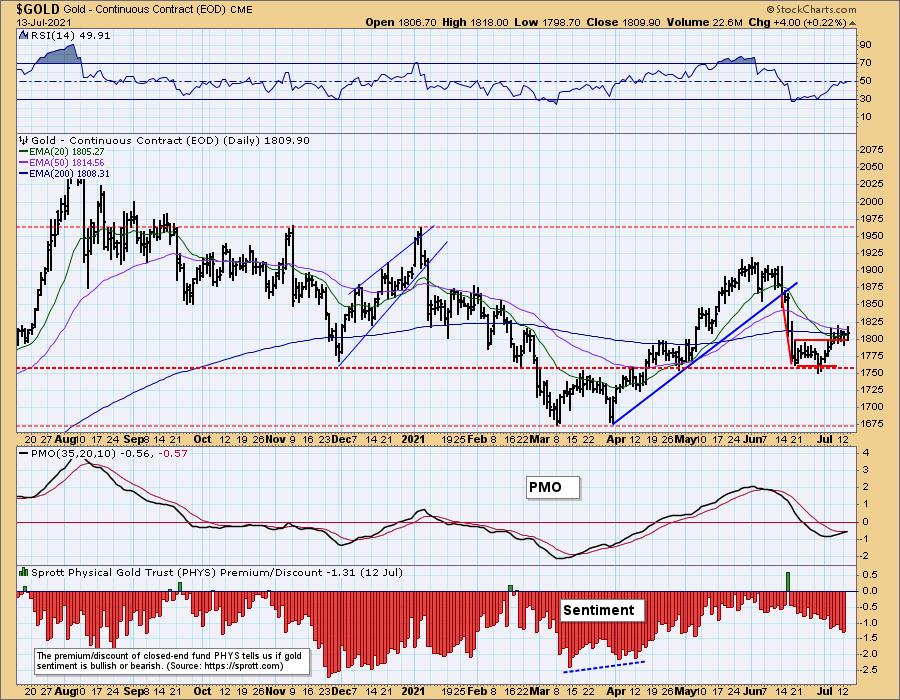
Full Disclosure: I own GLD.
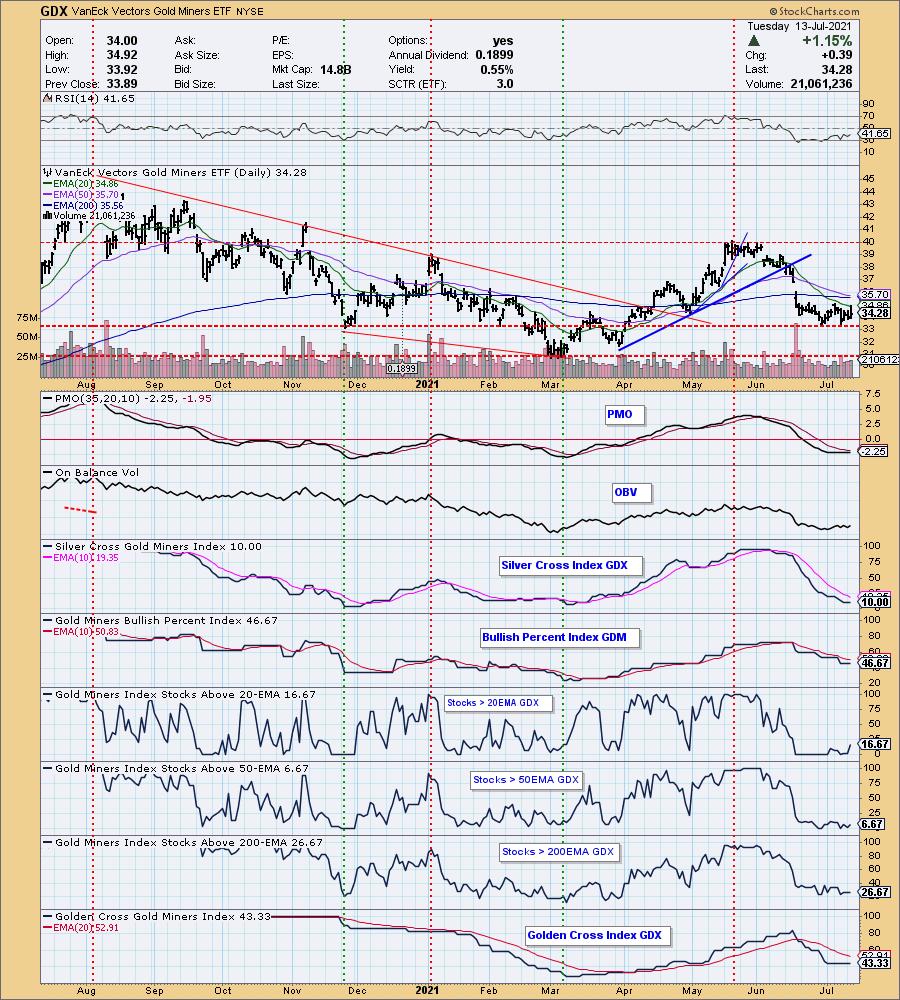
GOLD MINERS Golden and Silver Cross Indexes: I am chomping at the bit for Gold Miners to improve participation. GDX is holding above support, but I need to see a close above the 20-EMA and more improvement in participation. It is very oversold right now and the PMO and RSI are beginning to come back to life. More than likely we will get a LT Trend Model "Death Cross" SELL signal soon given the 50-EMA is nearing a negative crossover below the 200-EMA. Price will need to vault the 200-EMA to avoid it. We will keep tabs on participation. When we get an actual heartbeat, I'll be presenting some Miners to DP Diamonds subscribers.
CRUDE OIL (USO)
IT Trend Model: BUY as of 11/23/2020
LT Trend Model: BUY as of 3/9/2021
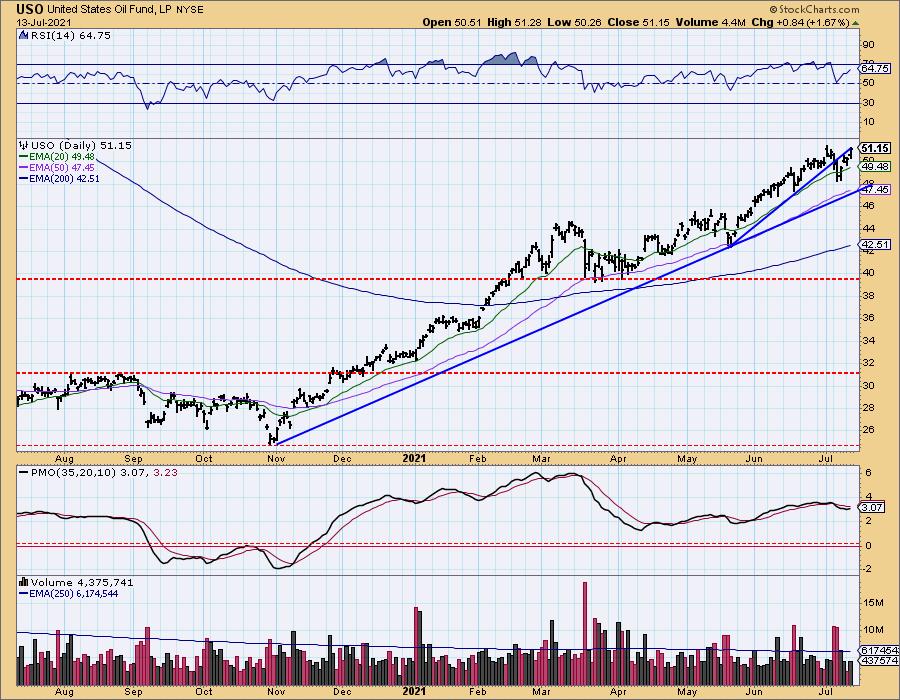
USO Daily Chart: USO is attempting to recapture its previous rising trend. The RSI is positive but the PMO isn't behind the rally yet.
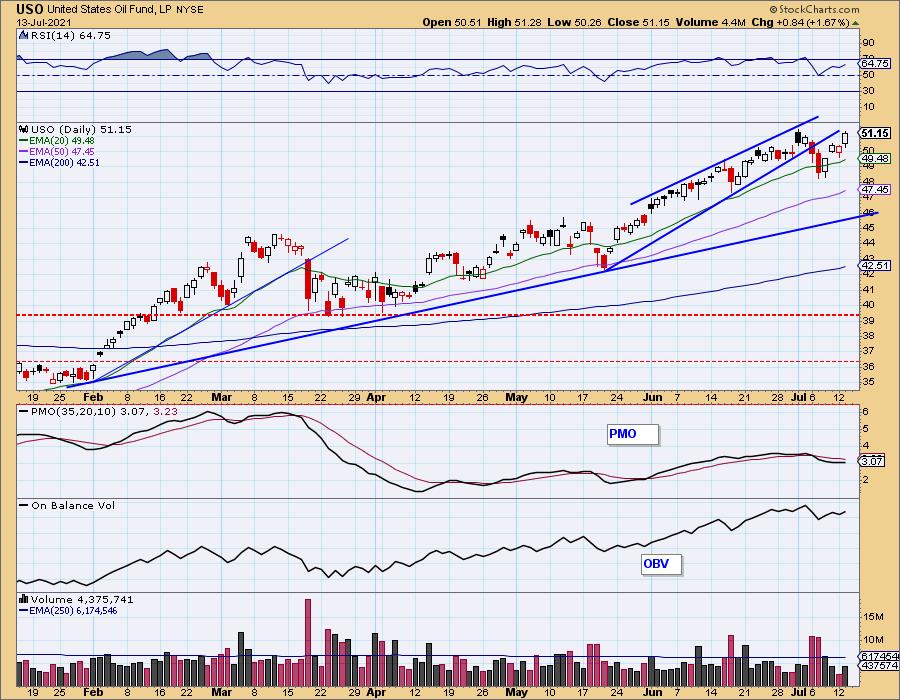
Big picture, USO is just fine as the pullback last week didn't even test the longer-term rising trend. We expect a breakout.
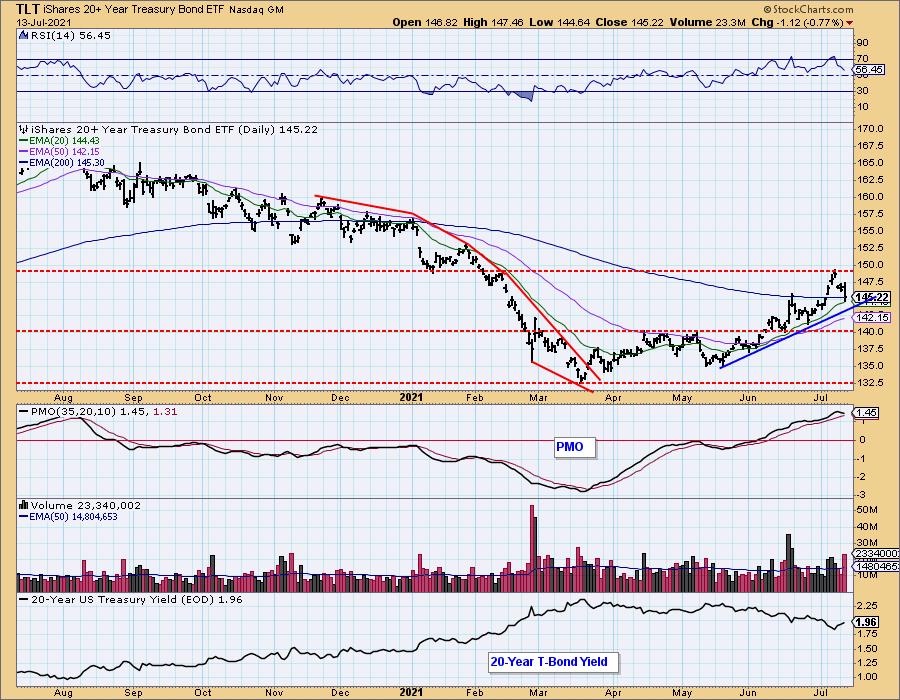
BONDS (TLT)
IT Trend Model: BUY as of 6/10/2021
LT Trend Model: SELL as of 1/8/2021
TLT Daily Chart: With yields coming back to life, the pressure has been on for TLT. Price is now testing the 20-EMA. The RSI is still positive and the PMO hasn't sustained much damage considering the steep pullback.
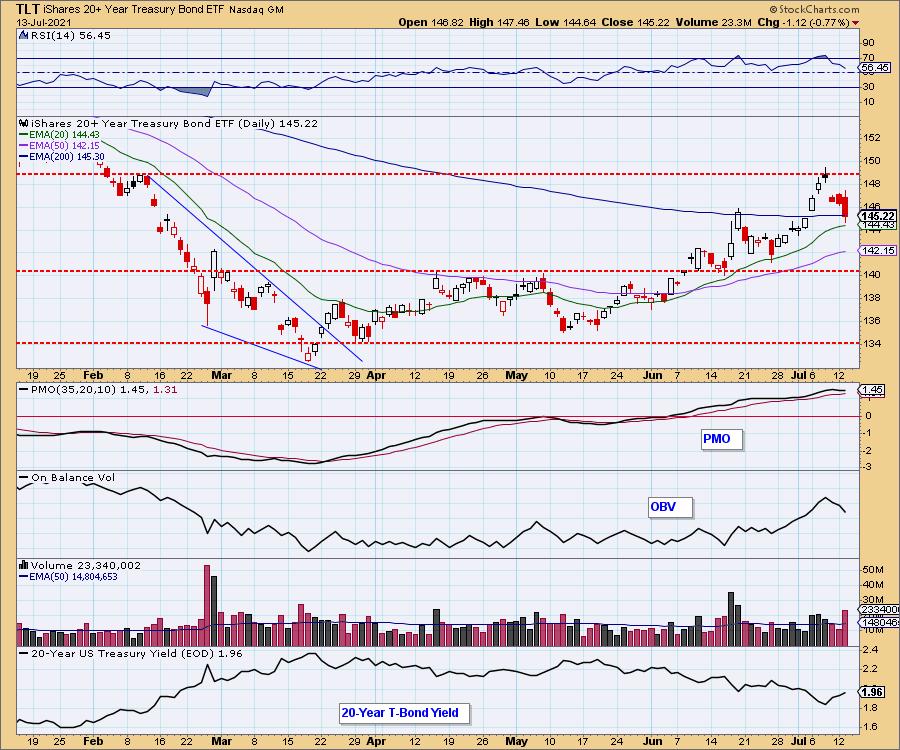
Currently the rising bottoms trendline is still intact. If that trend is lost, look for a test all the way back down to $140.
Technical Analysis is a windsock, not a crystal ball.
--Erin Swenlin
(c) Copyright 2021 DecisionPoint.com
Disclaimer: This blog is for educational purposes only and should not be construed as financial advice. The ideas and strategies should never be used without first assessing your own personal and financial situation, or without consulting a financial professional. Any opinions expressed herein are solely those of the author, and do not in any way represent the views or opinions of any other person or entity.
NOTE: The signal status reported herein is based upon mechanical trading model signals, specifically, the DecisionPoint Trend Model. They define the implied bias of the price index based upon moving average relationships, but they do not necessarily call for a specific action. They are information flags that should prompt chart review. Further, they do not call for continuous buying or selling during the life of the signal. For example, a BUY signal will probably (but not necessarily) return the best results if action is taken soon after the signal is generated. Additional opportunities for buying may be found as price zigzags higher, but the trader must look for optimum entry points. Conversely, exit points to preserve gains (or minimize losses) may be evident before the model mechanically closes the signal.
Helpful DecisionPoint Links:
DecisionPoint Alert Chart List
DecisionPoint Golden Cross/Silver Cross Index Chart List
DecisionPoint Sector Chart List
Price Momentum Oscillator (PMO)
Swenlin Trading Oscillators (STO-B and STO-V)
DecisionPoint is not a registered investment advisor. Investment and trading decisions are solely your responsibility. DecisionPoint newsletters, blogs or website materials should NOT be interpreted as a recommendation or solicitation to buy or sell any security or to take any specific action.