
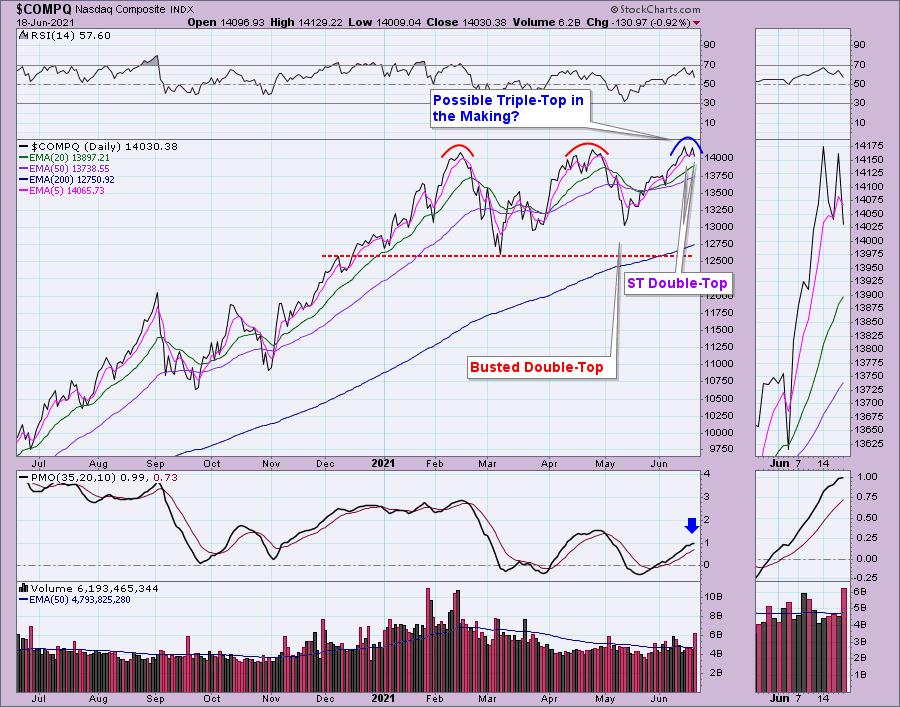
A viewer recently noted that we could be seeing a triple-top developing on the Nasdaq. It's a bit early to call that, but we can call the short-term double-top and it has triggered (see thumbnail). The minimum downside target of the double-top would take price toward support at the late May top. If selling begins on the Nasdaq, it will begin in earnest. If Technology begins to falter the broad markets will likely decline even faster than they already are.
Originally there was a large double-top pattern, but it busted when price bottomed before reaching the confirmation line. However, this does open up the possibility of a triple-top. The PMO flattened, also suggesting a possible decline next week.
The DecisionPoint Alert Weekly Wrap presents an end-of-week assessment of the trend and condition of the Stock Market, the U.S. Dollar, Gold, Crude Oil, and Bonds. The DecisionPoint Alert daily report (Monday through Thursday) is abbreviated and gives updates on the Weekly Wrap assessments.
Watch the latest episode of DecisionPoint on StockCharts TV's YouTube channel here!
MAJOR MARKET INDEXES
For Friday: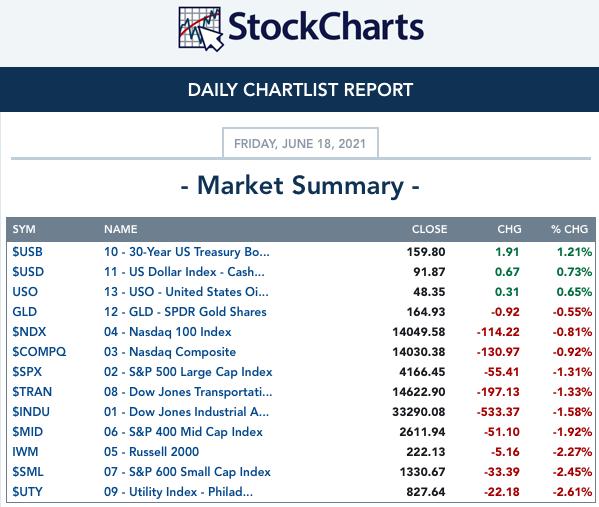
For the week: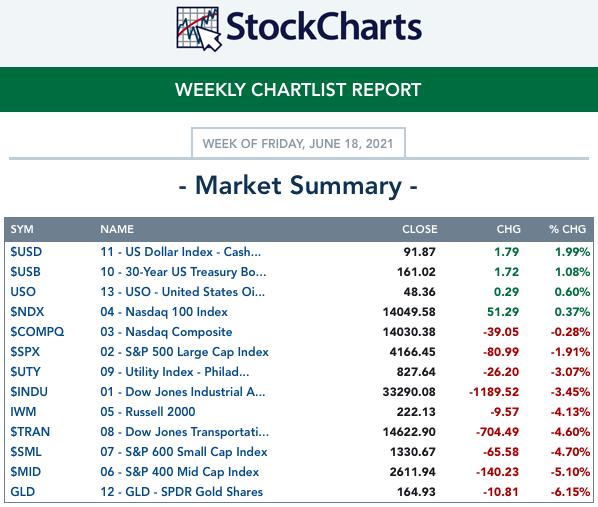
SECTORS
Each S&P 500 Index component stock is assigned to one, and only one, of 11 major sectors. This is a snapshot of the Intermediate-Term (Silver Cross) and Long-Term (Golden Cross) Trend Model signal status for those sectors.
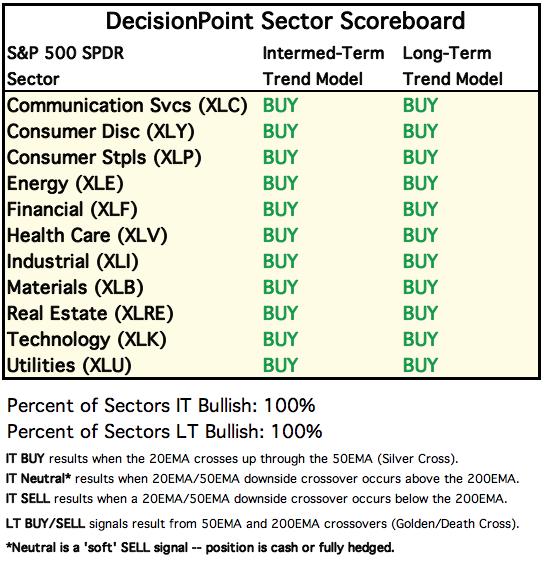
For Today: 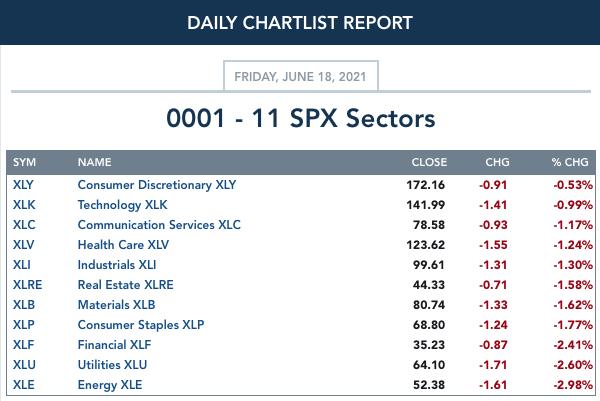
For the Week: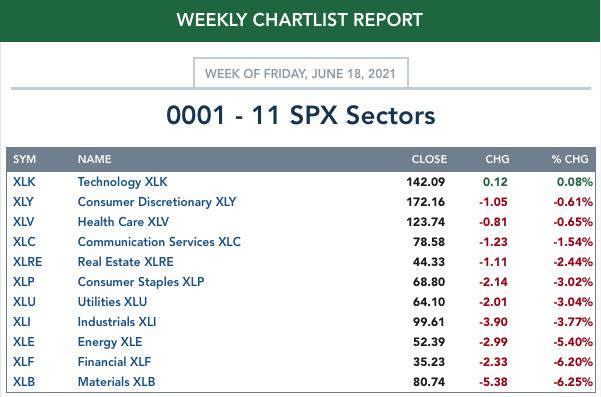
CLICK HERE for Carl's annotated Sector charts.
THE MARKET (S&P 500)
IT Trend Model: BUY as of 5/8/2020
LT Trend Model: BUY as of 6/8/2020
SPY Daily Chart: We always expect low volatility toward the end of options expiration week, and in spite of the selling, the SPY market decline from the Tuesday high was -2.4%. That's hardly high volatility. We also expect extra high volume on the last day of trading, which, of course we got. It is important to understand that the high volume should not be attributed to a selling exhaustion. There was selling exhaustion today, but the high option expiration volume is not evidence of such.
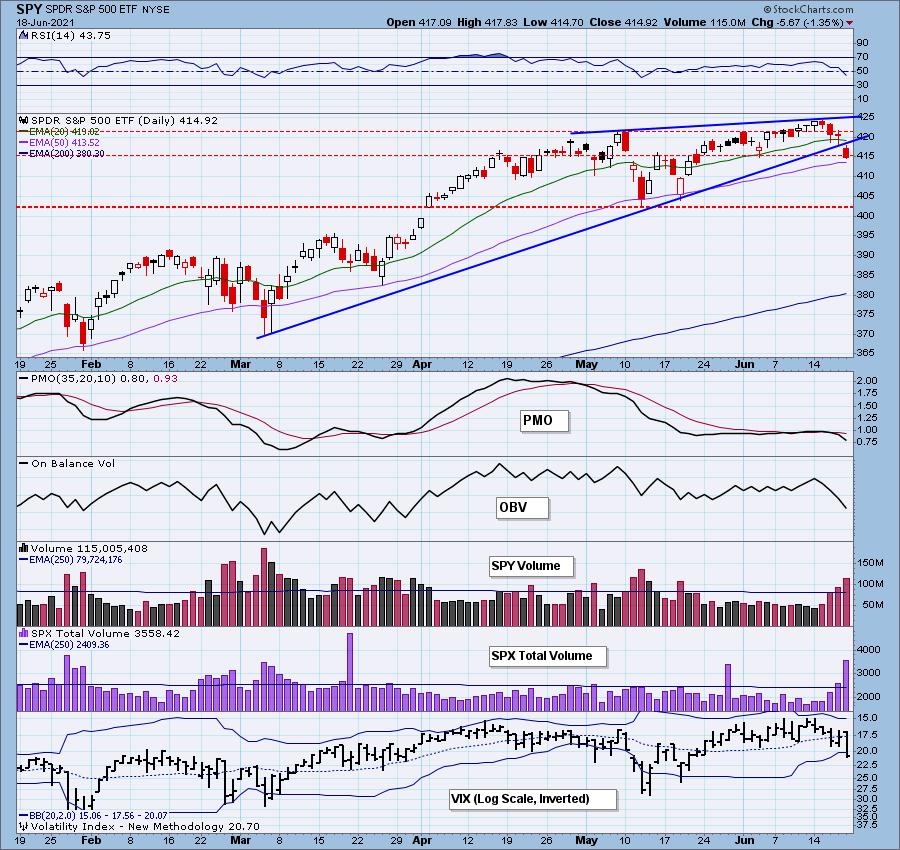
Price is now challenging the 50-EMA. The intermediate-term rising trend is now in serious jeopardy. You can also see the rising wedge that is drawn from late April top. The PMO is pointed downward.
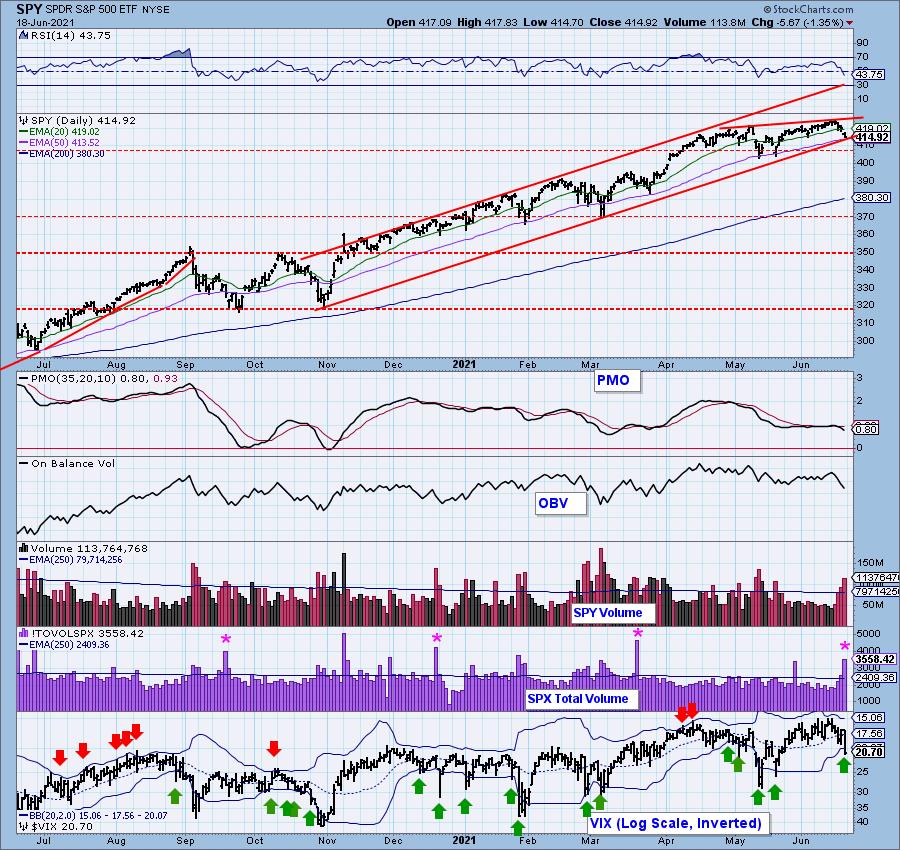
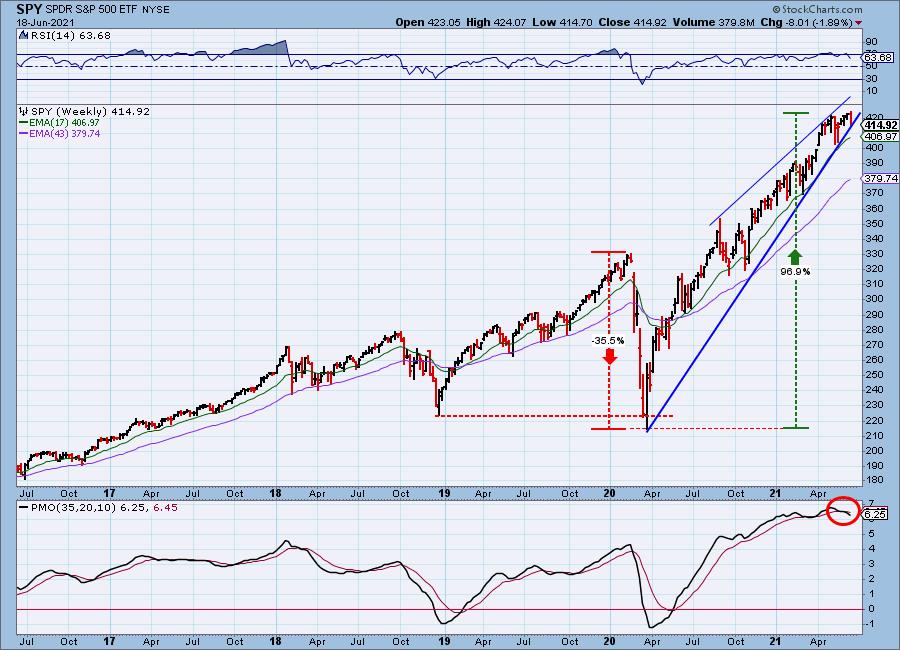
SPY Weekly Chart: The long-term rising trend was nearly broken this week. The weekly RSI is somewhat overbought, but most concerning is the PMO crossover SELL signal that triggered last Friday.
PARTICIPATION: The following chart uses different methodologies for objectively showing the depth and trend of participation for intermediate- and long-term time frames.
- The Silver Cross Index (SCI) shows the percentage of SPX stocks on IT Trend Model BUY signals (20-EMA > 50-EMA).
- The Golden Cross Index (GCI) shows the percentage of SPX stocks on LT Trend Model BUY signals (50-EMA > 200-EMA).
- The Bullish Percent Index (BPI) shows the percentage of SPX stocks on Point & Figure BUY signals.
All of these indicators continue to drop with price. The GCI remains highly overbought, but with 50-EMAs so far above 200-EMAs on most of the stocks in the SPX, it will take some time to see this indicator really drop. We do have a negative divergence on the GCI going into this decline which suggests the pullback is not over.
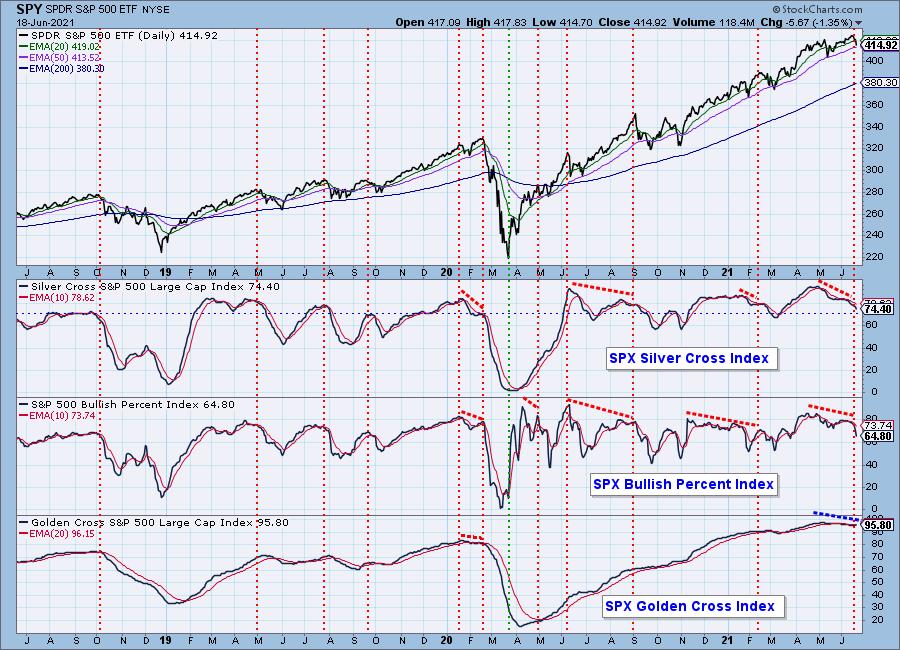
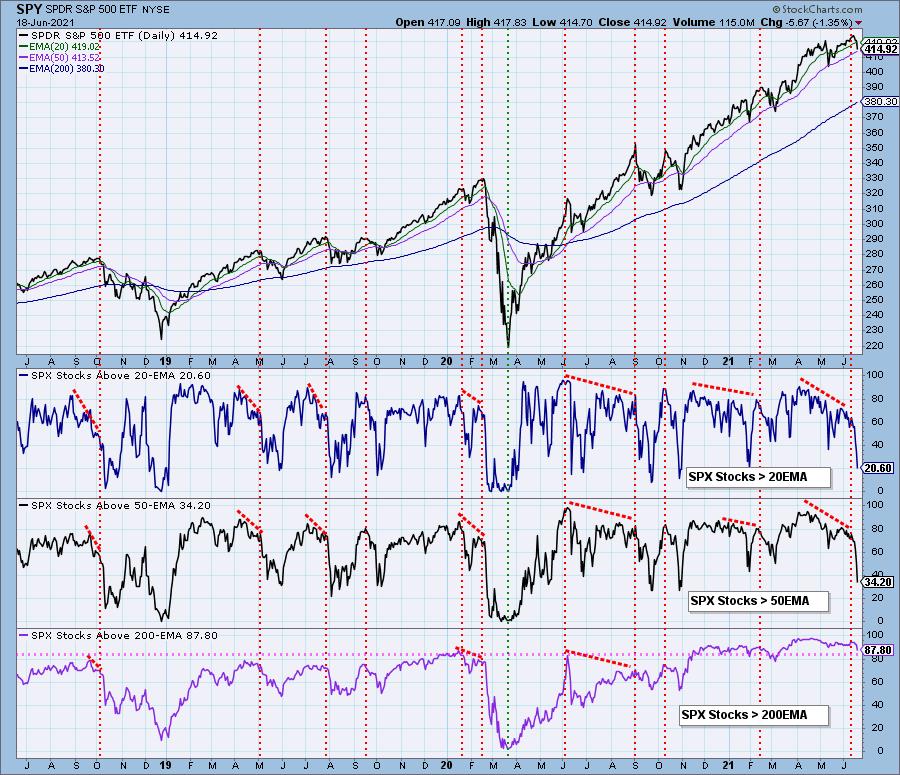
Participation is plummeting in the short and intermediate terms. These readings are oversold, but they don't appear ready to recharge. We're finally starting to see some deterioration in the long term as more stocks dropped below the 200-EMA this week.
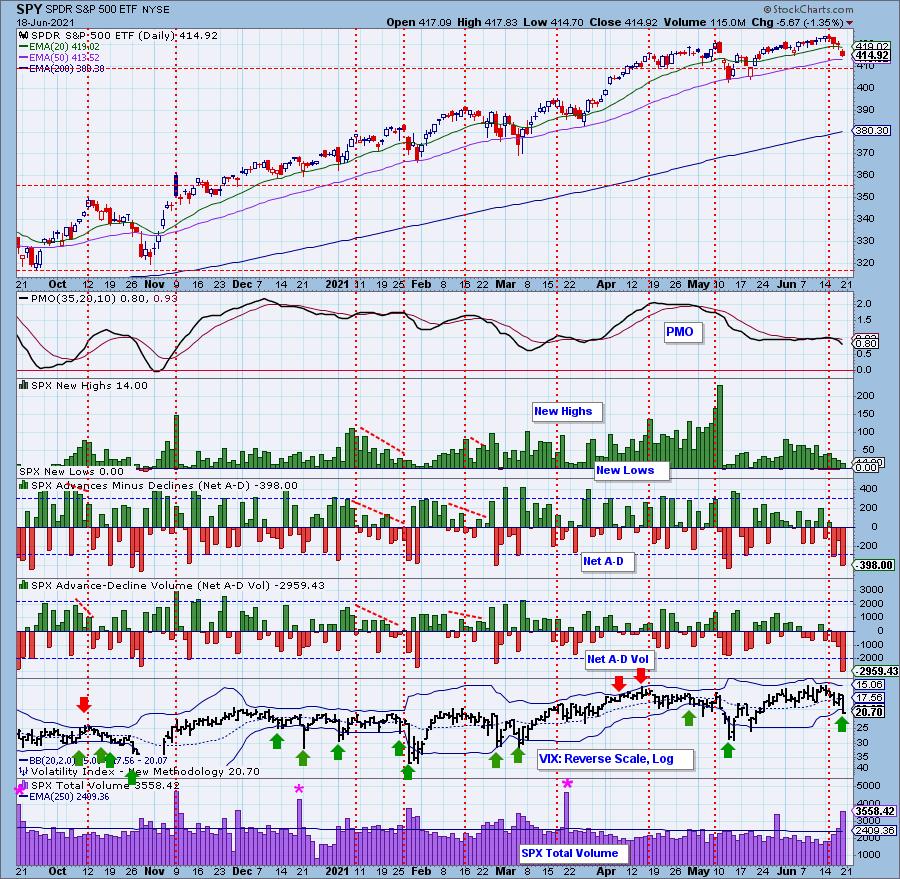
Climax Analysis: Today was a downside exhaustion climax, meaning we should look for a bounce on Monday. The VIX closed beneath the lower Bollinger Band on the inverted scale and that generally precedes a short-term bounce as well.
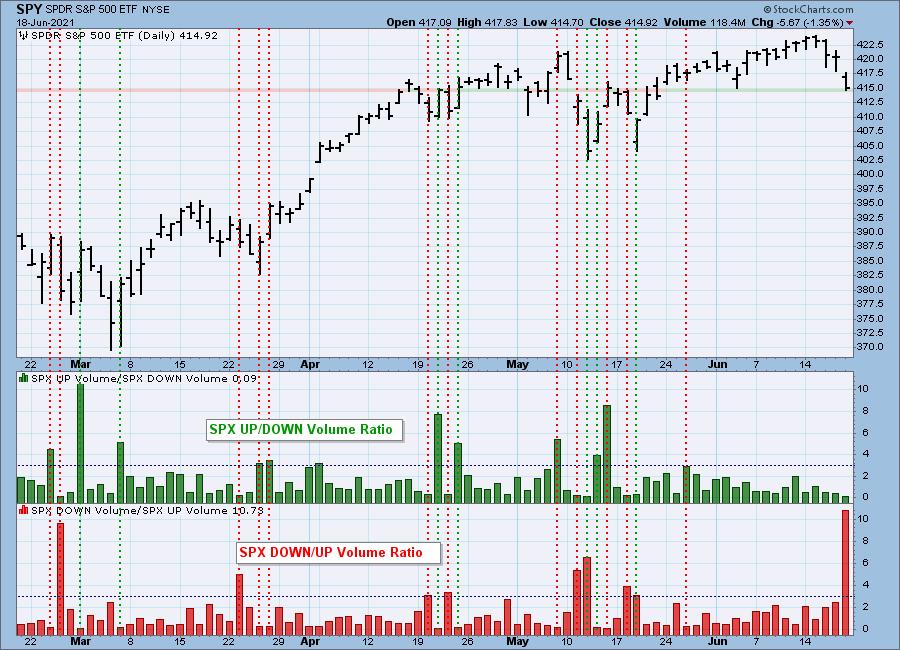
NYSE Up/Down and Down/Up volume ratios are also climax detectors. The 9:1 ratio suggested by the late Dr. Martin Zweig in his book, Winning on Wall Street, is especially significant, but we primarily look for spikes outside the normal range to clarify a particular event. We have an NYSE and S&P 500 version of the ratios, and normally they will only be published when there is a notable reading.
Volume ratios were clearly in agreement that today was a downside climax. Readings this high after a prolonged decline lead to higher prices in the very short term.
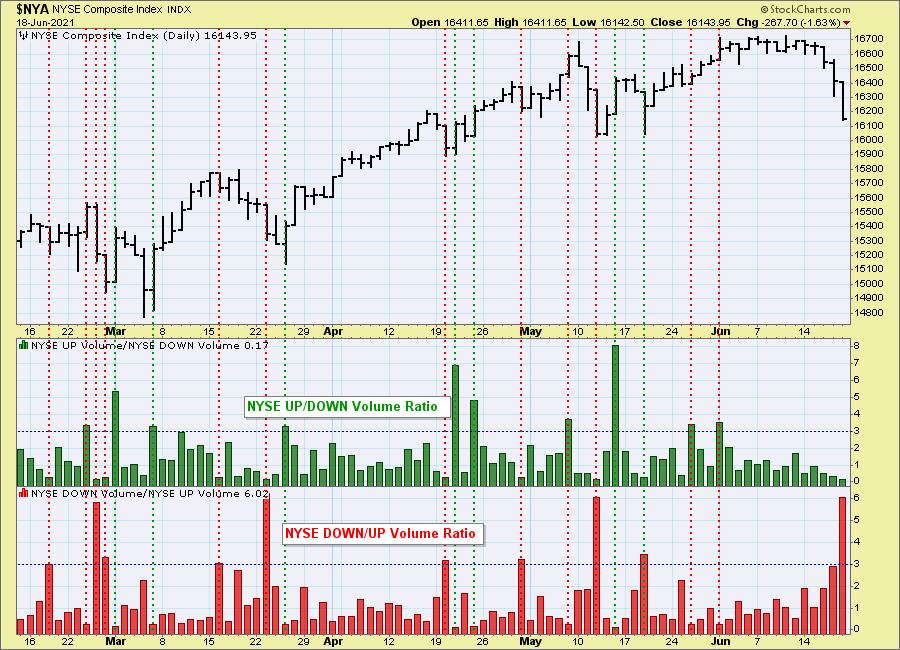
The S&P 500 version can get different results than the NYSE version because: (a) there are only 500 stocks versus a few thousand; and (b) those 500 stocks are all large-cap stocks that tend to move with more uniformity.
The ratio was even higher on the SPX. With price hitting support around 415, this is an ideal reversal point.
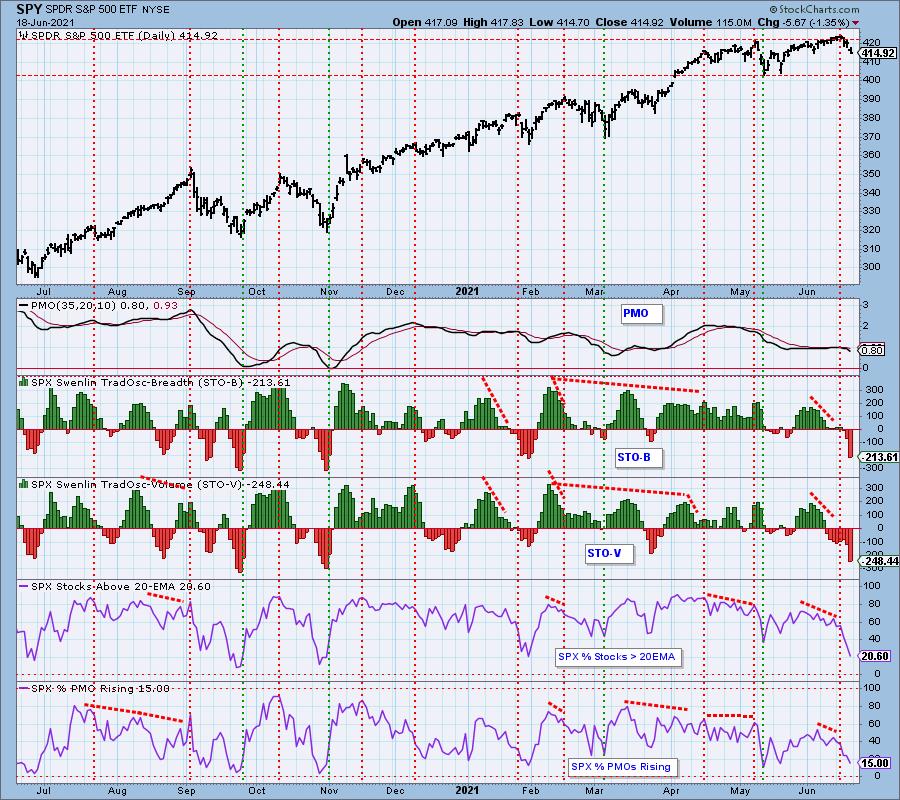
Short-Term Market Indicators: The short-term market trend is DOWN and the condition is OVERSOLD.
More evidence of a possible bounce on Monday is oversold STOs. Don't get too excited. Only 15% of SPX stocks have rising momentum, a bounce isn't likely to last.
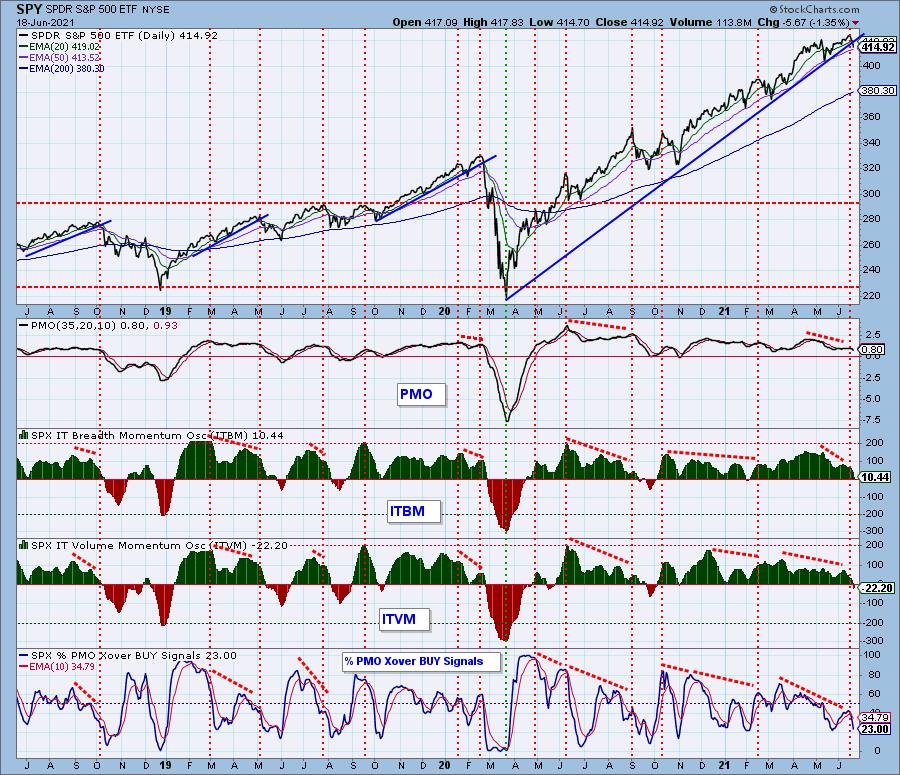
Intermediate-Term Market Indicators: The intermediate-term market trend is UP and the condition is NEUTRAL. The market bias is NEUTRAL.
%PMO BUY signals is somewhat oversold. The ITVM hit negative territory today. The ITBM/ITVM aren't oversold yet, but they are working on it. This is the reason we consider the market bias "Neutral" and not "Bearish" right now.
CONCLUSION: Volume was extremely high today, but we have to write that off to quadruple-witching options expiration. However, we still have downside exhaustion climax. Therefore we expect to see higher prices on Monday. While indicators are getting oversold, we don't believe a longer rally will ensue. Indicators aren't oversold enough. Consider any bounce next week to be a "dead cat" bounce. The cat will bounce, but it's dead, so gravity will win. Keep a defensive posture and consider the Healthcare sector (XLV) for possible holds.
Have you subscribed the DecisionPoint Diamonds yet? DP does the work for you by providing handpicked stocks/ETFs from exclusive DP scans! Add it with a discount! Contact support@decisionpoint.com for more information!
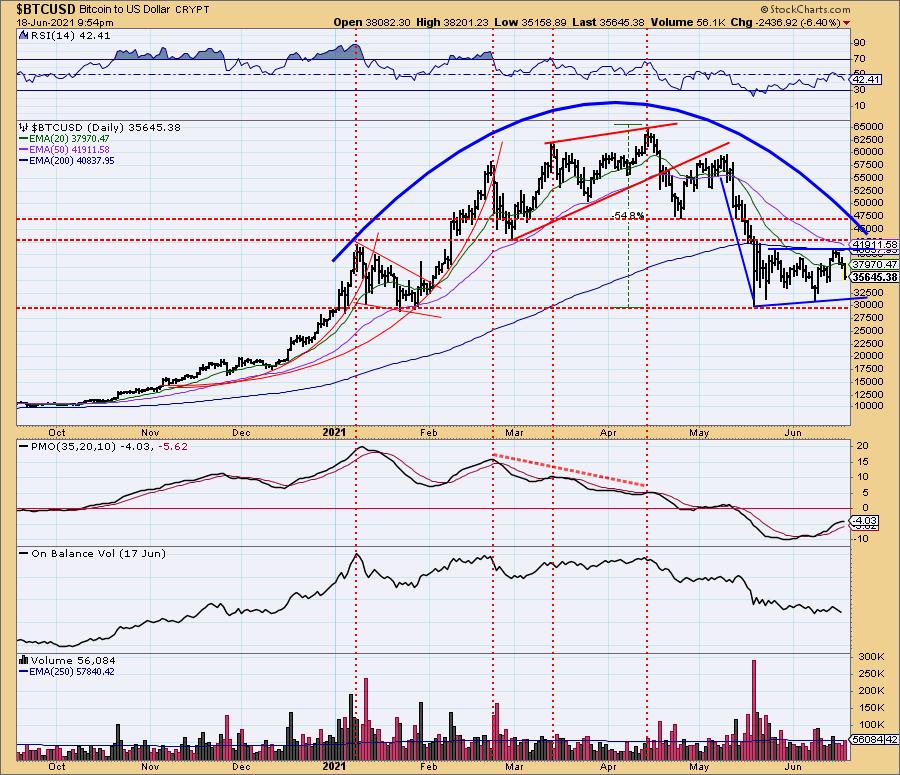
BITCOIN
Bitcoin hit overhead resistance this week and failed to overcome. Look for Bitcoin to hit 30,000 very soon. This is a bearish reverse flag within a large topping formation, so that support is somewhat fragile.
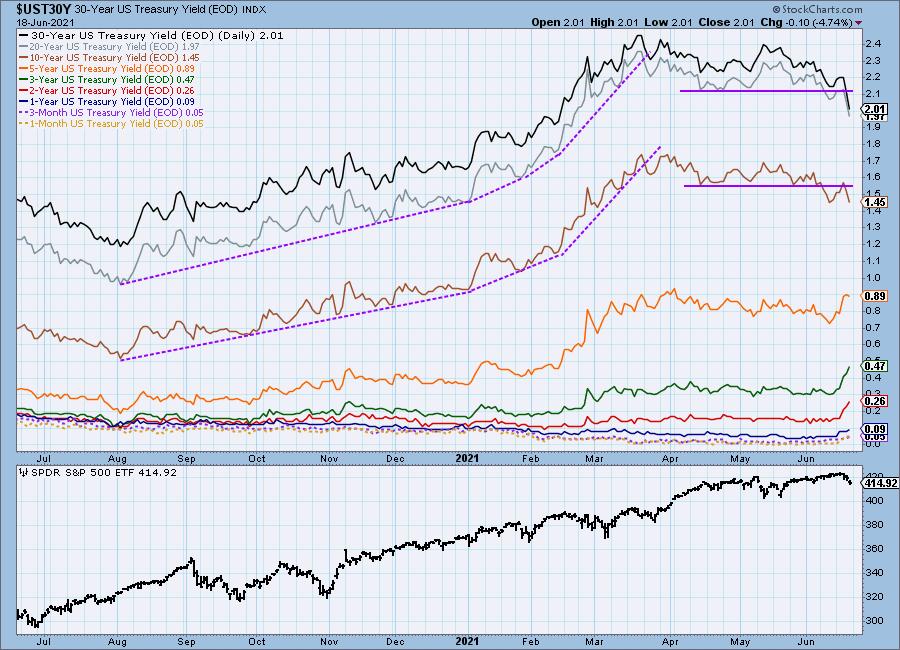
INTEREST RATES
Long-term yields bounced this week, but failed to recapture support at April lows. Shorter-term yields are continuing higher. Likely this dichotomy is due to inflation rising. Inflation erodes the real value of a bond's face value, which is a particular concern for longer maturity debts.
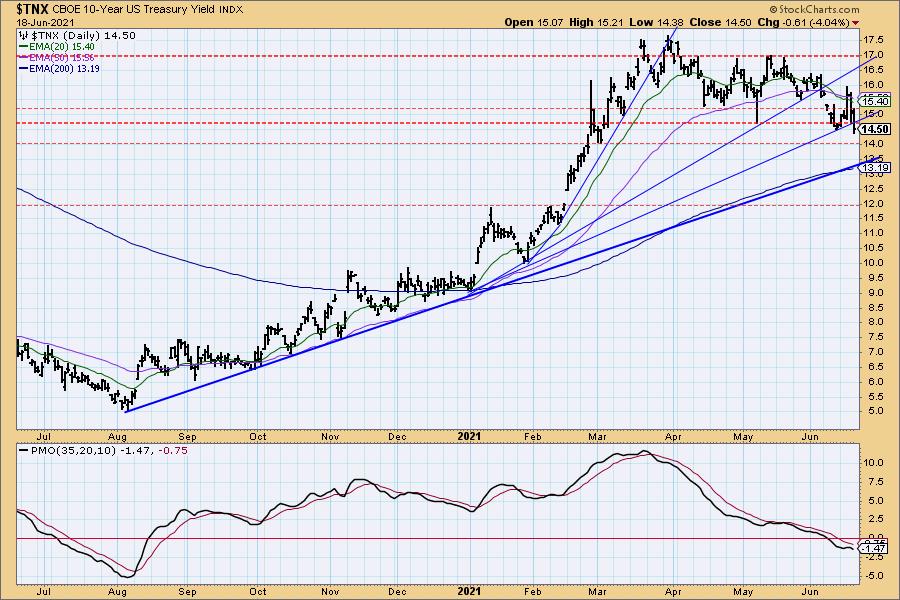
10-YEAR T-BOND YIELD
The rising trend from the December low has now been broken. Next support is at 14.0, but the likely stopping point will be closer to the 200-EMA at 13.2.
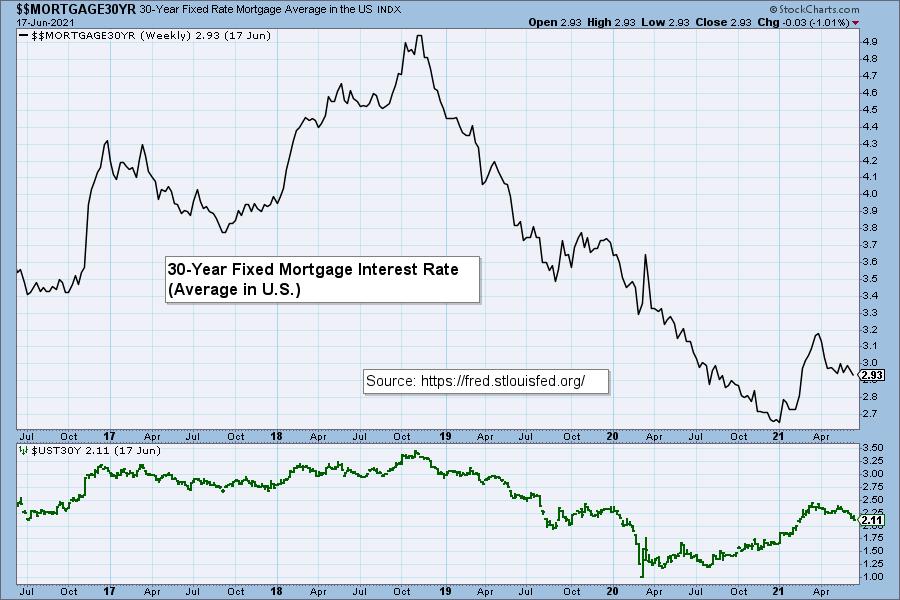
MORTGAGE INTEREST RATES (30-Yr)
We want to watch the 30-Year Fixed Mortgage Interest Rate, because, for the most part, people buy homes based upon the maximum monthly payment they can afford. As rates rise, a fixed monthly payment will carry a smaller mortgage amount. (See table.) As mortgages are forced to shrink, real estate prices will have to fall, and many sellers will increasingly find that they are upside down with their mortgage.
The pressure of this issue at present is scant.

DOLLAR (UUP)
IT Trend Model: SELL as of 4/26/2021
LT Trend Model: SELL as of 7/10/2020
UUP Daily Chart: The Dollar soared this week, starting with a breakaway gap yesterday and runaway gap today. UUP is now above its 200-EMA. The PMO has made it above the zero line. However, the RSI is overbought, so possible consolidation above the 200-EMA seems likely to digest this vertical rally.
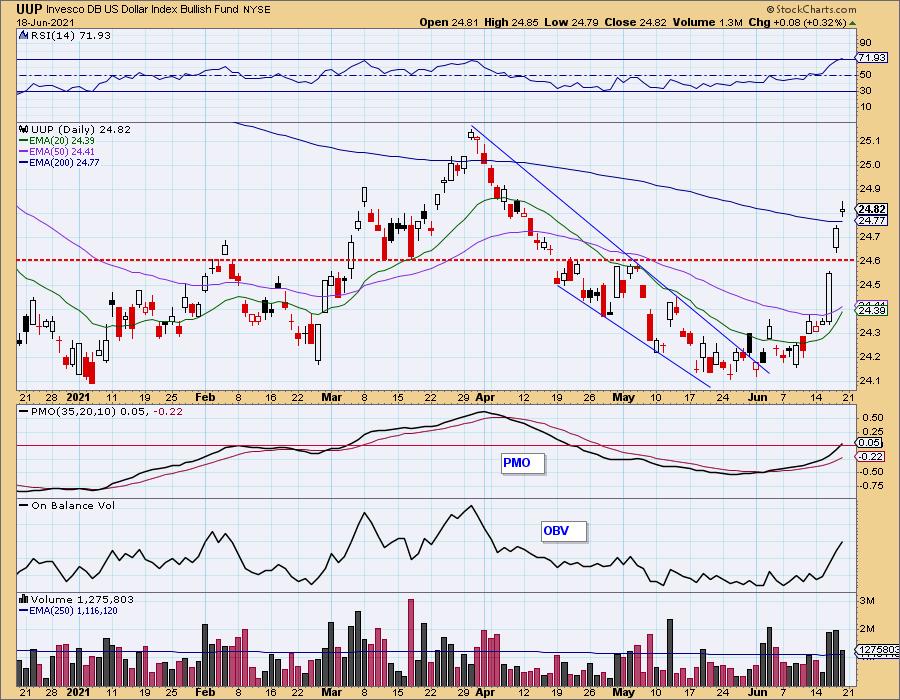
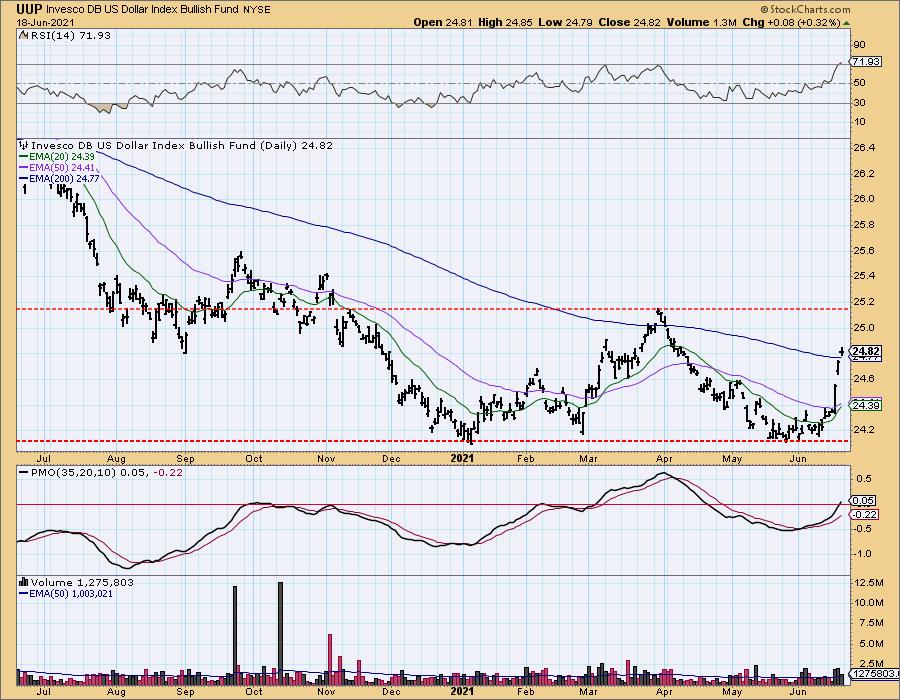
Overhead resistance doesn't really arrive until price hits the confirmation line of the large double-bottom, close to $25.20.
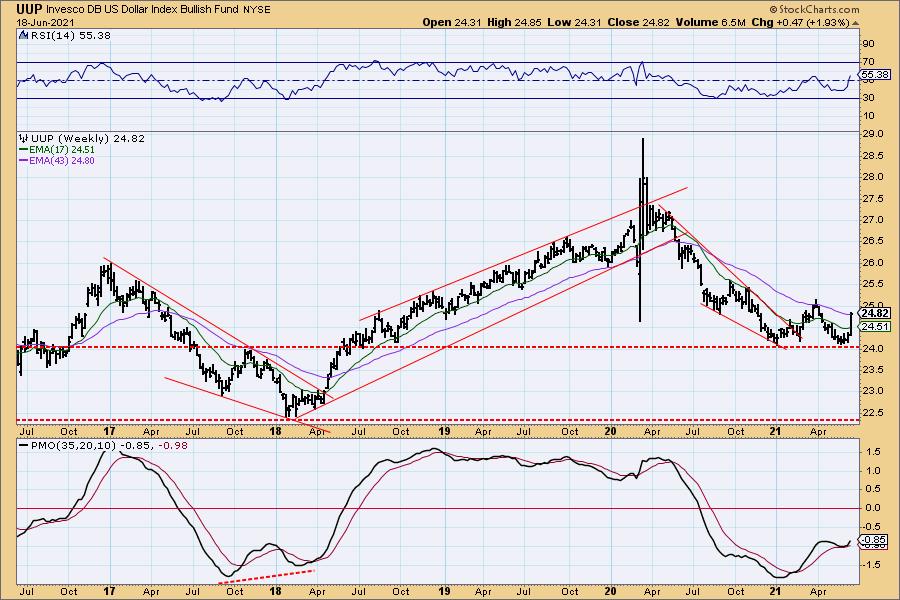
UUP Weekly Chart: The double-bottom on the weekly chart is very encouraging. Additionally, price did close above the 43-week EMA. The weekly PMO which had nearly triggered a SELL signal two weeks ago, has bottomed above its signal line which is especially bullish in the intermediate term.
GOLD
IT Trend Model: BUY as of 5/3/2021
LT Trend Model: BUYas of 5/21/2021
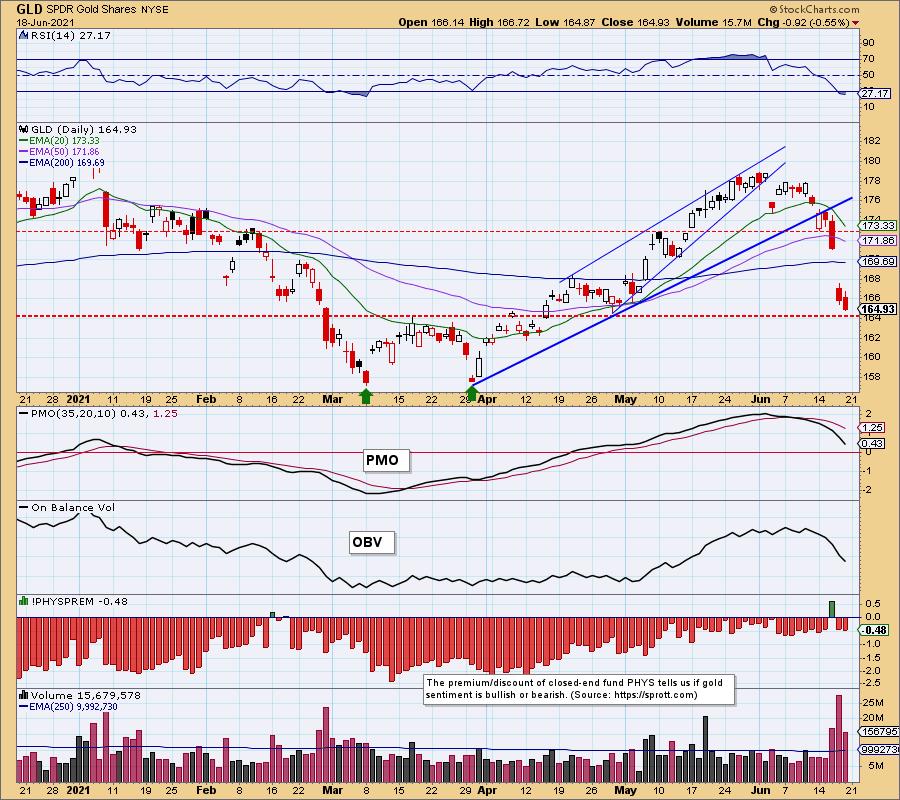
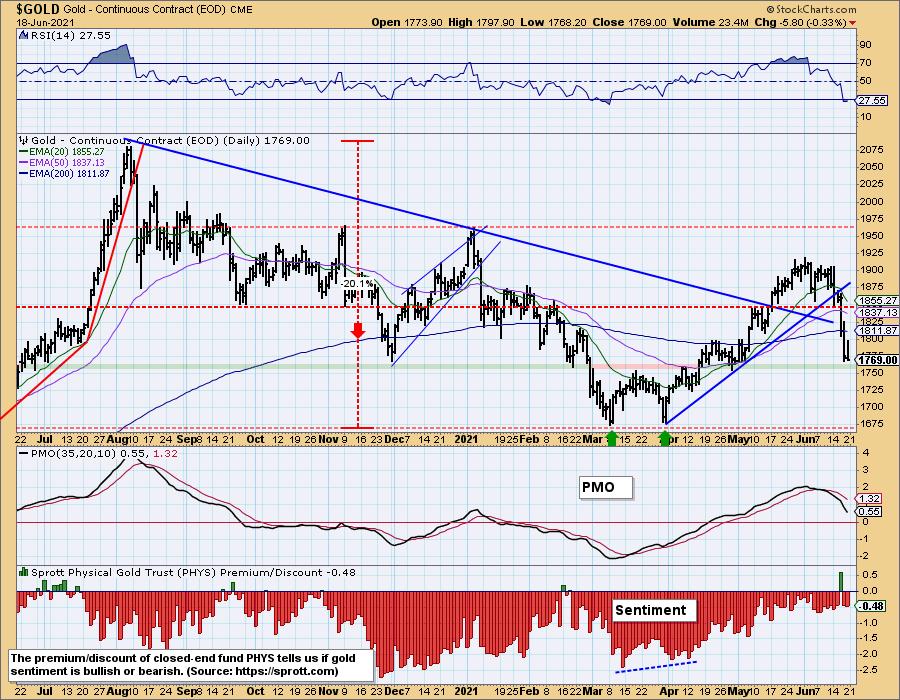
GOLD Daily Chart: Gold plummeted this week as the Dollar soared. The good news for Gold is that it is sitting on support at the March top. Additionally, the RSI is oversold. Working against Gold are the very negative PMO and low discounts. We want discounts to increase. The higher the discount, the more bearish gold buyers are. Sentiment is contrarian, so that would be bullish for Gold.
On the one year chart we see that support also aligns with the November low. The support line is thick so as to catch other bottoms and tops. This is strong support and could hold up.
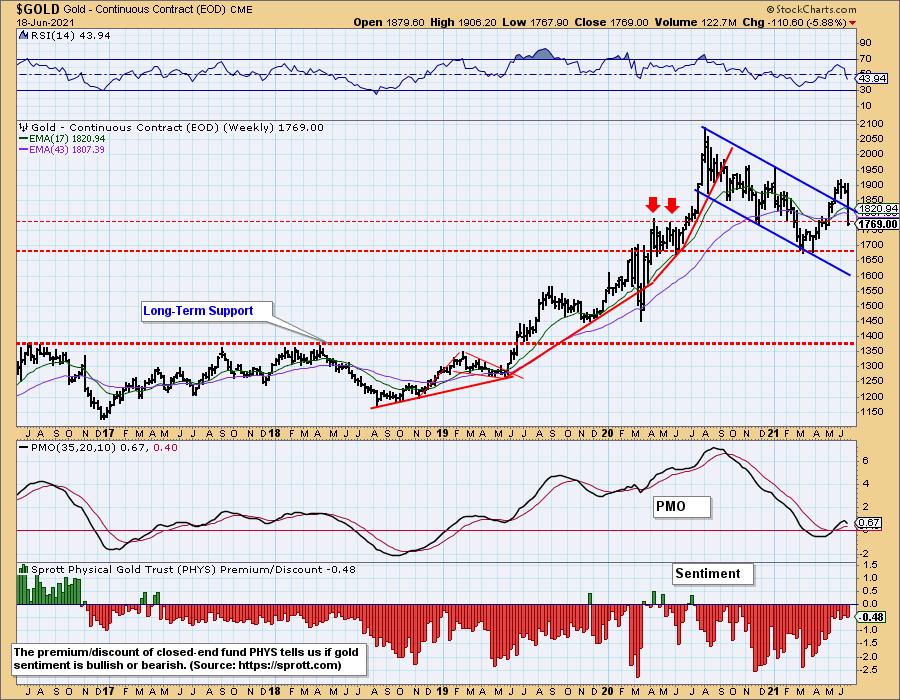
GOLD Weekly Chart: However, when we look at the weekly chart, support lands a bit higher, matching with the April/May 2020 tops. Should this level not hold, next stop is likely $1700 for Gold. Given the RSI is now negative and the weekly PMO has topped, there is a high likelihood that Gold prices will retreat to $1700.
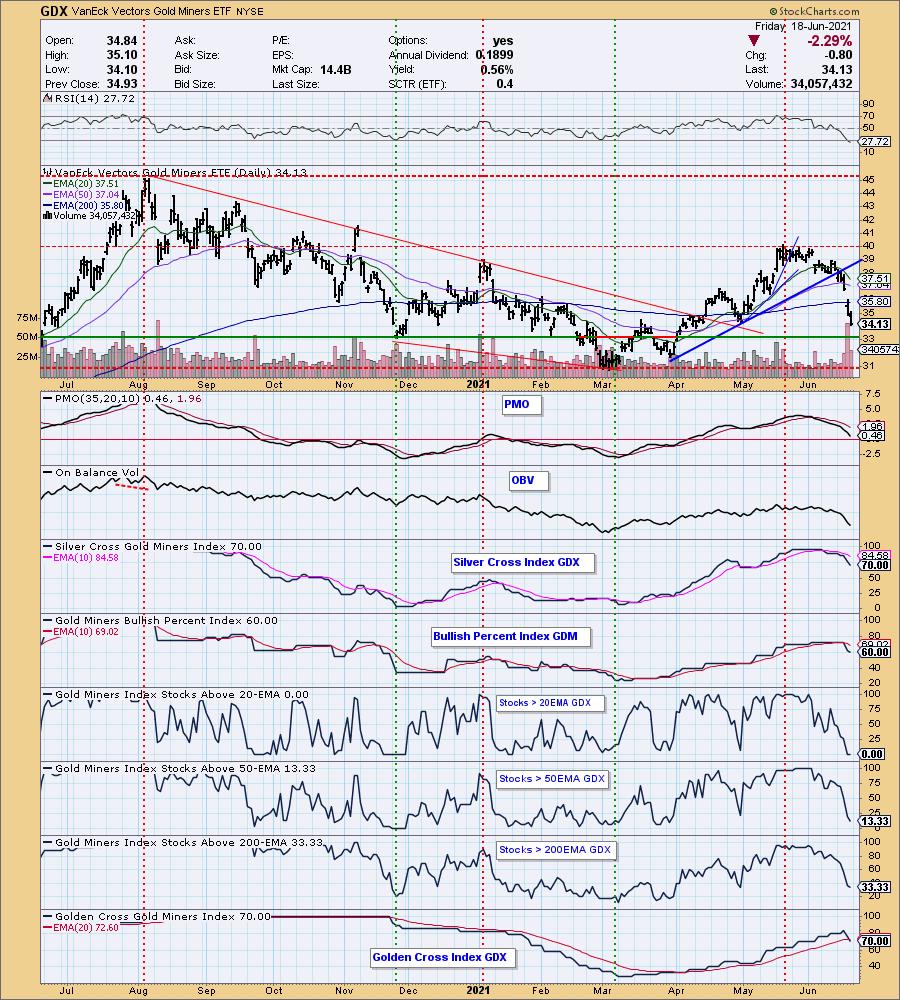
GOLD MINERS Golden and Silver Cross Indexes: With Gold prices dropping, Gold Miners took it on the chin this week. GDX was down a whopping -10.84% this week! Right now, not one of the Gold Miners have price above the 20-EMA and only 13% have price above the 50-EMA. There is a negative crossover on the GCI. The PMO and SCI were already in decline. Participation is oversold, but the PMO, SCI, BPI and GCI are neutral. Support may be arriving, so we will watch for a possible reversal. More than likely, it will move down to the March/April lows.
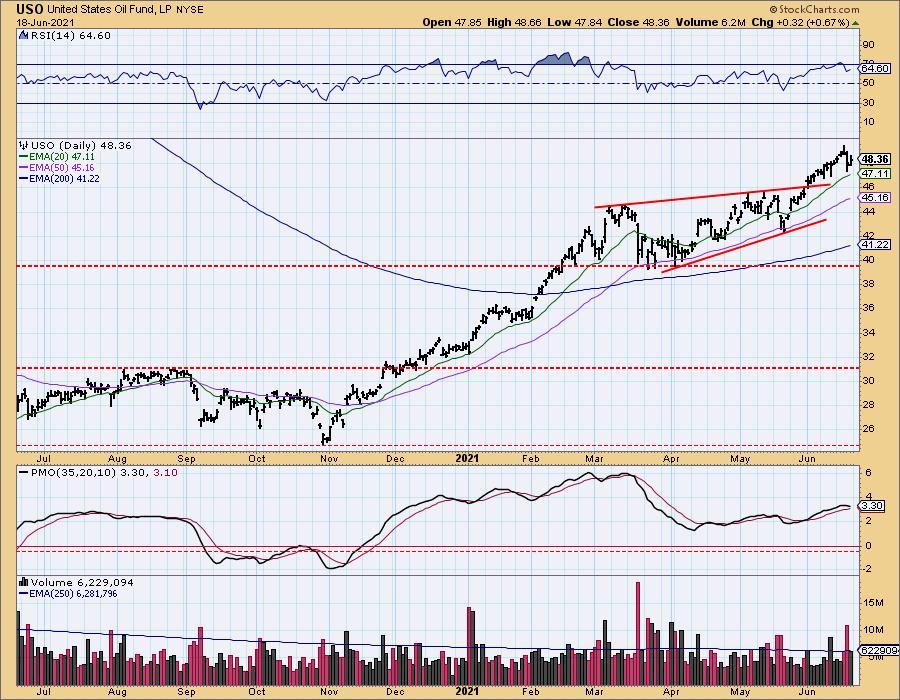
CRUDE OIL (USO)
IT Trend Model: BUY as of 11/23/2020
LT Trend Model: BUY as of 3/9/2021
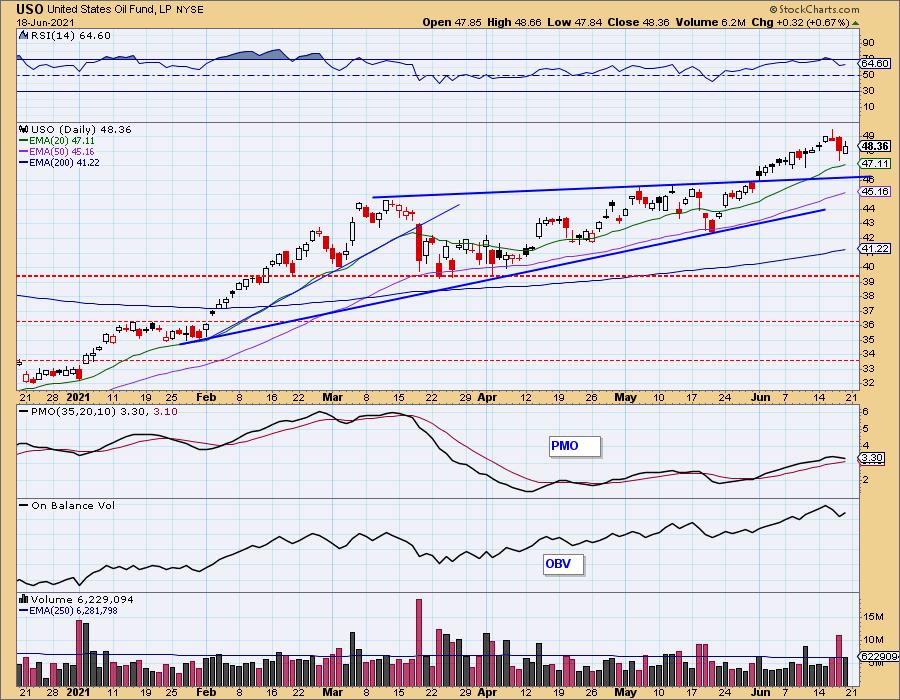
USO Daily Chart: Crude Oil pulled back slightly at the end of the week, but we didn't see much damage done. Price is well above the 20-EMA and the RSI is positive. The PMO turned over, but not ferociously and there are still rising bottoms on the OBV.
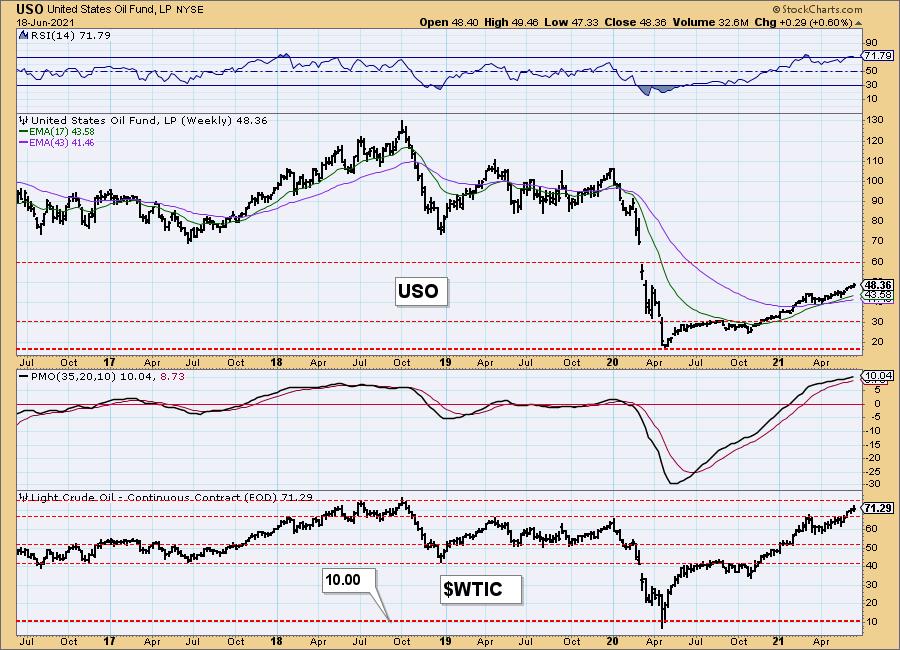
USO/$WTIC Weekly Chart: With $WTIC nearing overhead resistance and the weekly RSI is overbought, we could see USO flounder. However, with the rising weekly PMO, we wouldn't expect much damage.
BONDS (TLT)
IT Trend Model: BUY as of 6/10/2021
LT Trend Model: SELL as of 1/8/2021
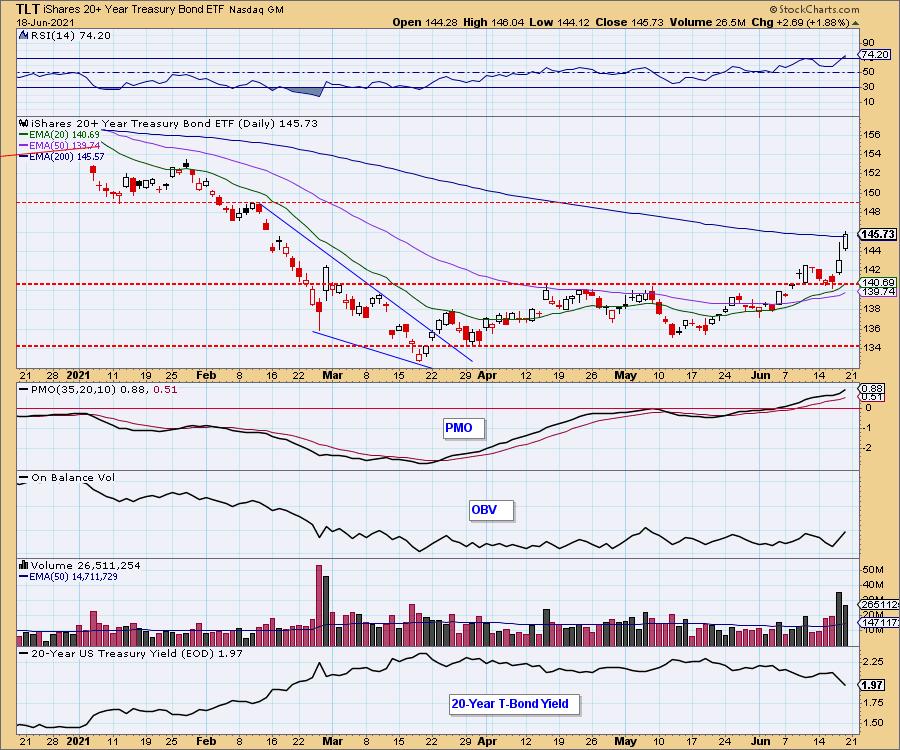
TLT Daily Chart: Falling long-term yields has pushed TLT above its 200-EMA. The PMO is rising strongly. The only negative is the overbought RSI. Overhead resistance is arriving at $149.
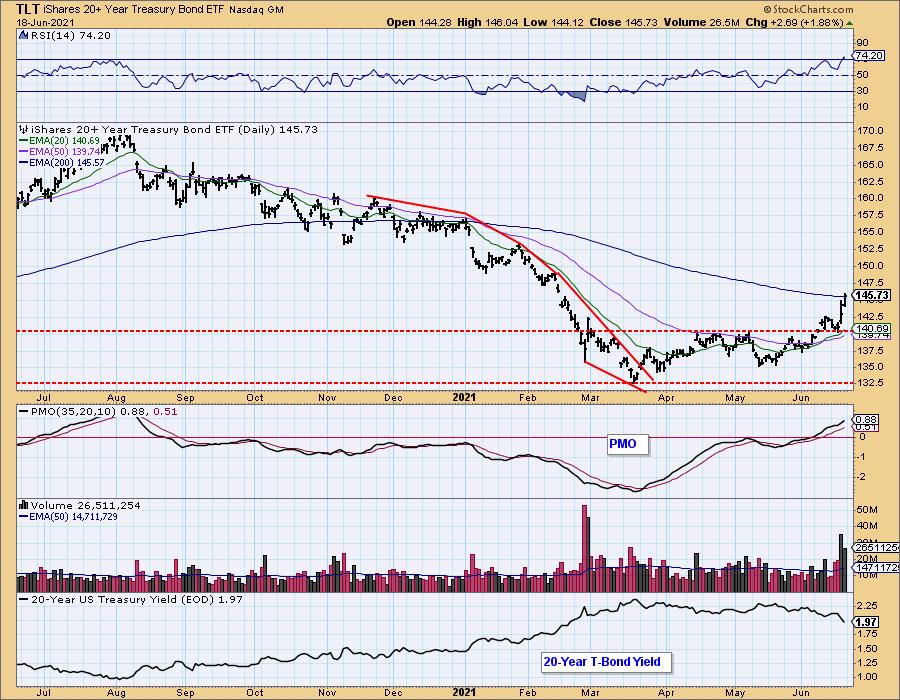
On the 1-year bar chart, we can see that the PMO isn't as overbought as it looks on the 6-month candlestick chart.
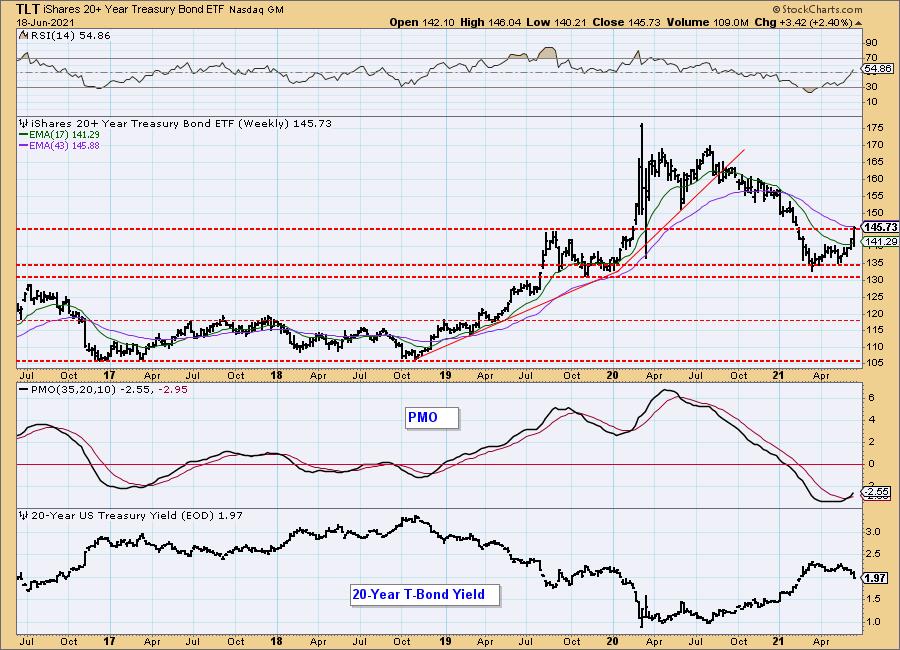
TLT Weekly Chart: The double-bottom resolved upward and has reached its minimum upside target. Given the newly positive weekly RSI and weekly PMO crossover BUY signal, we expect bonds to keep moving higher.
Technical Analysis is a windsock, not a crystal ball.
-- Carl & Erin Swenlin
Disclaimer: This blog is for educational purposes only and should not be construed as financial advice. The ideas and strategies should never be used without first assessing your own personal and financial situation, or without consulting a financial professional. Any opinions expressed herein are solely those of the author, and do not in any way represent the views or opinions of any other person or entity.
NOTE: The signal status reported herein is based upon mechanical trading model signals, specifically, the DecisionPoint Trend Model. They define the implied bias of the price index based upon moving average relationships, but they do not necessarily call for a specific action. They are information flags that should prompt chart review. Further, they do not call for continuous buying or selling during the life of the signal. For example, a BUY signal will probably (but not necessarily) return the best results if action is taken soon after the signal is generated. Additional opportunities for buying may be found as price zigzags higher, but the trader must look for optimum entry points. Conversely, exit points to preserve gains (or minimize losses) may be evident before the model mechanically closes the signal.
Helpful DecisionPoint Links:
DecisionPoint Alert Chart List
DecisionPoint Golden Cross/Silver Cross Index Chart List
DecisionPoint Sector Chart List
Price Momentum Oscillator (PMO)
Swenlin Trading Oscillators (STO-B and STO-V)
DecisionPoint is not a registered investment advisor. Investment and trading decisions are solely your responsibility. DecisionPoint newsletters, blogs or website materials should NOT be interpreted as a recommendation or solicitation to buy or sell any security or to take any specific action.
