
The Weekly Wrap from Friday gave the 'heads up' that we had a possible downside exhaustion climax. This means that readings on our climactic indicators spiked lower on the selling, creating a selling exhaustion. It played out as expected with today's forceful buying. This appears to be a buying initiation, meaning higher prices tomorrow and possibly into the end of the week.
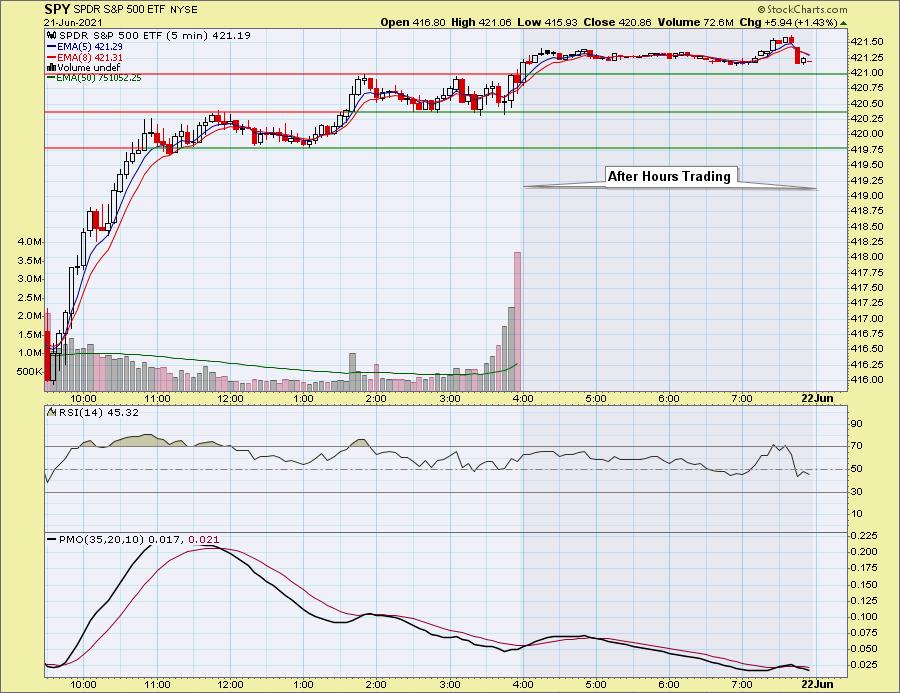
Below is the 5-minute candlestick chart with after hours trading added. As soon as after hours trading began, the SPY broke out. Price is staying above today's highs. The 5-minute PMO began to turn up and had a positive crossover going into after hours trading which also bolsters the buying initiation thesis.
** UPCOMING VACATION - June 28th to July 9th **
It's that time of year again! Last year it was a road trip to Alabama and back, this year it is a road trip to Utah and back! We plan on dropping in Las Vegas, Zion, Spanish Fork, Bryce Canyon, back to the Grand Canyon, Bull Head City and finally back home.
I plan on writing, but all trading rooms will be postponed until I return home. Blog articles may be delayed depending on WIFI service and/or our travel for the day.
DP Alert subscribers: The DP Alert will be published at varying times while I'm traveling, but I will try to keep as close to our regular schedule as possible. Rest assured, you will ALWAYS have the report prior to market open the next day.
The DecisionPoint Alert Weekly Wrap presents an end-of-week assessment of the trend and condition of the Stock Market, the U.S. Dollar, Gold, Crude Oil, and Bonds. The DecisionPoint Alert daily report (Monday through Thursday) is abbreviated and gives updates on the Weekly Wrap assessments.
Watch the latest episode of DecisionPoint on StockChartsTV.com and YouTube here!
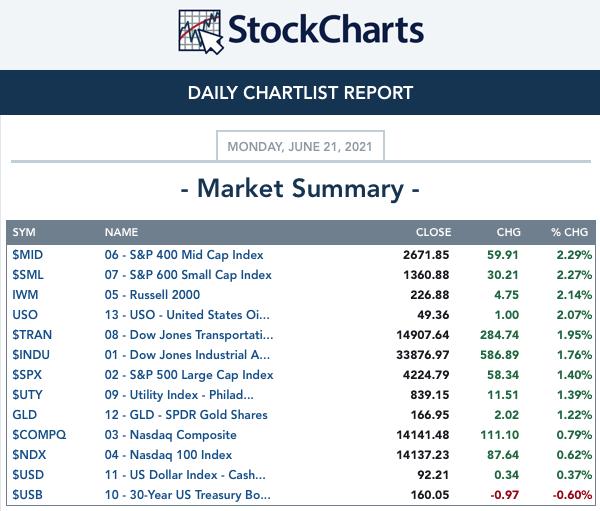
MAJOR MARKET INDEXES
SECTORS
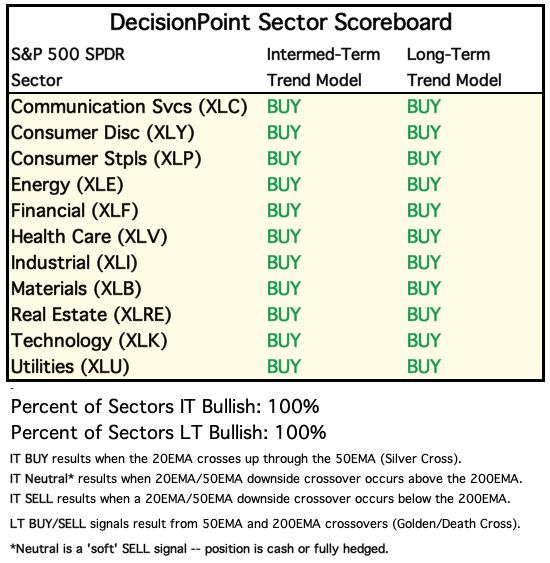
Each S&P 500 Index component stock is assigned to one, and only one, of 11 major sectors. This is a snapshot of the Intermediate-Term (Silver Cross) and Long-Term (Golden Cross) Trend Model signal status for those sectors.
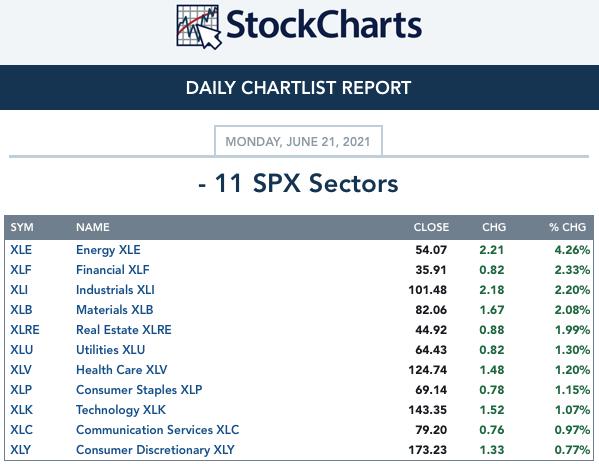
CLICK HERE for Carl's annotated Sector charts.
THE MARKET (S&P 500)
IT Trend Model: BUY as of 5/8/2020
LT Trend Model: BUY as of 6/8/2020
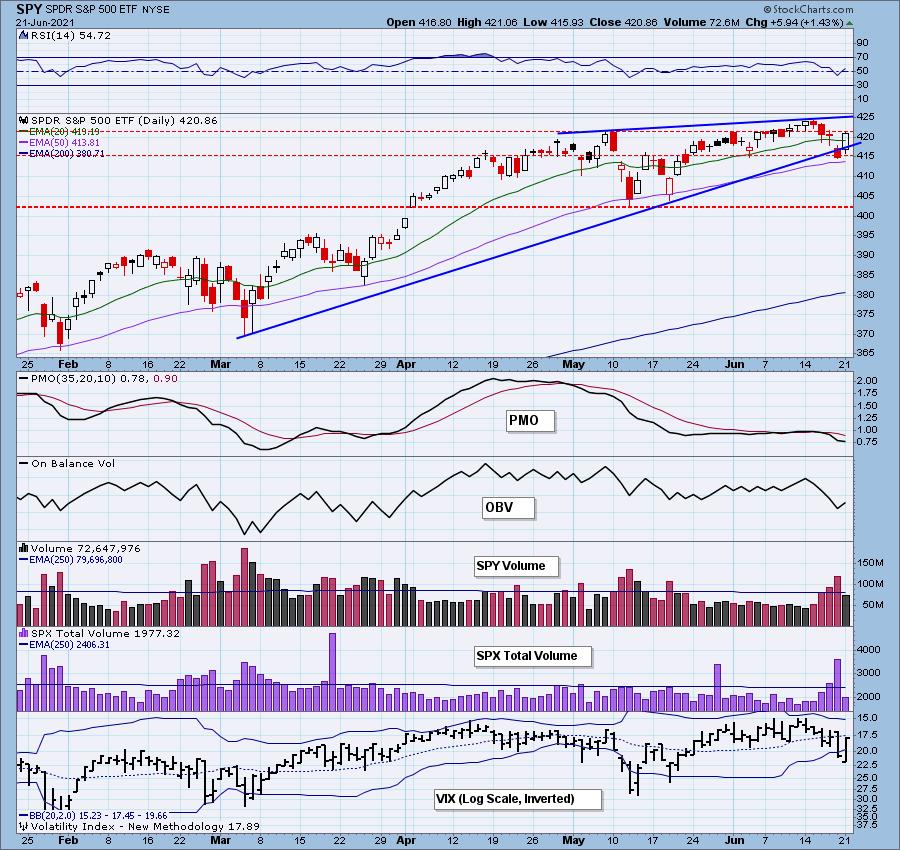
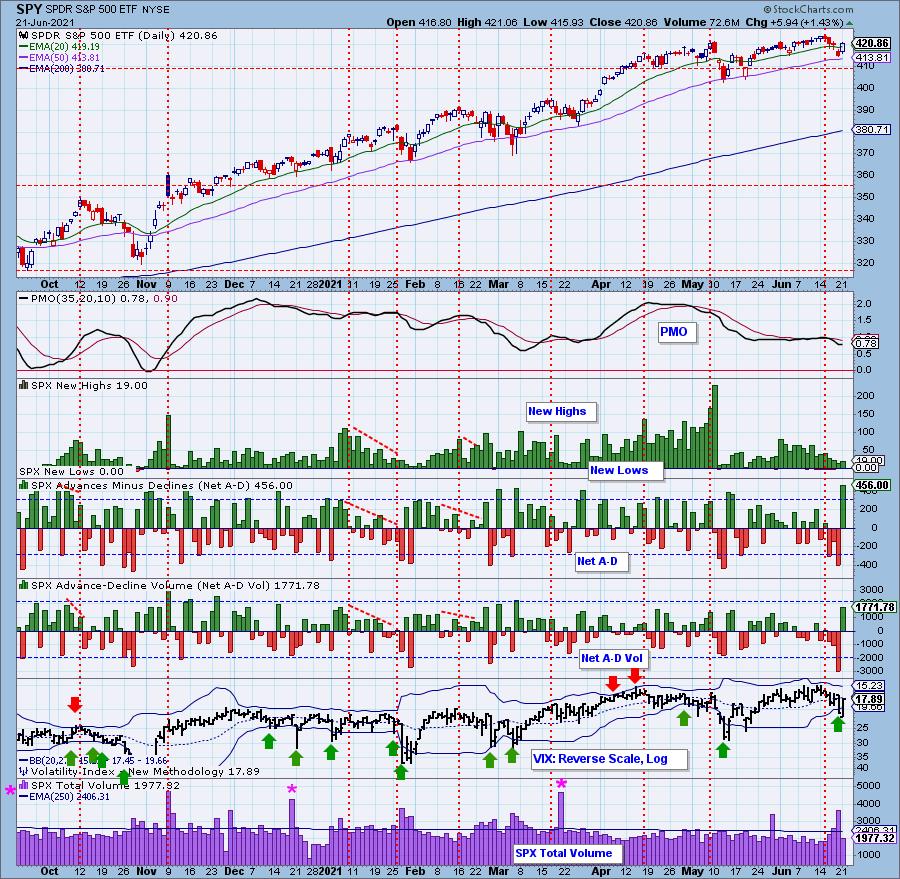
SPY Daily Chart: Today's bounce kept the rising trend intact, but notice it didn't overcome resistance at the May tops. The PMO is decelerating and the RSI has popped back into positive territory above net neutral (50). Total volume was puny today especially given the big rally. We do like to see high total volume on climax days, but we'll forgive that.
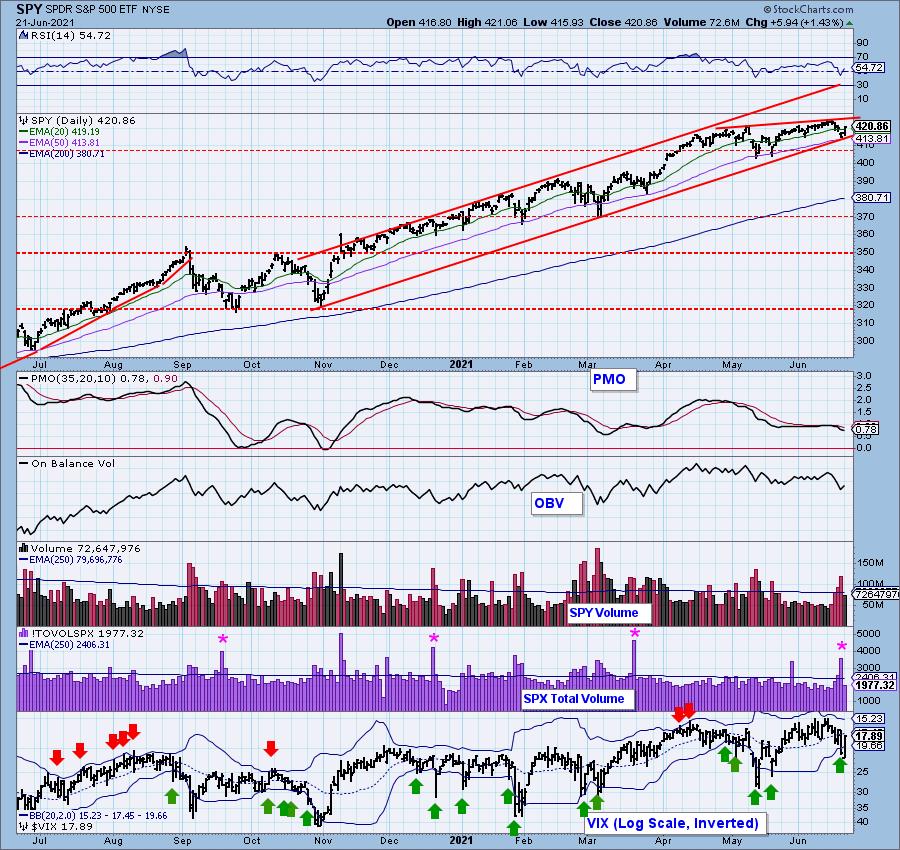
On Friday, the VIX closed below the lower Bollinger Band on the inverted scale. This generally occurs right before a short-term rally. Today's VIX high also punctured the Band suggesting we'll see follow-through on today's rally.
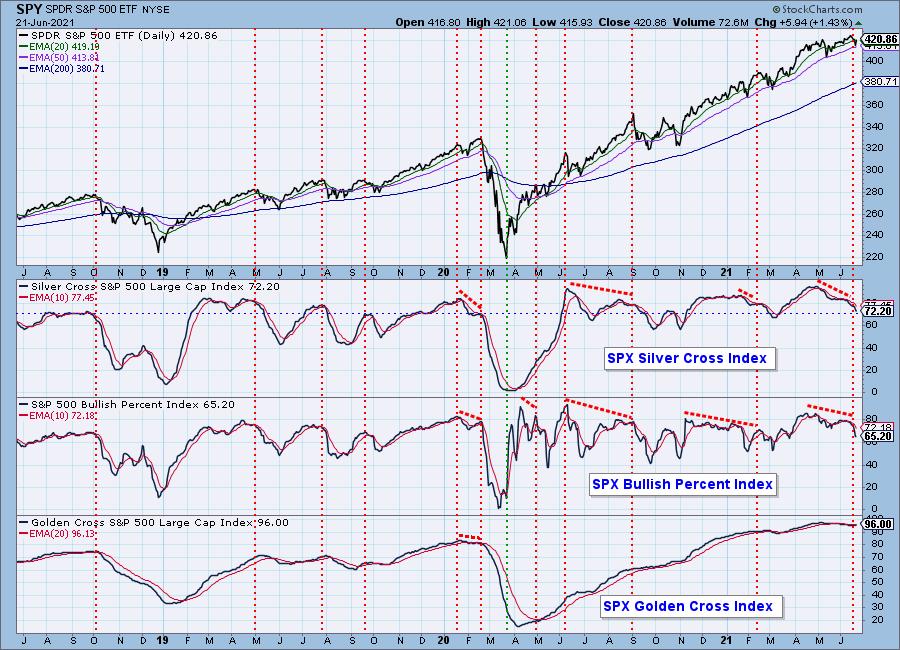
Participation: The following chart uses different methodologies for objectively showing the depth and trend of participation for intermediate- and long-term time frames.
- The Silver Cross Index (SCI) shows the percentage of SPX stocks on IT Trend Model BUY signals (20-EMA > 50-EMA).
- The Golden Cross Index (GCI) shows the percentage of SPX stocks on LT Trend Model BUY signals (50-EMA > 200-EMA).
- The Bullish Percent Index (BPI) shows the percentage of SPX stocks on Point & Figure BUY signals.
The SCI continued lower even on today's rally which is suspect. The BPI turned up, but didn't rise much; it's hard to even see it without a thumbnail. The GCI did continue higher, but remains very overbought.
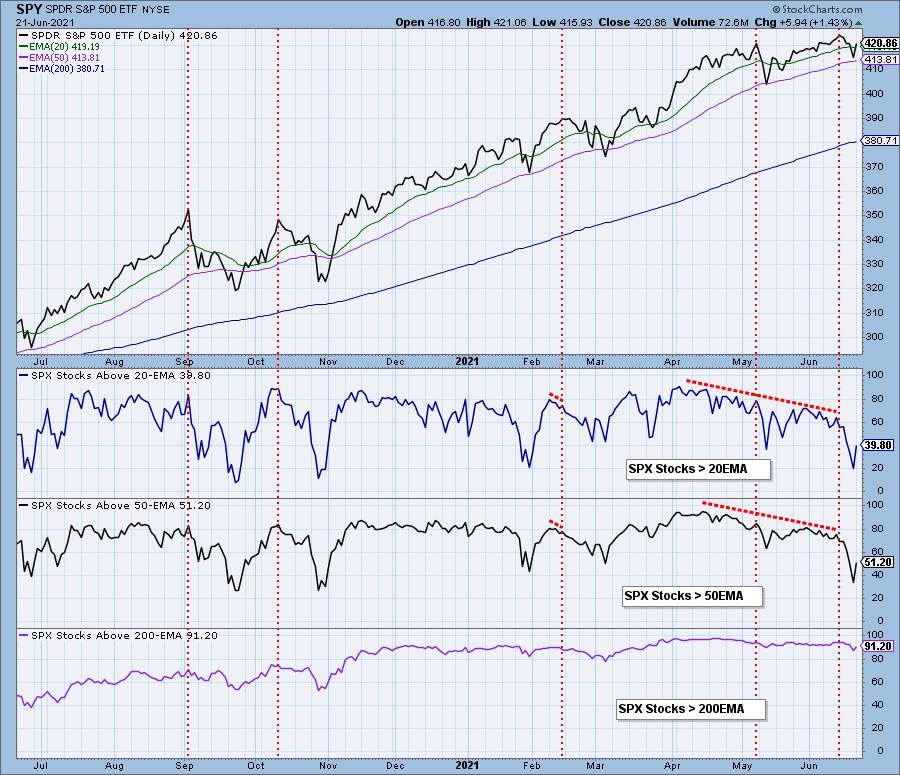
As we should expect, participation improved on today's rally. They're coming from oversold territory which is bullish for the short term.
Climax Analysis: The spike in Net Advances - Declines was well above our climax threshold, Net A-D Volume was elevated, but didn't actually move into the climax zone. We still consider it an indication of today's upside initiation climax. New Highs did expand, but not to the degree we would expect.
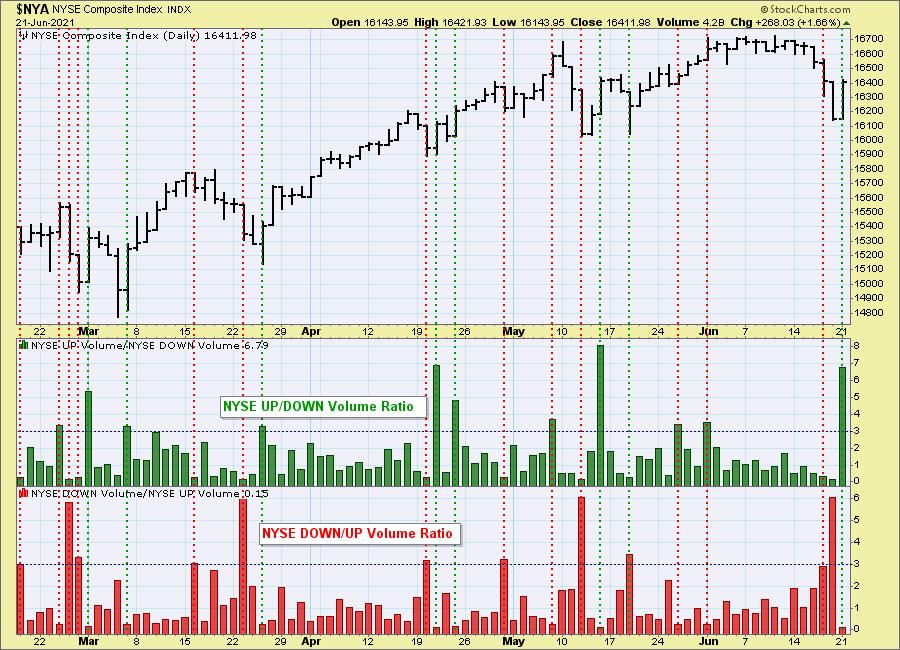
NYSE Up/Down and Down/Up volume ratios are also climax detectors. The 9:1 ratio suggested by the late Dr. Martin Zweig in his book, Winning on Wall Street, is especially significant, but we primarily look for spikes outside the normal range to clarify a particular event. We have an NYSE and S&P 500 version of the ratios, and normally they will only be published when there is a notable reading.
The volume ratios definitely confirm that today was a climax. Notice that elevated UP/DOWN volume coming on price lows typically lead to higher prices.
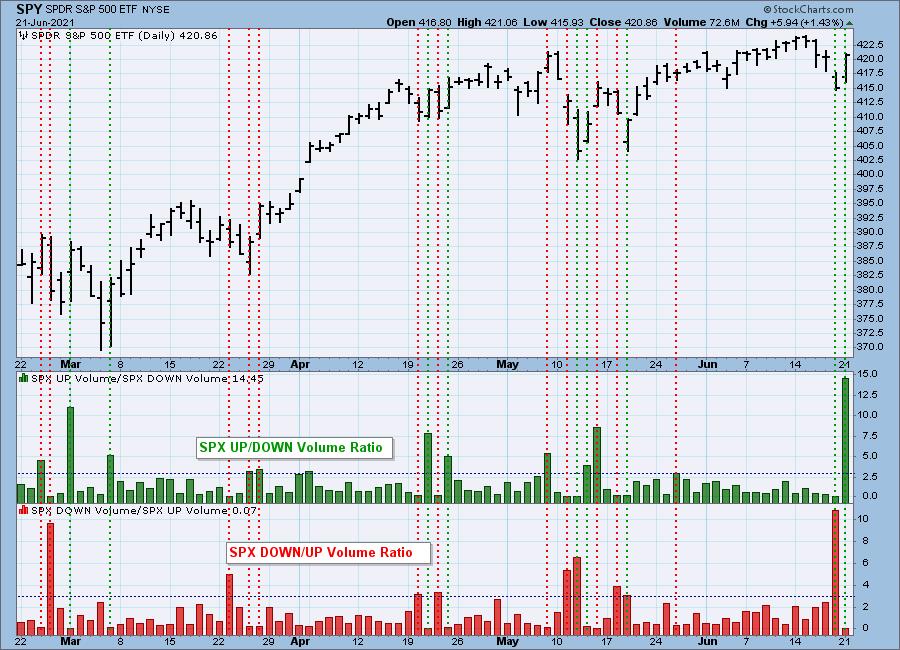
The S&P 500 version can get different results than the NYSE version because: (a) there are only 500 stocks versus a few thousand; and (b) those 500 stocks are all large-cap stocks that tend to move with more uniformity.
The ratio was off the charts for the SPX, also confirming today's upside initiation climax.
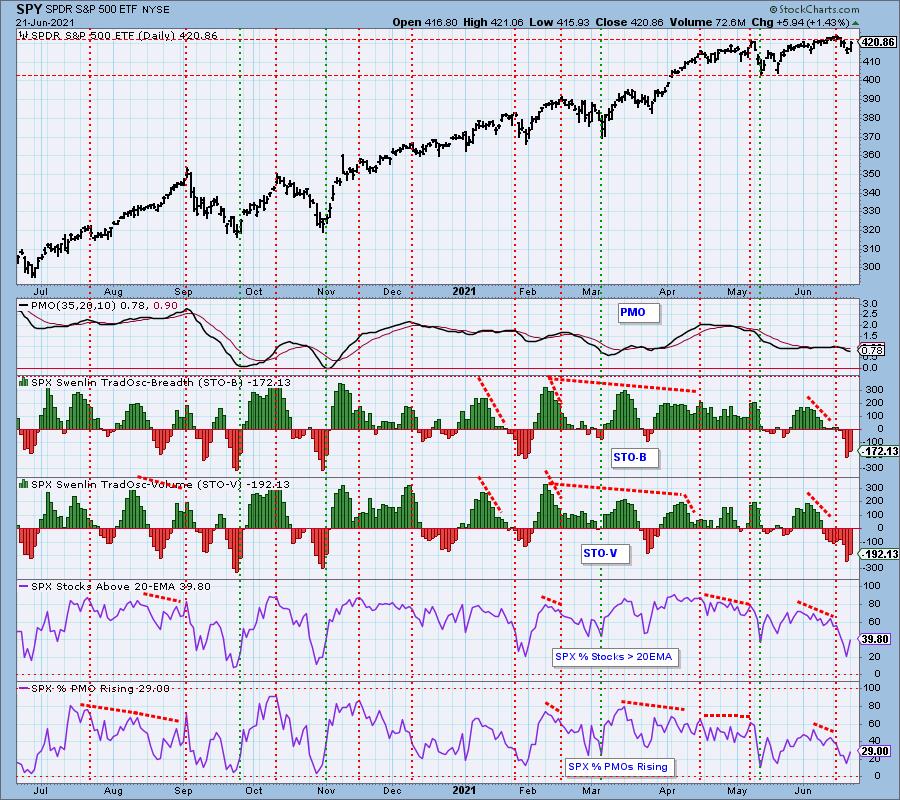
Short-Term Market Indicators: The short-term market trend is UP and the condition is OVERSOLD.
The STOs hit very oversold territory on Friday alongside the selling exhaustion. Now they are rising out of oversold conditions. This also suggests some more upside going into this week.
Intermediate-Term Market Indicators: The intermediate-term market trend is UP and the condition is NEUTRAL. The market bias is BULLISH.
The ITBM and ITVM continued lower today. They really aren't oversold yet, but they're getting there. %PMO BUY signals did rise slightly today.
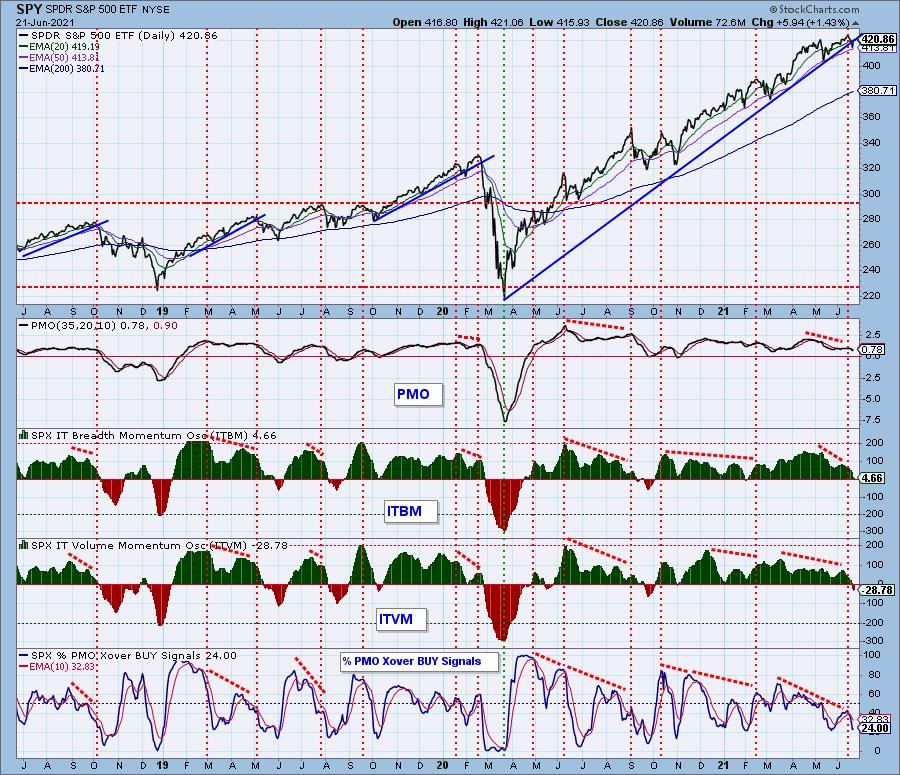
CONCLUSION: Today appears to be an upside initiation climax. Volume ratios are confirming it, as are the STOs which are rising out of oversold territory. Look for a short-term rally ahead with new all-time highs likely to be hit this week. However, intermediate-term indicators are less bullish as they continue lower despite today's buying spree. This should provide us with an opportunity to sell into strength in preparation for the storm that is still building based on the intermediate-term indicators.
Have you subscribed the DecisionPoint Diamonds yet? DP does the work for you by providing handpicked stocks/ETFs from exclusive DP scans! Add it with a discount! Contact support@decisionpoint.com for more information!
BITCOIN
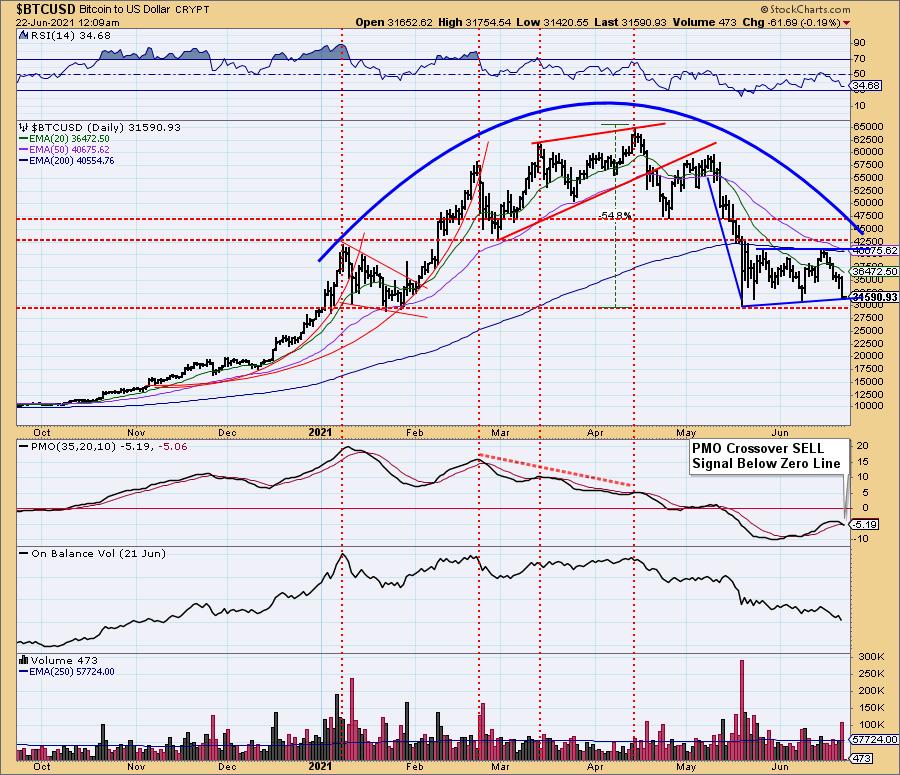
Bitcoin continues to oscillate between 30,000 and 42,000. It is at support now. The new PMO SELL signal well-below the zero line suggests support will finally give way.
INTEREST RATES
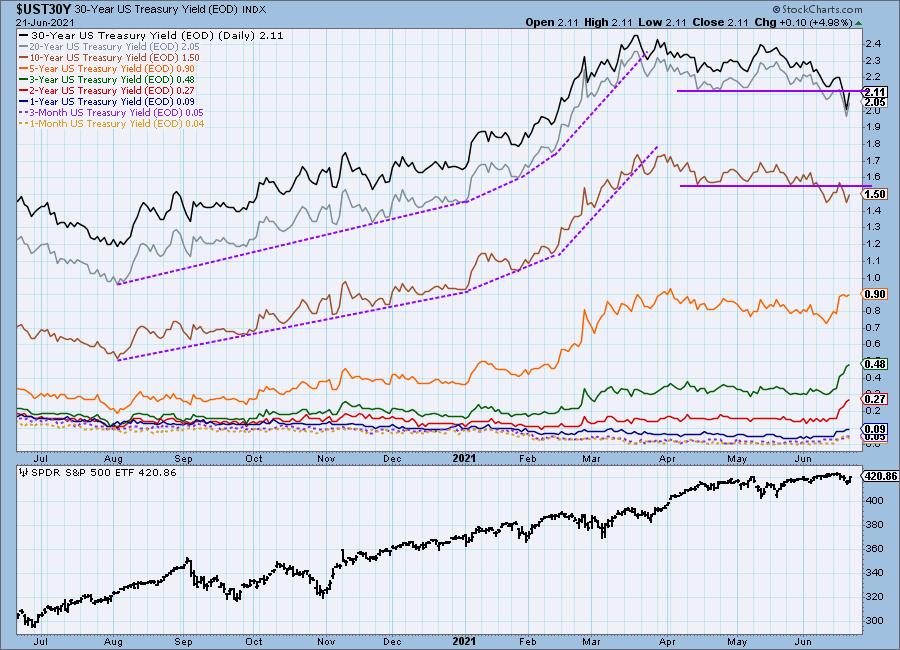
Yields are rebounding but haven't managed to climb above resistance yet.
10-YEAR T-BOND YIELD
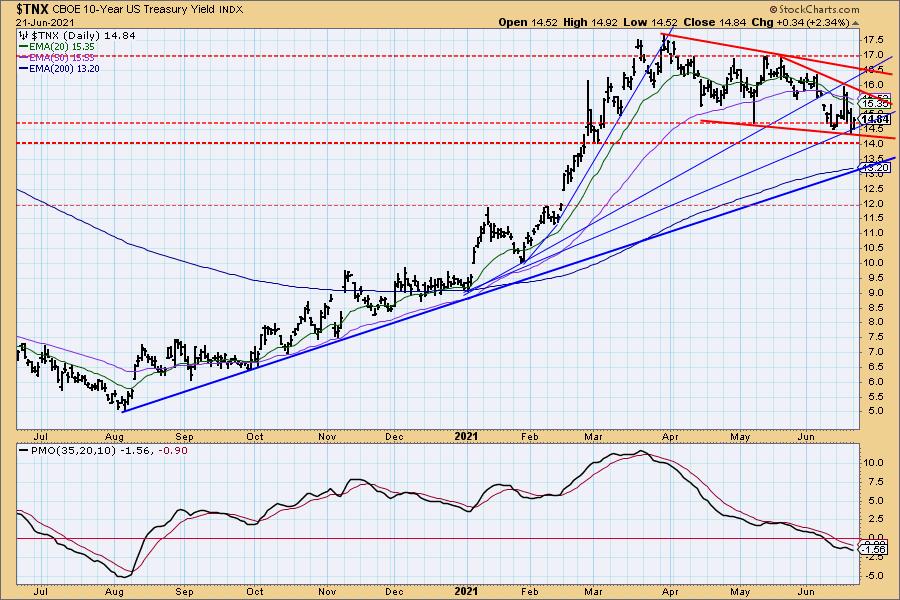
Yields appear ready to recapture support. There are two bullish falling wedges, one in the short term and one in the longer term. The rising trend out of the August low isn't being challenged yet. The support zone between 14.0 and 14.6 is strong.
DOLLAR (UUP)
IT Trend Model: SELL as of 4/26/2021
LT Trend Model: SELL as of 7/10/2020
UUP Daily Chart: After rallying strongly at the end of last week, it isn't surprising to see UUP pullback today. We should see an IT Trend Model "Silver Cross" BUY signal tomorrow. The PMO is now above the zero line. Today's pullback was very constructive as it took the RSI out of overbought territory.
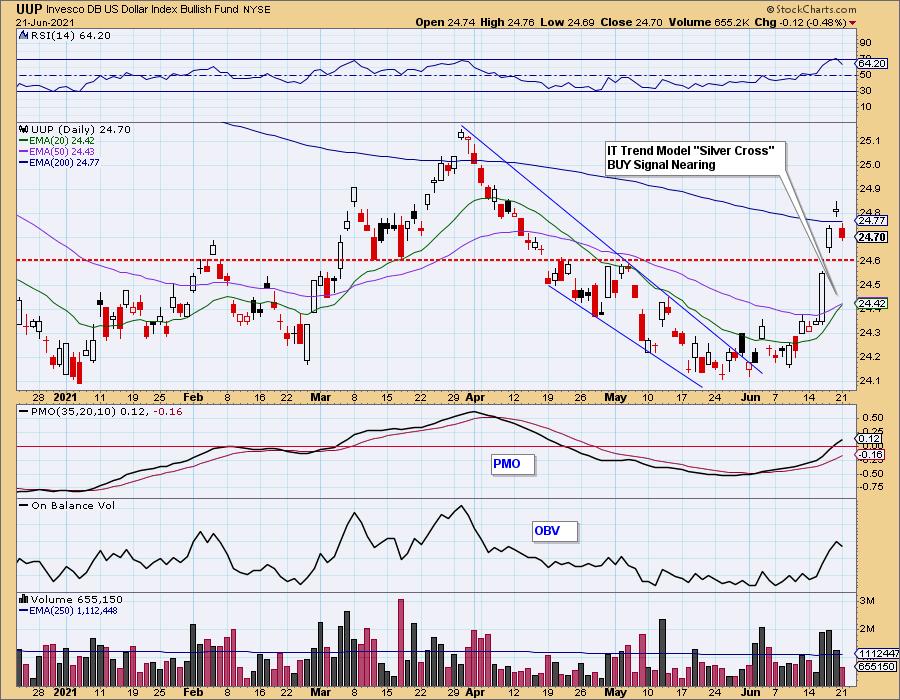
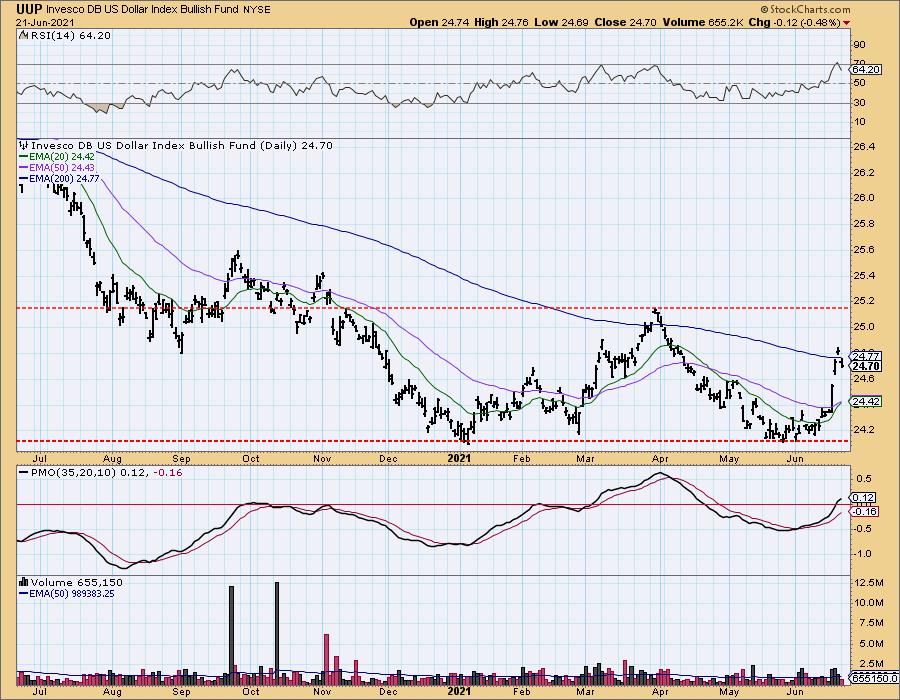
Support is available at $24.60. I would look for price to challenge the confirmation line (March top) of a large double-bottom that is forming.
GOLD
IT Trend Model: BUY as of 5/3/2021
LT Trend Model: BUY as of 5/24/2021
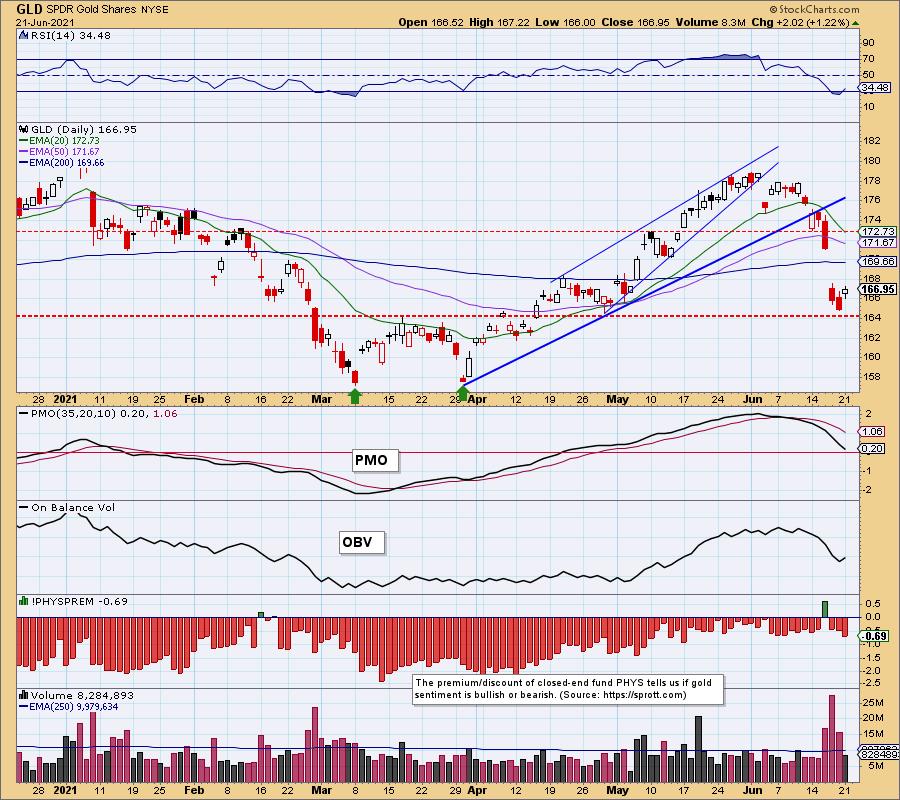
GLD Daily Chart: Gold rebounded, likely spurred on by a falling Dollar. This is occurring on support at the March top and late April low. We could be looking at a bullish reverse island formation. The RSI is rising out of oversold territory. The PMO isn't in agreement with that hypothesis as it should drop below zero very soon. We aren't seeing elevated discounts on PHYS so traders simply aren't bearish enough. Best case is consolidation on this support level. Worst case, a test of the March lows.
(Full Disclosure: I own GLD)
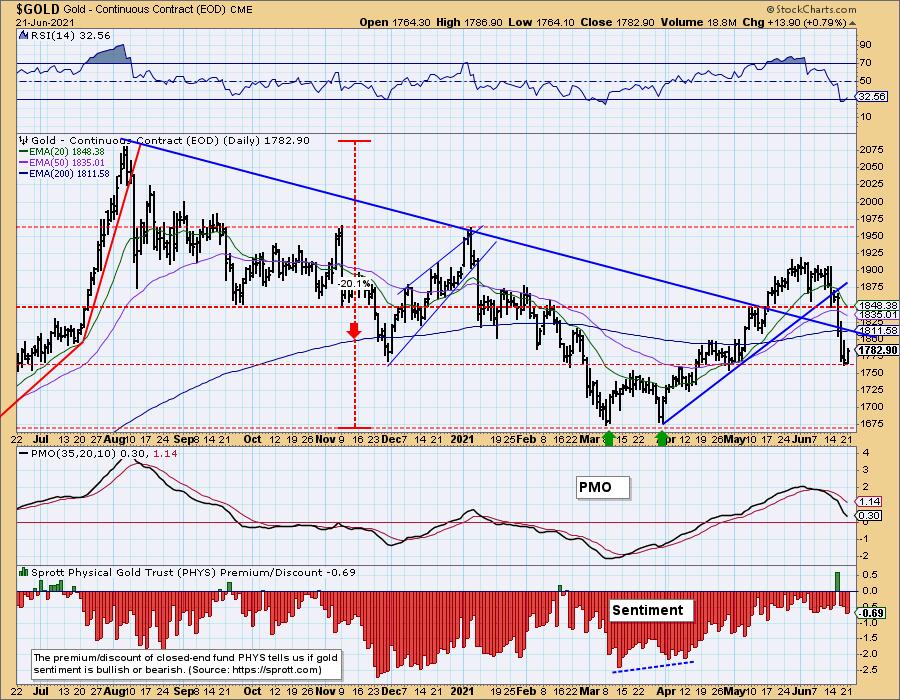
The $GOLD chart shows this bounce is arriving on support at the November low. This would be an excellent reversal point, but I am still looking for consolidation or an eventual breakdown.
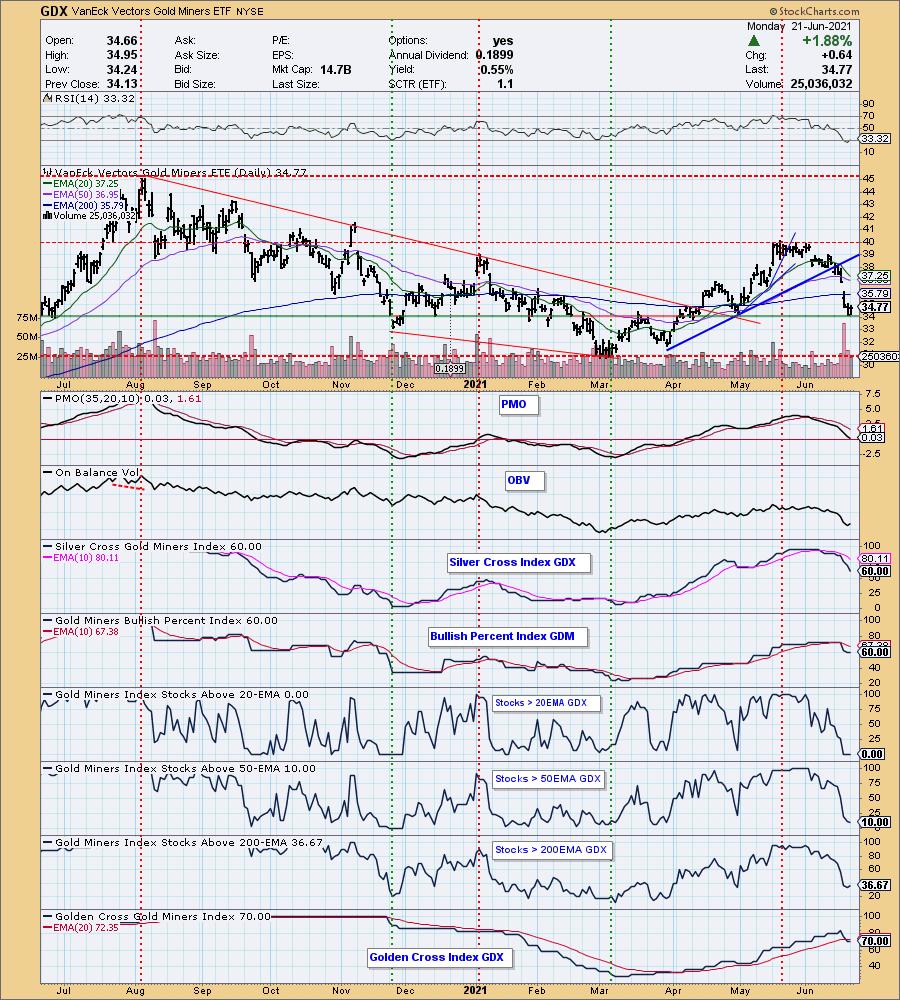
GOLD MINERS Golden and Silver Cross Indexes: Today's bounce on Gold Miners was encouraging. It comes along support at the April low and March top. The RSI is oversold and rising, as is participation. This could be a good reversal point, but I'm not bullish enough on Gold to take the plunge here. While GDX isn't dependent on Gold, it certainly is affected by it.
CRUDE OIL (USO)
IT Trend Model: BUY as of 11/23/2020
LT Trend Model: BUY as of 3/9/2021
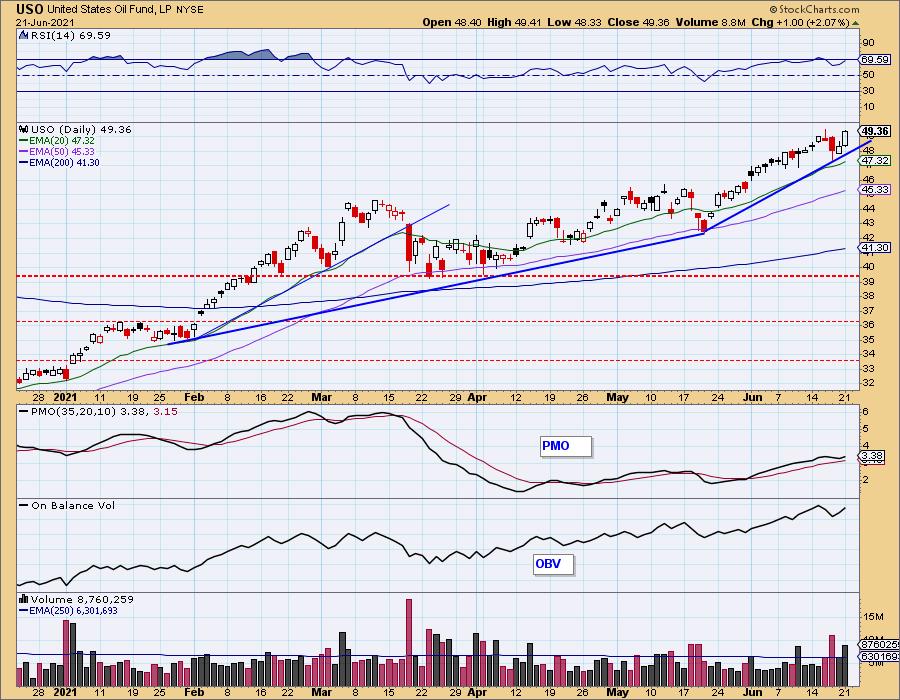
USO Daily Chart: USO pulled back last week which helped move the RSI out of overbought territory. However, Friday and today's rallies are pushing it right back into overbought territory. This isn't that bothersome. Notice that it was overbought almost the entire month of May. The new administration will continue to pressure fossil fuels with their policies so scarcity, summer traveling, etc. should keep prices rising.
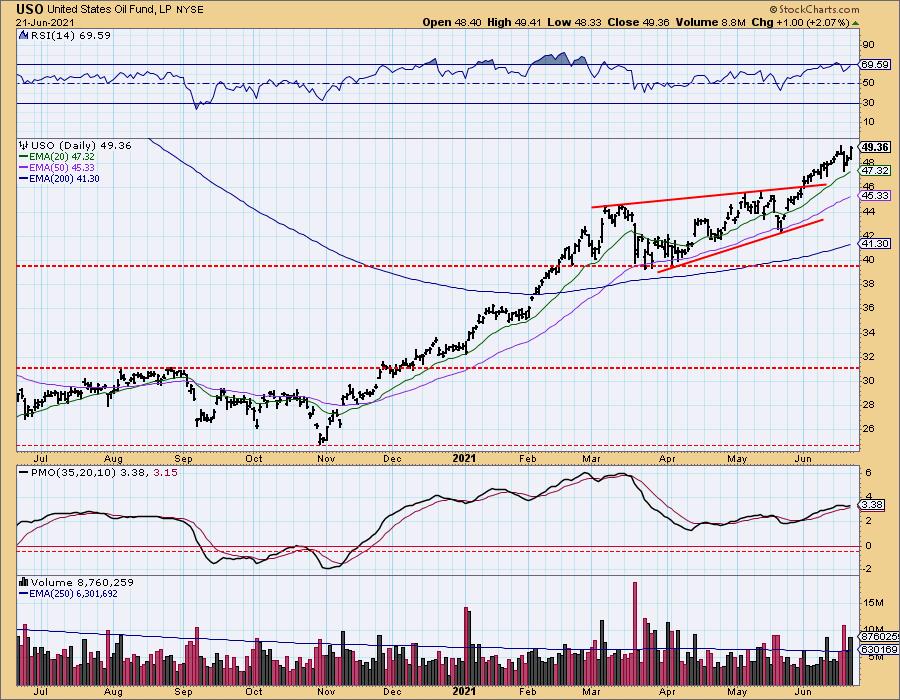
The bullish breakout from the bearish rising wedge hinted that the rally would continue, and so it has. The PMO has just bottomed above its signal line which is also very bullish.
BONDS (TLT)
IT Trend Model: NEUTRAL as of 8/27/2020
LT Trend Model: SELL as of 1/8/2021
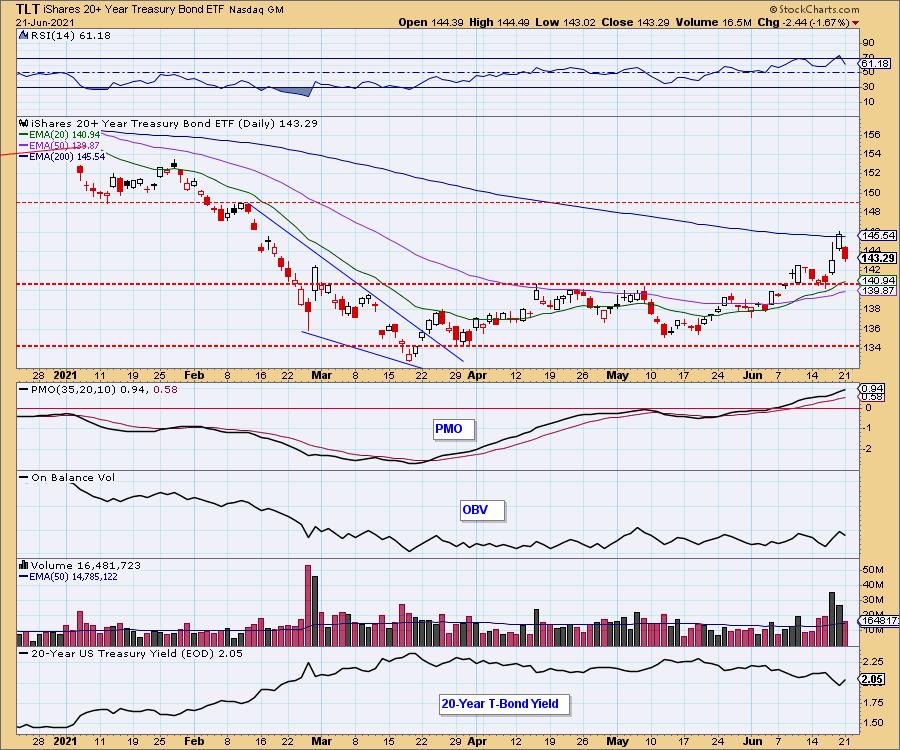
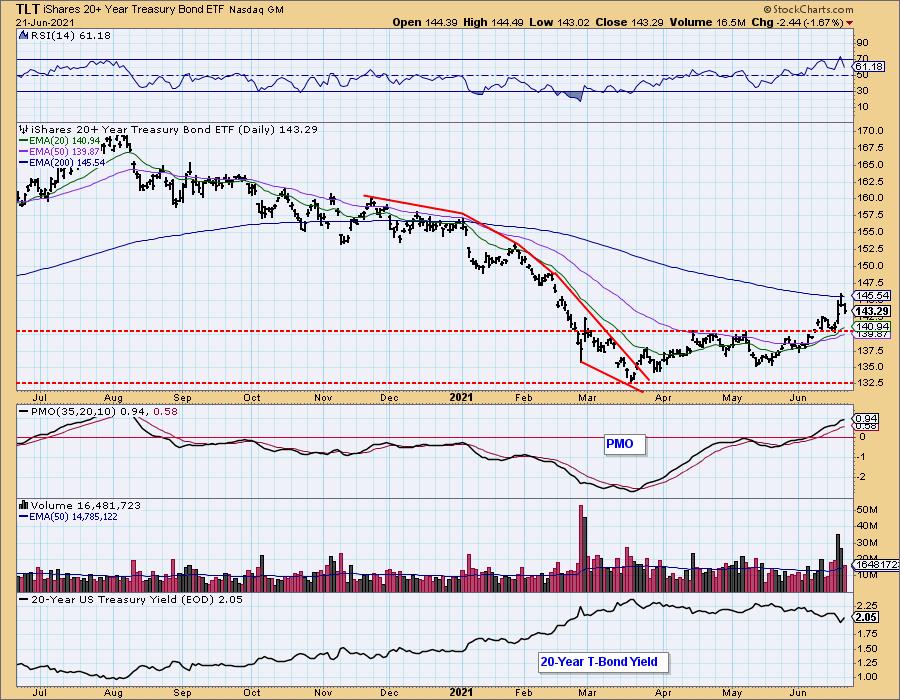
TLT Daily Chart: With yields rising, TLT took a hit. Technically it makes sense given it had just reached overhead resistance at the 200-EMA. Indicators are still positive and we know that yields are still bumping against resistance of their own. We should see TLT rally at support either at the prior June top or strong support at around $141.
Happy Charting!
Erin Swenlin
Technical Analysis is a windsock, not a crystal ball.
Disclaimer: This blog is for educational purposes only and should not be construed as financial advice. The ideas and strategies should never be used without first assessing your own personal and financial situation, or without consulting a financial professional. Any opinions expressed herein are solely those of the author, and do not in any way represent the views or opinions of any other person or entity.
NOTE: The signal status reported herein is based upon mechanical trading model signals, specifically, the DecisionPoint Trend Model. They define the implied bias of the price index based upon moving average relationships, but they do not necessarily call for a specific action. They are information flags that should prompt chart review. Further, they do not call for continuous buying or selling during the life of the signal. For example, a BUY signal will probably (but not necessarily) return the best results if action is taken soon after the signal is generated. Additional opportunities for buying may be found as price zigzags higher, but the trader must look for optimum entry points. Conversely, exit points to preserve gains (or minimize losses) may be evident before the model mechanically closes the signal.
Helpful DecisionPoint Links:
DecisionPoint Alert Chart List
DecisionPoint Golden Cross/Silver Cross Index Chart List
DecisionPoint Sector Chart List
Price Momentum Oscillator (PMO)
Swenlin Trading Oscillators (STO-B and STO-V)
DecisionPoint is not a registered investment advisor. Investment and trading decisions are solely your responsibility. DecisionPoint newsletters, blogs or website materials should NOT be interpreted as a recommendation or solicitation to buy or sell any security or to take any specific action.
