
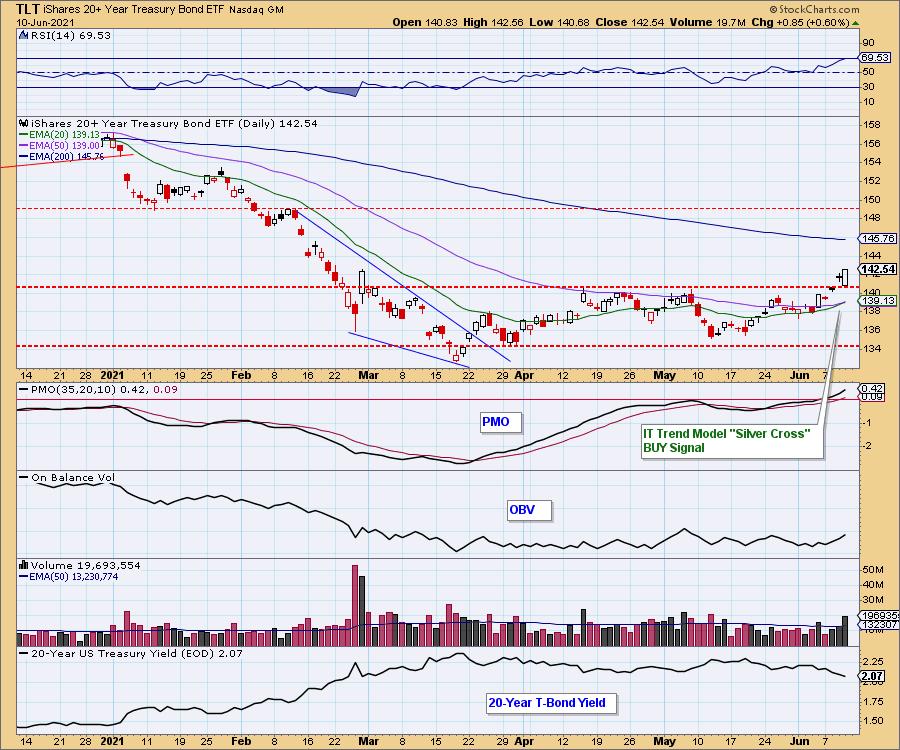
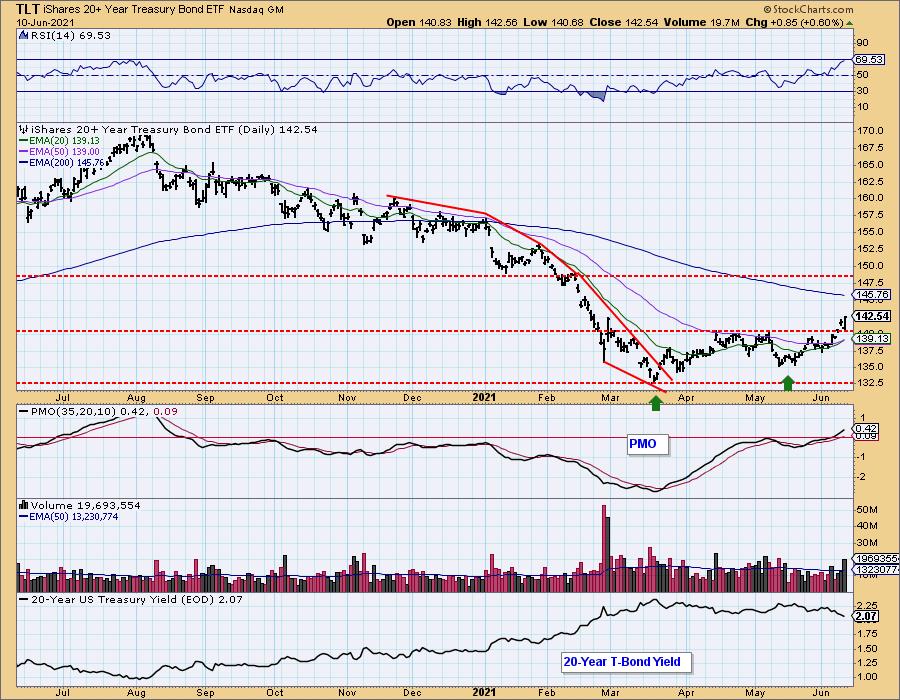
Bonds (TLT) had a "silver cross" of the 20/50-EMAs. This is an IT Trend Model BUY signal. With yields breaking down, we should see more rally out of TLT as well as other Bond ETFs. Additionally, today we have a very bullish engulfing candlestick on the daily chart. This implies we will see even higher prices going into next week.
The DecisionPoint Alert Weekly Wrap presents an end-of-week assessment of the trend and condition of the Stock Market, the U.S. Dollar, Gold, Crude Oil, and Bonds. The DecisionPoint Alert daily report (Monday through Thursday) is abbreviated and gives updates on the Weekly Wrap assessments.
Watch the latest episode of DecisionPoint on StockChartsTV.com and YouTube here!
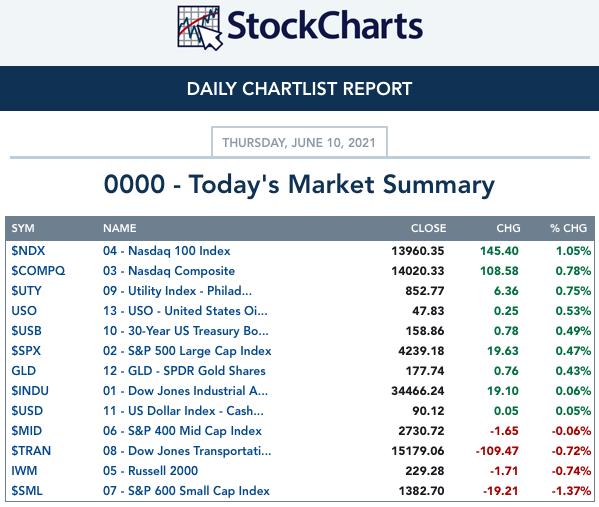
MAJOR MARKET INDEXES
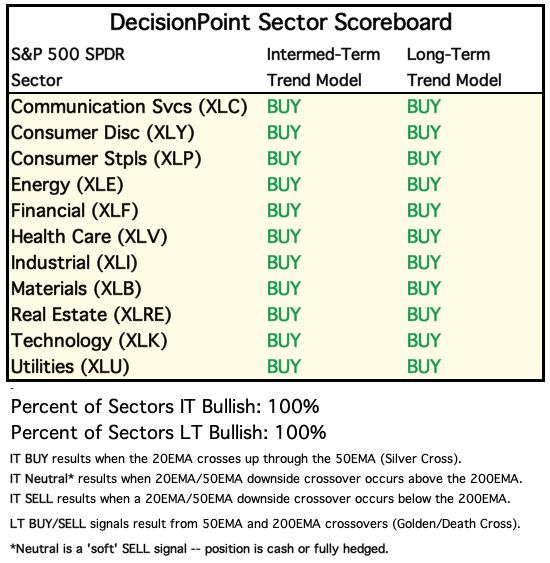
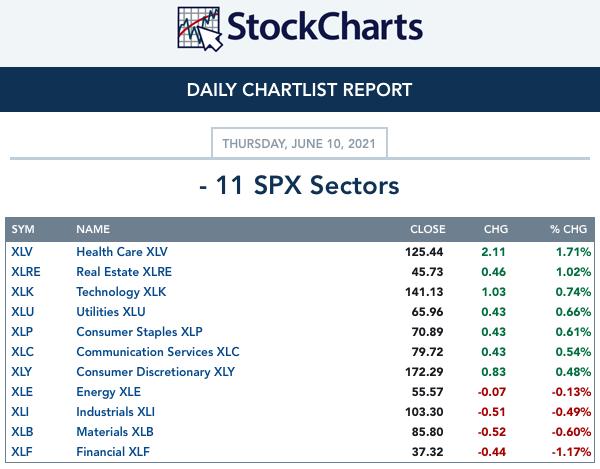
SECTORS
Each S&P 500 Index component stock is assigned to one, and only one, of 11 major sectors. This is a snapshot of the Intermediate-Term (Silver Cross) and Long-Term (Golden Cross) Trend Model signal status for those sectors.
CLICK HERE for Carl's annotated Sector charts.
THE MARKET (S&P 500)
IT Trend Model: BUY as of 5/8/2020
LT Trend Model: BUY as of 6/8/2020
SPY Daily Chart: We don't technically have a PMO Crossover BUY signal, but it is only off by a few hundredths of a point. It will appear tomorrow barring a downside price shock. New all-time highs were logged. Total volume remains well below the annual average.
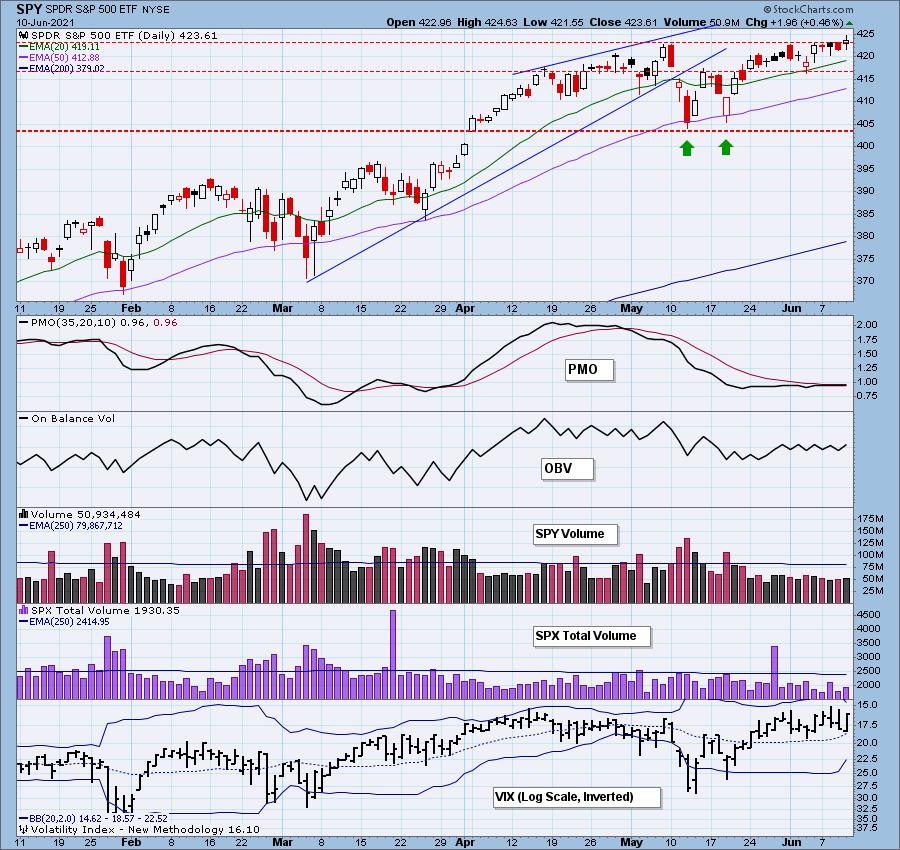
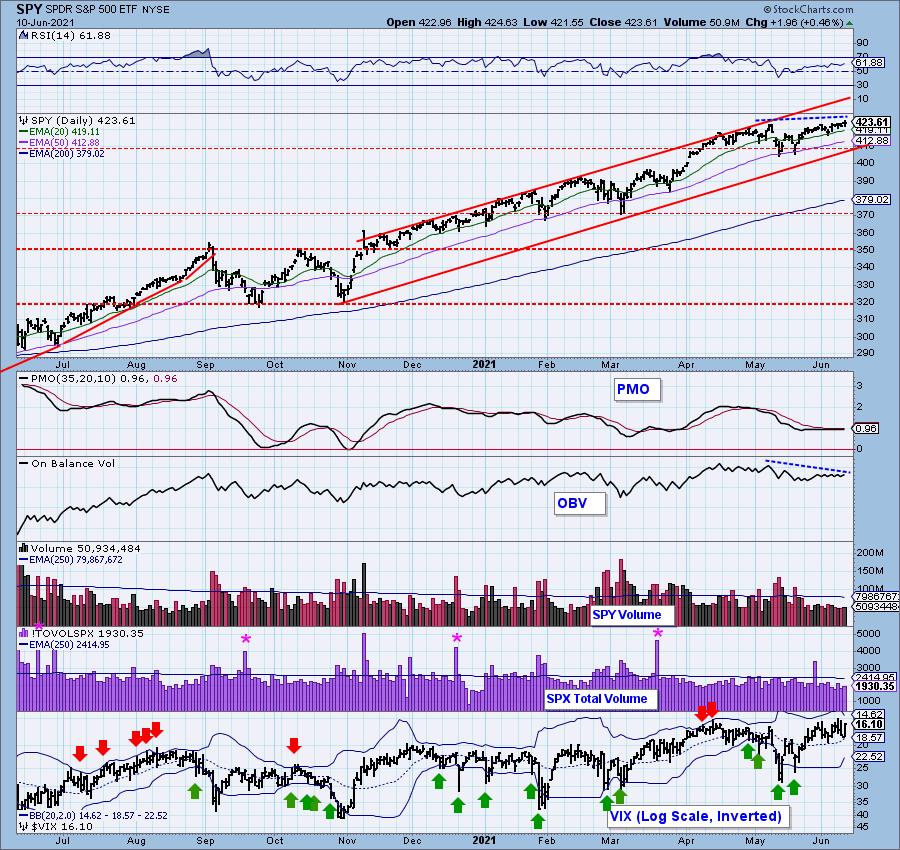
The RSI is still positive. The OBV is in a declining trend off previous all-time highs which sets up a negative divergence.

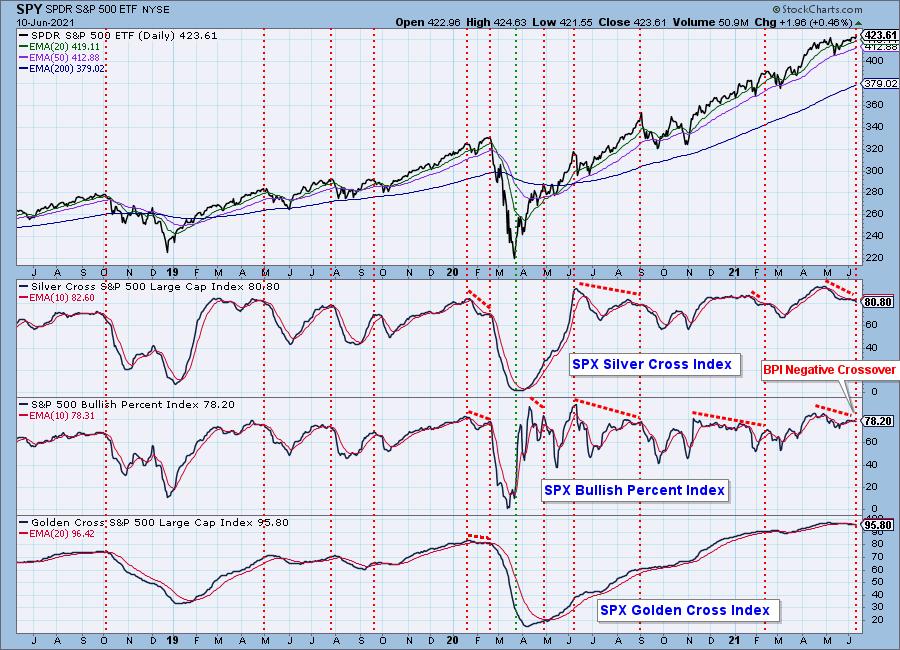
Participation: The following chart uses different methodologies for objectively showing the depth and trend of participation for intermediate- and long-term time frames.
- The Silver Cross Index (SCI) shows the percentage of SPX stocks on IT Trend Model BUY signals (20-EMA > 50-EMA).
- The Golden Cross Index (GCI) shows the percentage of SPX stocks on LT Trend Model BUY signals (50-EMA > 200-EMA).
- The Bullish Percent Index (BPI) shows the percentage of SPX stocks on Point & Figure BUY signals.
All of the indicators below contracted. The BPI had a negative crossover its signal line. The GCI and SCI are continuing lower since their negative crossovers their signal lines. The negative divergences are still in place.
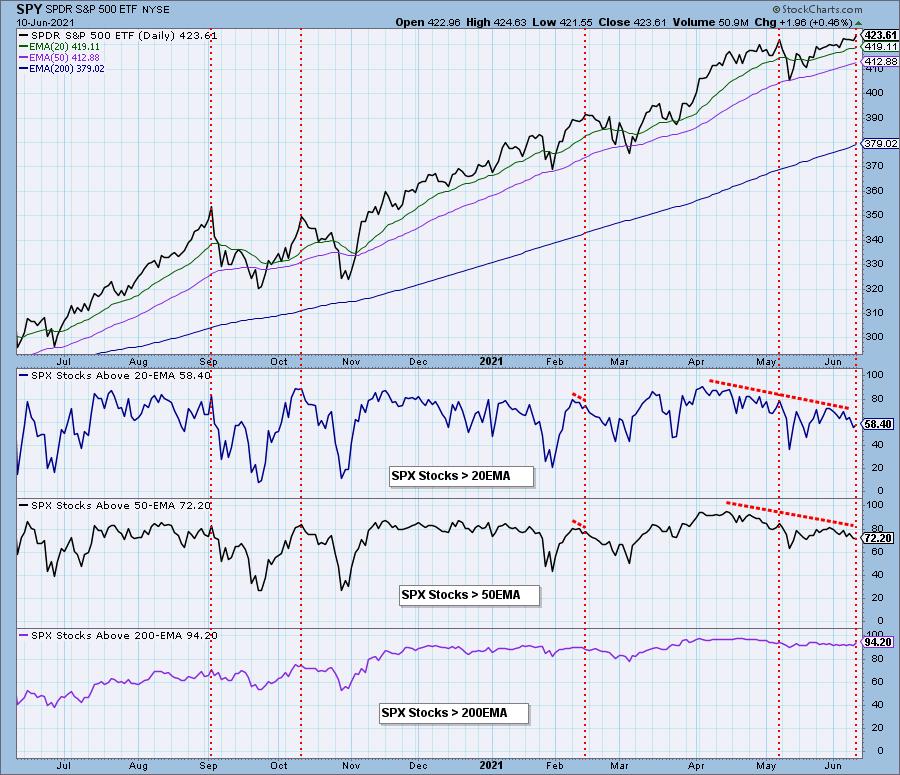
Participation barely registered positive moves on today's rally to new all-time highs. Just a little over one half of the SPX have price above their 20-EMAs. Clearly the rally is being carried by the larger cap-weighted stocks in the SPX.
Climax Analysis: No climax today. We did see an increase in New Highs, but the reading is still lower that the previous reading at the end of May. That's a negative divergence. The VIX does indicate that market participants are less worried than they were yesterday.
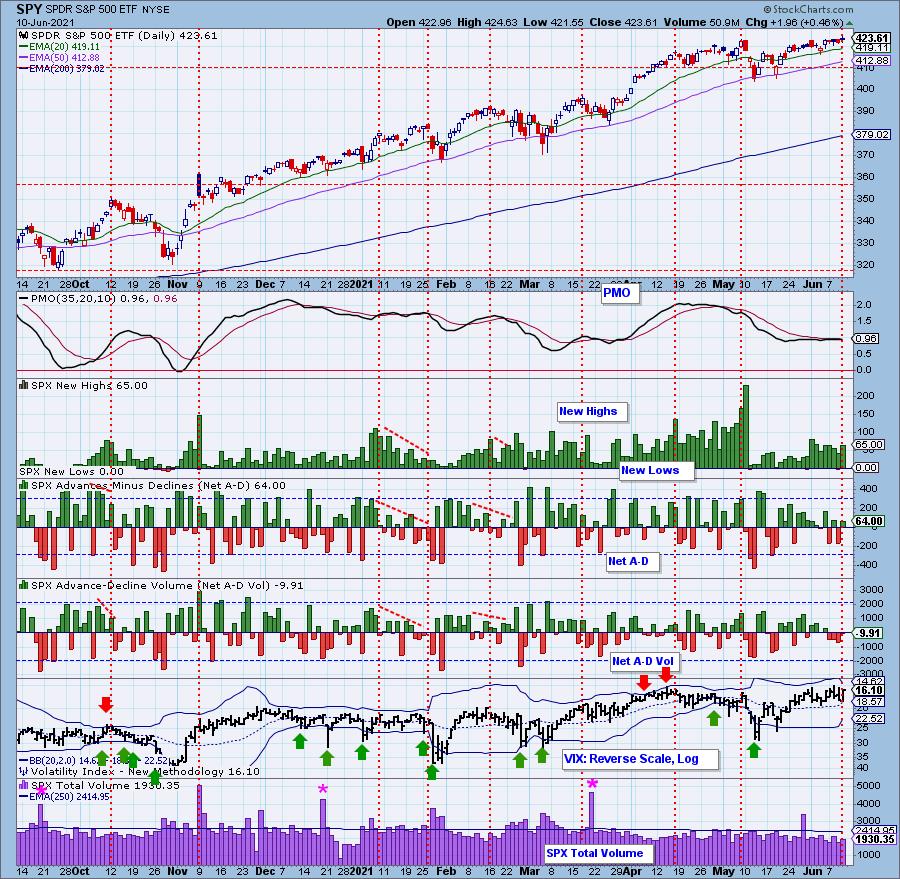
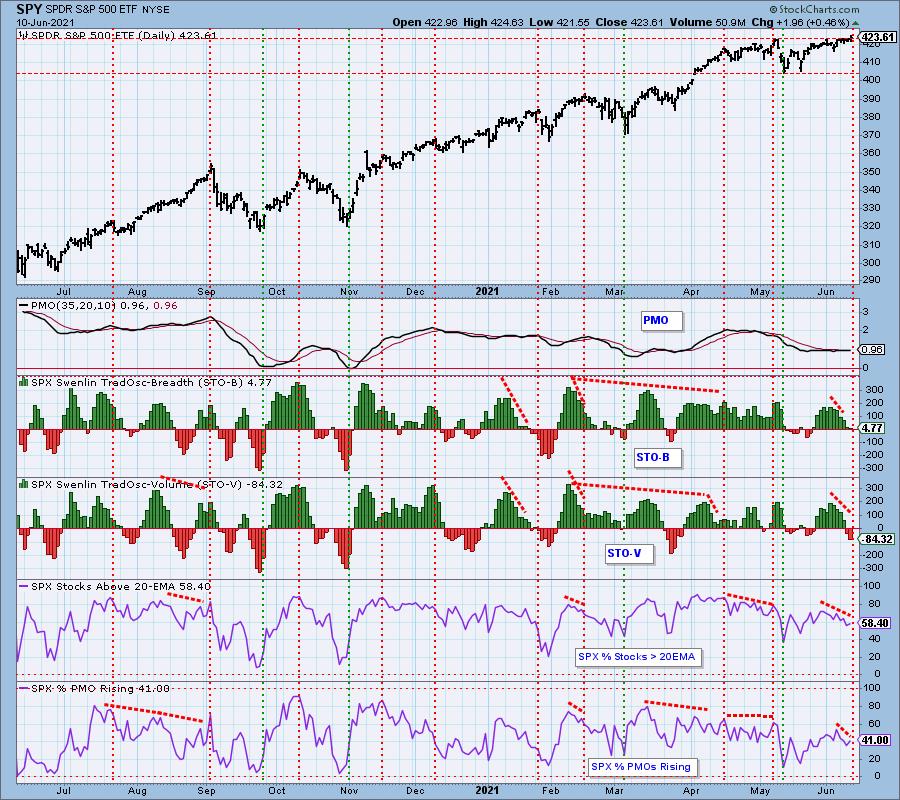
Short-Term Market Indicators: The short-term market trend is UP and the condition is NEUTRAL.
The STOs both declined and are in negative territory. On the one hand it is bearish to see them declining, but on the other hand, they are beginning to get near-term oversold. We still don't have even half of the SPX with rising momentum.
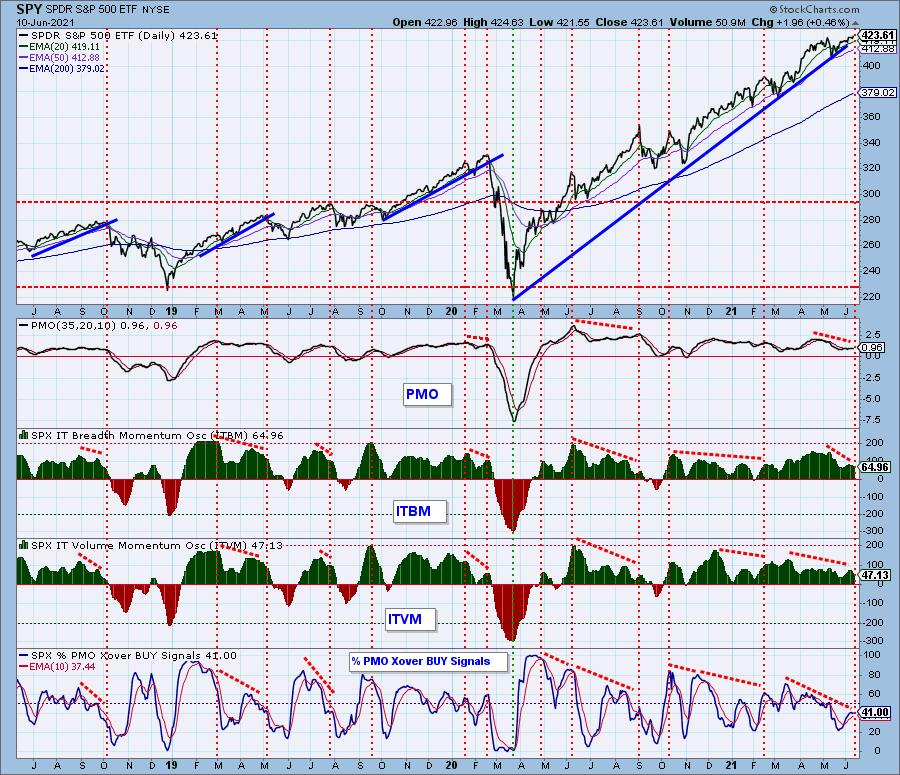
Intermediate-Term Market Indicators: The intermediate-term market trend is UP and the condition is NEUTRAL. The market bias is BULLISH.
The declines continue for the ITBM/ITVM, so negative divergences continue. We did see an additional 1% get PMO crossover BUY signals, but 41% is still exceedingly low considering we are at new all-time highs.
CONCLUSION: With new all-time highs logged, we would've liked to have seen an improvement in participation. That didn't happen. However, the VIX readings are moving lower. Market participants can finally quit holding their breath for new all-time highs to be hit. This could bolster price in the coming week. Additionally, big names like AAPL, ADBE, AMZN, GOOGL, MSFT, NVDA and V are all on PMO BUY signals and rising strongly. This is part of the reason we are seeing negative divergences. Market prices can move higher on the backs of these stocks, but in order to sustain a rally, the rest of the stocks need to get on board. Since they are not on board, the market will likely falter or not move much higher. Negative divergences certainly suggest this. We are likely in for more sideways push and pull between bulls and bears.
Carl expounded on my discussion regarding equal-weight indicators on cap-weighted indexes from yesterday's conclusion. So here are his comments for clarification:
"We need to determine from where an indicator is derived. Market indicators (breadth-type indicators based upon individual advances and declines, or A-D volume, etc., within a market/sector index) are equal-weighted. Indicators derived from the price index (RSI, PMO, etc.) are not equal-weighted, but reflect only the movement of that individual price index.
In cap-weighted indexes, index price will be heavily influenced by the largest-cap stocks in the index, and can often move differently than what the equal-weight indicators tell us to expect. The indicator itself in not cap-weighted per se, but is certainly influenced by index composition.
Bottom line is that negative divergences at market index price tops, for example, strongly indicate that a decline is on the way, but the large-cap stocks can override indications generated by the smaller-cap stocks in the index."
Have you subscribed the DecisionPoint Diamonds yet? DP does the work for you by providing handpicked stocks/ETFs from exclusive DP scans! Add it with a discount! Contact support@decisionpoint.com for more information!
BITCOIN
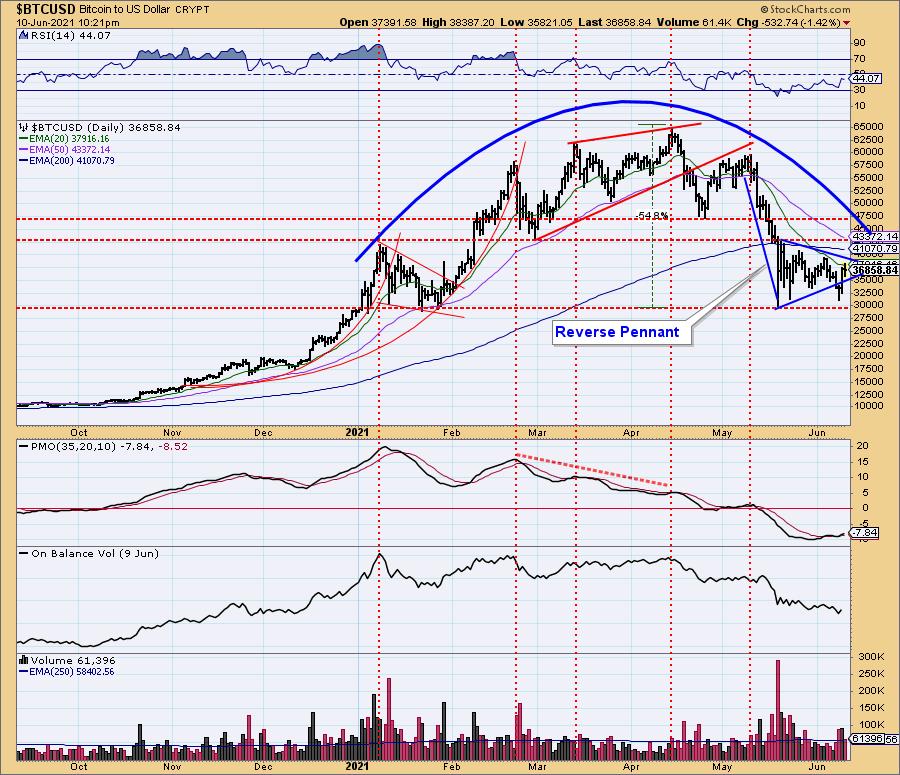
Momentum has shifted back to the upside, but the RSI is still negative. The pennant is looking more like a reverse flag. Both are bearish. Currently the 20-EMA is holding as overhead resistance. I'm looking for another test at 30,000.
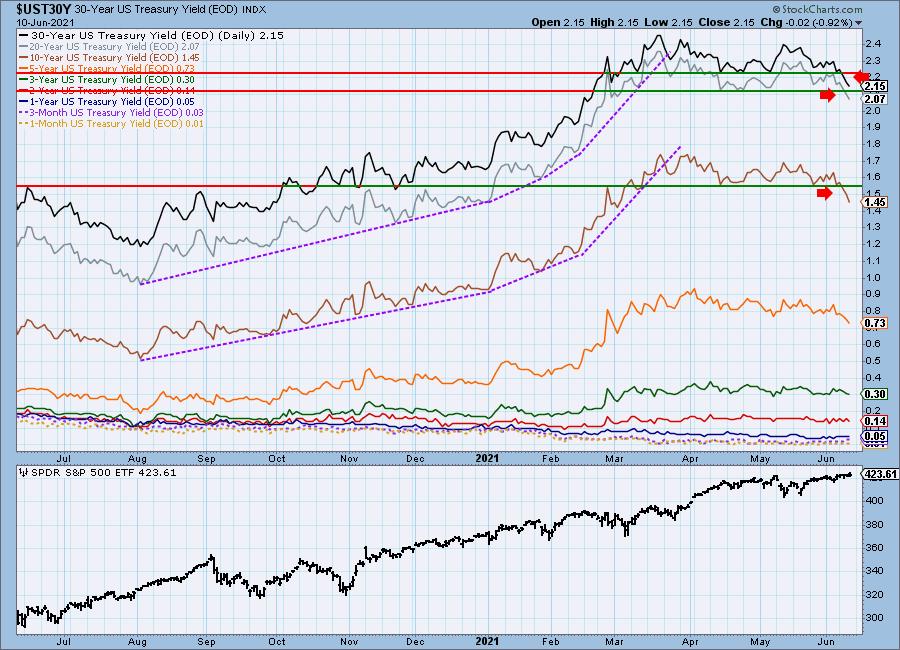
INTEREST RATES
Long-term yields are breaking down below support. Bonds should get a big lift.
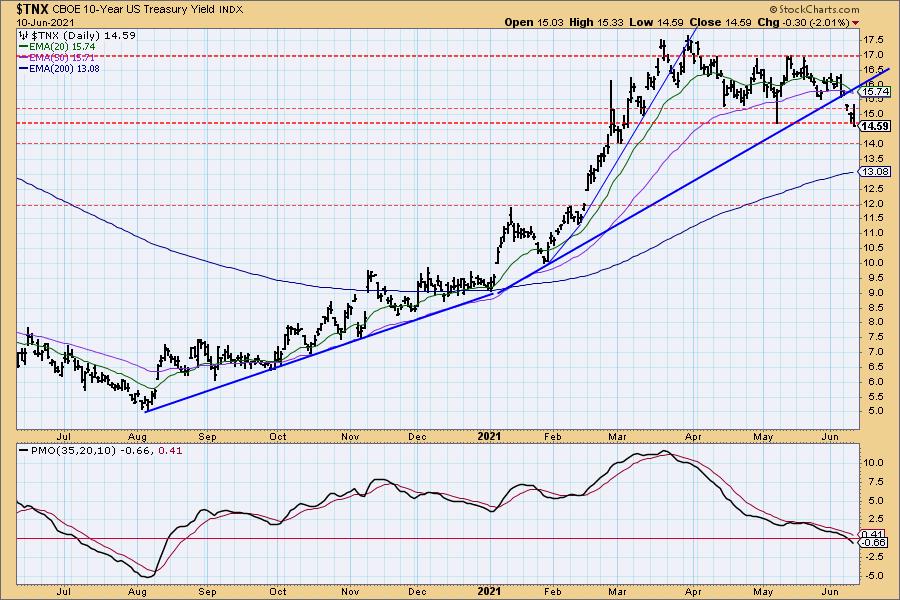
10-YEAR T-BOND YIELD
Today $TNX closed below support. The rising trend was broken significantly with a gap down. The PMO is now in negative territory. Look for a test at 14.
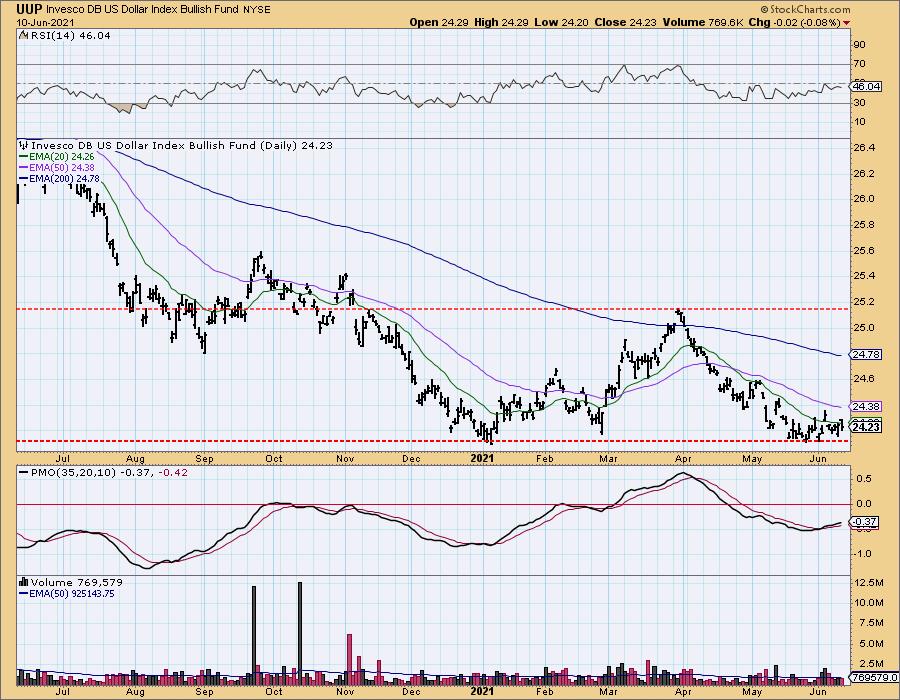
DOLLAR (UUP)
IT Trend Model: SELL as of 4/26/2021
LT Trend Model: SELL as of 7/10/2020
UUP Daily Chart: Trading remains messy on the Dollar. Price did make its way up above the 20-EMA intraday, but closed beneath. It's hard to make much of price action since the May low, but I see a megaphone pattern. These are typically bearish. The RSI is negative. The one positive is that the PMO is rising on a crossover BUY signal.
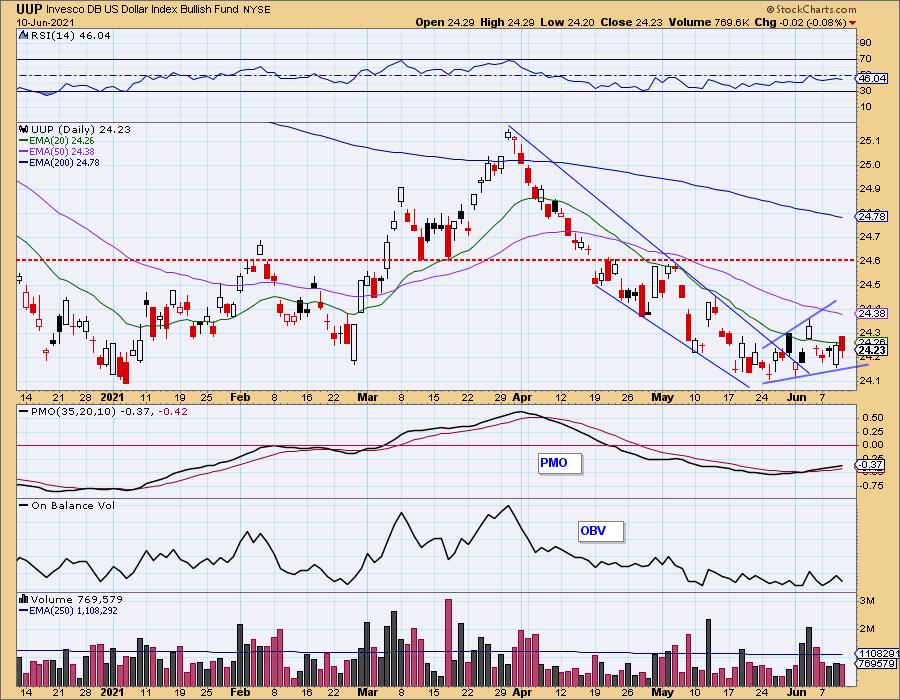
I'll have more faith in this rally if price can stay above the 20-EMA for more than one trading day.
GOLD
IT Trend Model: BUY as of 5/3/2021
LT Trend Model: BUY as of 5/24/2021
GLD Daily Chart: Gold is consolidating after gapping down last week. Gap resistance is holding. The PMO is in decline, but other than the initial gap down, price hasn't seen much damage. The RSI is still positive. I suspect Gold will continue to move sideways until the 20-EMA is tested. That's where we should get a good bounce.
(Full Disclosure: I own GLD)
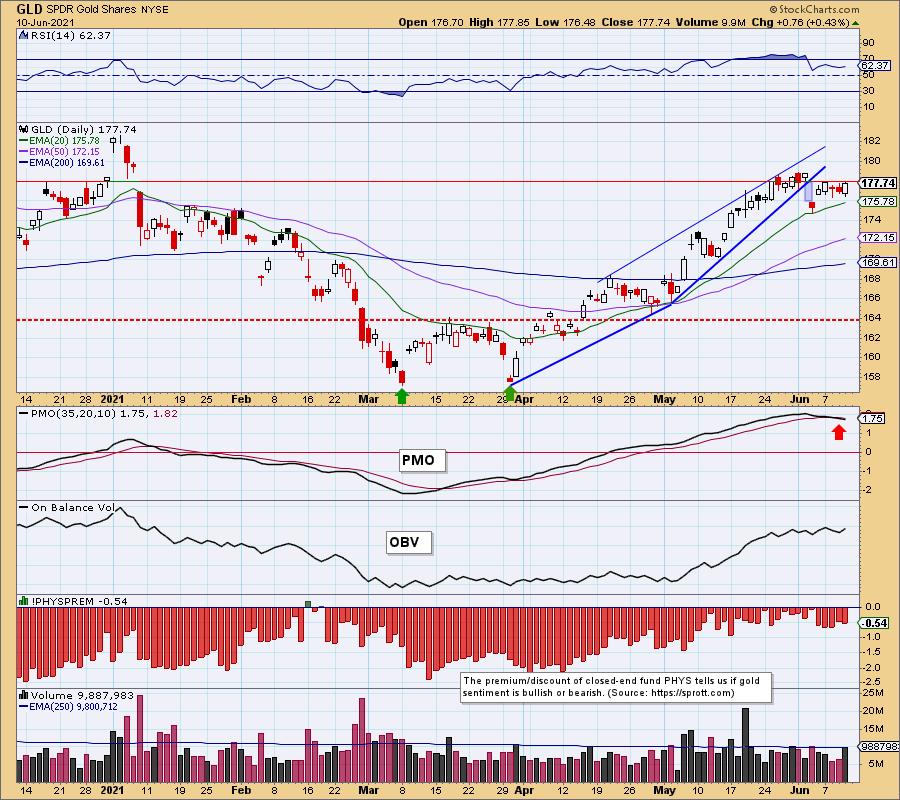
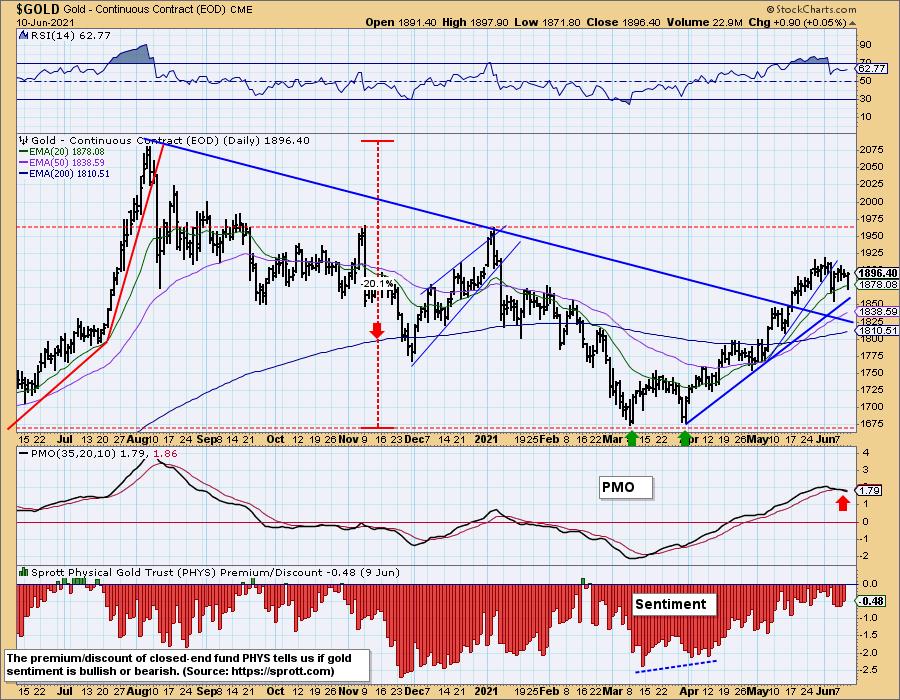
Sentiment is less bearish. We want to see higher discounts as that is typically when we see upside reversals. Overall the rising trend is intact. Gold should continue higher after it finishes consolidating.
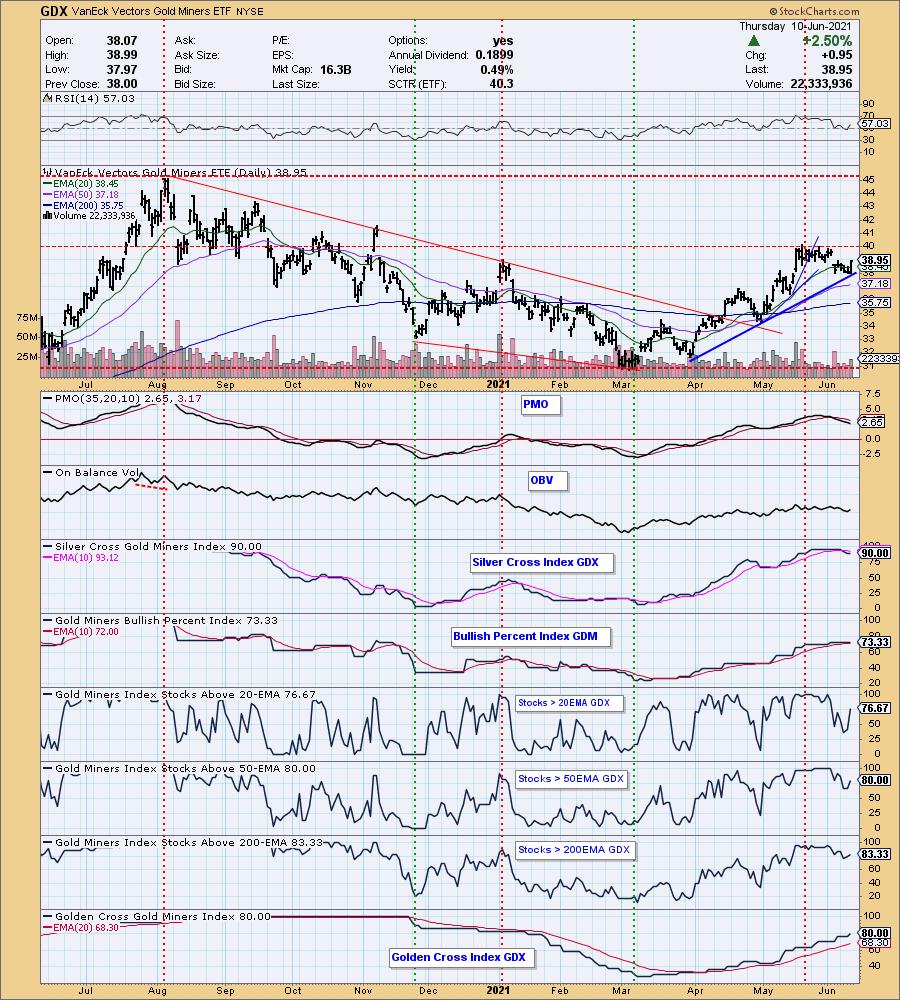
GOLD MINERS Golden and Silver Cross Indexes: Ha! I was looking for the rising trend to be broken today and instead price bounced strongly off the rising trendline. This bodes well. Notice the improvement in participation after just one good rally. I'll be more bullish when the SCI, BPI and of course PMO turn higher.
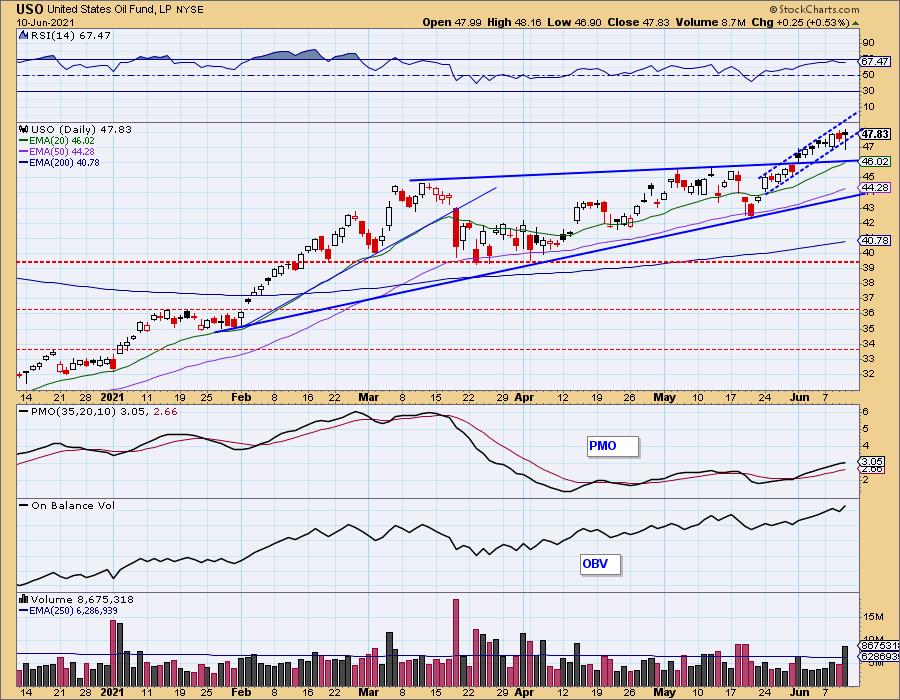
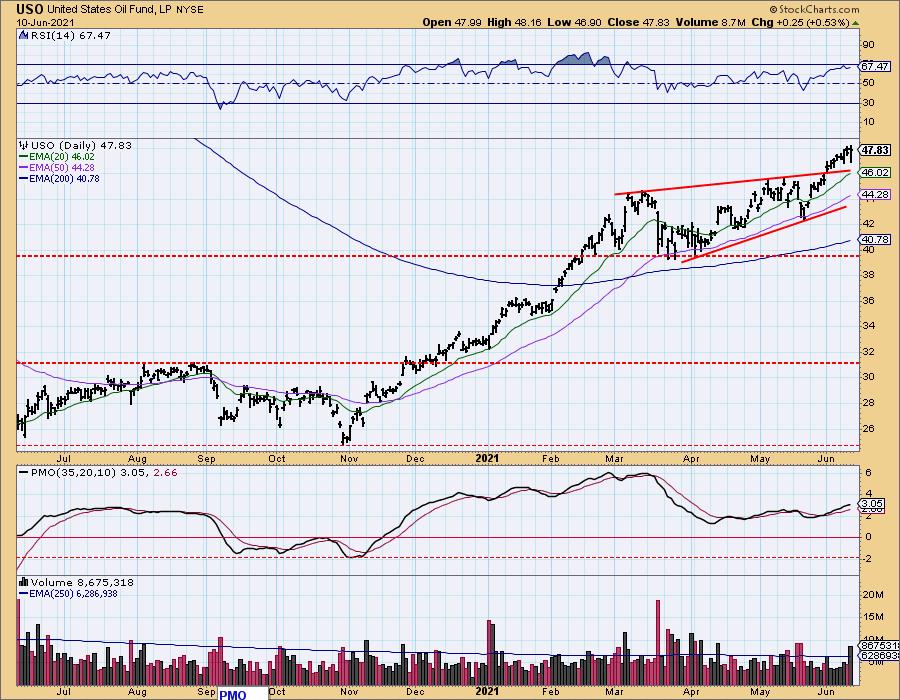
CRUDE OIL (USO)
IT Trend Model: BUY as of 11/23/2020
LT Trend Model: BUY as of 3/9/2021
USO Daily Chart: USO is in a tight rising trend channel. Intraday price broke below it, but ultimately closed near its intraday high and within the channel. The RSI is positive and not overbought. The PMO is rising and also is not overbought. Higher crude oil prices should continue.
BONDS (TLT)
IT Trend Model: NEUTRAL as of 8/27/2020
LT Trend Model: SELL as of 1/8/2021
TLT Daily Chart: I discussed the new IT Trend Model "Silver Cross" BUY signal in today's opening. The PMO is rising and is now in positive territory. The RSI is positive but getting a bit overbought. You can make a case for a large double-bottom pattern that has executed with the breakout above the April/May highs. The minimum upside target would take price above the 200-EMA to resistance at the January low. Yields will likely continue lower so we could see that target reached.
Happy Charting!
Erin Swenlin
Technical Analysis is a windsock, not a crystal ball.
Disclaimer: This blog is for educational purposes only and should not be construed as financial advice. The ideas and strategies should never be used without first assessing your own personal and financial situation, or without consulting a financial professional. Any opinions expressed herein are solely those of the author, and do not in any way represent the views or opinions of any other person or entity.
NOTE: The signal status reported herein is based upon mechanical trading model signals, specifically, the DecisionPoint Trend Model. They define the implied bias of the price index based upon moving average relationships, but they do not necessarily call for a specific action. They are information flags that should prompt chart review. Further, they do not call for continuous buying or selling during the life of the signal. For example, a BUY signal will probably (but not necessarily) return the best results if action is taken soon after the signal is generated. Additional opportunities for buying may be found as price zigzags higher, but the trader must look for optimum entry points. Conversely, exit points to preserve gains (or minimize losses) may be evident before the model mechanically closes the signal.
Helpful DecisionPoint Links:
DecisionPoint Alert Chart List
DecisionPoint Golden Cross/Silver Cross Index Chart List
DecisionPoint Sector Chart List
Price Momentum Oscillator (PMO)
Swenlin Trading Oscillators (STO-B and STO-V)
DecisionPoint is not a registered investment advisor. Investment and trading decisions are solely your responsibility. DecisionPoint newsletters, blogs or website materials should NOT be interpreted as a recommendation or solicitation to buy or sell any security or to take any specific action.